Home > Analyses > Technology > Monolithic Power Systems, Inc.
Monolithic Power Systems transforms everyday electronics by powering devices with precision and efficiency. Its semiconductor solutions drive innovation in computing, automotive, and industrial markets worldwide. Renowned for cutting-edge DC to DC integrated circuits, the company fuels everything from laptops to medical equipment with reliable voltage control. As it navigates competitive pressures and evolving technology, I ask whether Monolithic Power’s robust fundamentals still support its premium valuation and growth ambitions.
Table of contents
Business Model & Company Overview
Monolithic Power Systems, Inc. is a leading semiconductor company founded in 1997 and headquartered in Kirkland, Washington. It dominates by delivering an integrated ecosystem of power electronics solutions tailored for computing, automotive, industrial, and consumer markets. Its core mission centers on designing DC to DC integrated circuits that optimize voltage control across diverse electronic systems, creating a seamless interface between power management and device performance.
The company’s revenue engine balances cutting-edge hardware with specialized ICs used in applications like portable electronics, automotive infotainment, and medical devices. It leverages a strategic global footprint spanning the Americas, Europe, and Asia, selling through distributors and direct OEM channels. Monolithic Power Systems’ economic moat lies in its advanced semiconductor design capabilities and broad market reach, shaping the future of power efficiency in electronics.
Financial Performance & Fundamental Metrics
I analyze Monolithic Power Systems, Inc.’s income statement, key financial ratios, and dividend payout policy to assess its profitability and capital efficiency.
Income Statement
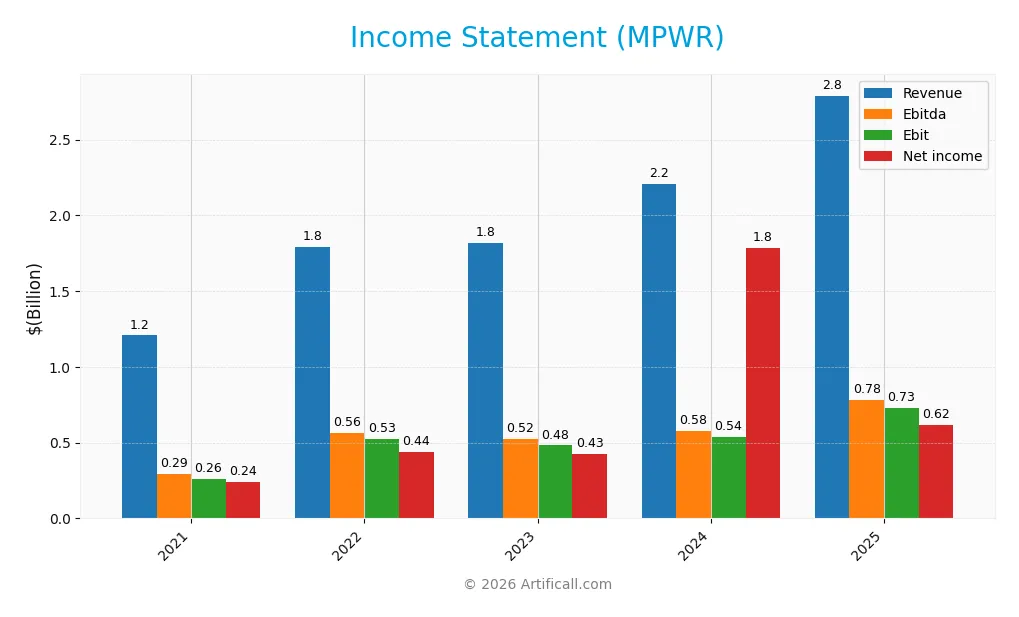
This table summarizes Monolithic Power Systems, Inc.’s annual income statement metrics from 2021 to 2025 in USD, highlighting key profitability and expense figures.
| 2021 | 2022 | 2023 | 2024 | 2025 | |
|---|---|---|---|---|---|
| Revenue | 1.21B | 1.79B | 1.82B | 2.21B | 2.79B |
| Cost of Revenue | 522M | 746M | 800M | 986M | 1.25B |
| Operating Expenses | 423M | 522M | 539M | 682M | 811M |
| Gross Profit | 685M | 1.05B | 1.02B | 1.22B | 1.54B |
| EBITDA | 291M | 564M | 522M | 576M | 780M |
| EBIT | 262M | 527M | 482M | 539M | 729M |
| Interest Expense | 0 | 0 | 0 | 0 | 0 |
| Net Income | 242M | 438M | 427M | 1.79B | 616M |
| EPS | 5.28 | 9.37 | 8.98 | 36.76 | 12.82 |
| Filing Date | 2022-02-25 | 2023-02-24 | 2024-02-29 | 2025-03-03 | 2026-02-27 |
Income Statement Evolution
From 2021 to 2025, Monolithic Power Systems’ revenue surged 131% to $2.79B, reflecting strong demand expansion. Gross profit rose proportionally by 26% year-over-year in 2025, sustaining a favorable 55.18% gross margin. EBIT expanded 35% in the last year, lifting operating margins to a robust 26.11%, signaling improved operational efficiency despite rising expenses.
Is the Income Statement Favorable?
The 2025 income statement shows solid fundamentals with a net margin of 22.07% and zero interest expense, enhancing profitability. However, net income and EPS declined sharply year-over-year by 73% and 65%, respectively, driven by a $1.5B drop in net income after an unusual tax impact in 2024. Overall, 86% of key metrics remain favorable, indicating a predominantly strong but cautious outlook.
Financial Ratios
The table below presents key financial ratios for Monolithic Power Systems, Inc. (MPWR) over the last five fiscal years, offering insight into the company’s profitability, liquidity, leverage, and valuation:
| Ratios | 2021 | 2022 | 2023 | 2024 | 2025 |
|---|---|---|---|---|---|
| Net Margin | 20.0% | 24.4% | 23.5% | 81.0% | 22.1% |
| ROE | 19.5% | 26.2% | 20.8% | 56.8% | 16.6% |
| ROIC | 17.2% | 24.5% | 18.5% | 16.2% | 14.9% |
| P/E | 93.5 | 37.8 | 70.3 | 16.1 | 70.7 |
| P/B | 18.2 | 9.9 | 14.6 | 9.1 | 11.7 |
| Current Ratio | 5.0 | 5.4 | 7.7 | 5.3 | 5.9 |
| Quick Ratio | 3.8 | 3.7 | 6.1 | 3.9 | 4.4 |
| D/E | 0.0 | 0.0 | 0.0 | 0.005 | 0.0 |
| Debt-to-Assets | 0.0 | 0.001 | 0.002 | 0.004 | 0.0 |
| Interest Coverage | 0 | 0 | 0 | 0 | 0 |
| Asset Turnover | 0.76 | 0.87 | 0.75 | 0.61 | 0.65 |
| Fixed Asset Turnover | 3.33 | 5.02 | 4.94 | 4.17 | 4.45 |
| Dividend Yield | 0.48% | 0.83% | 0.62% | 0.84% | 0.65% |
Evolution of Financial Ratios
Monolithic Power Systems’ Return on Equity (ROE) improved steadily, reaching 16.55% in 2025, signaling enhanced shareholder profitability. The Current Ratio fluctuated but remained high, peaking at 7.74 in 2023 before settling at 5.91 in 2025, indicating strong liquidity. Debt-to-Equity Ratio stayed at zero, reflecting a debt-free capital structure throughout the period.
Are the Financial Ratios Favorable?
In 2025, profitability ratios like net margin (22.07%) and ROE (16.55%) were favorable, outperforming many sector peers. Liquidity showed mixed signals: a strong quick ratio (4.38) contrasts with an unfavorable current ratio (5.91), suggesting excess current assets. Leverage remains favorable with zero debt and infinite interest coverage. Market valuation ratios such as P/E (70.69) and P/B (11.7) appear stretched, marking some caution. Overall, 57% of ratios are favorable, supporting a generally positive financial profile.
Shareholder Return Policy
Monolithic Power Systems, Inc. pays dividends with a payout ratio near 46% and a dividend yield around 0.65% in 2025. The company maintains a steady dividend per share increase and covers payouts comfortably with free cash flow, indicating disciplined capital allocation.
The firm also engages in share buybacks, supporting shareholder returns beyond dividends. This balanced approach of dividends and buybacks aligns with sustainable long-term value creation, given consistent profitability and strong cash flow metrics.
Score analysis
The radar chart below illustrates Monolithic Power Systems, Inc.’s key financial metric scores for comprehensive evaluation:
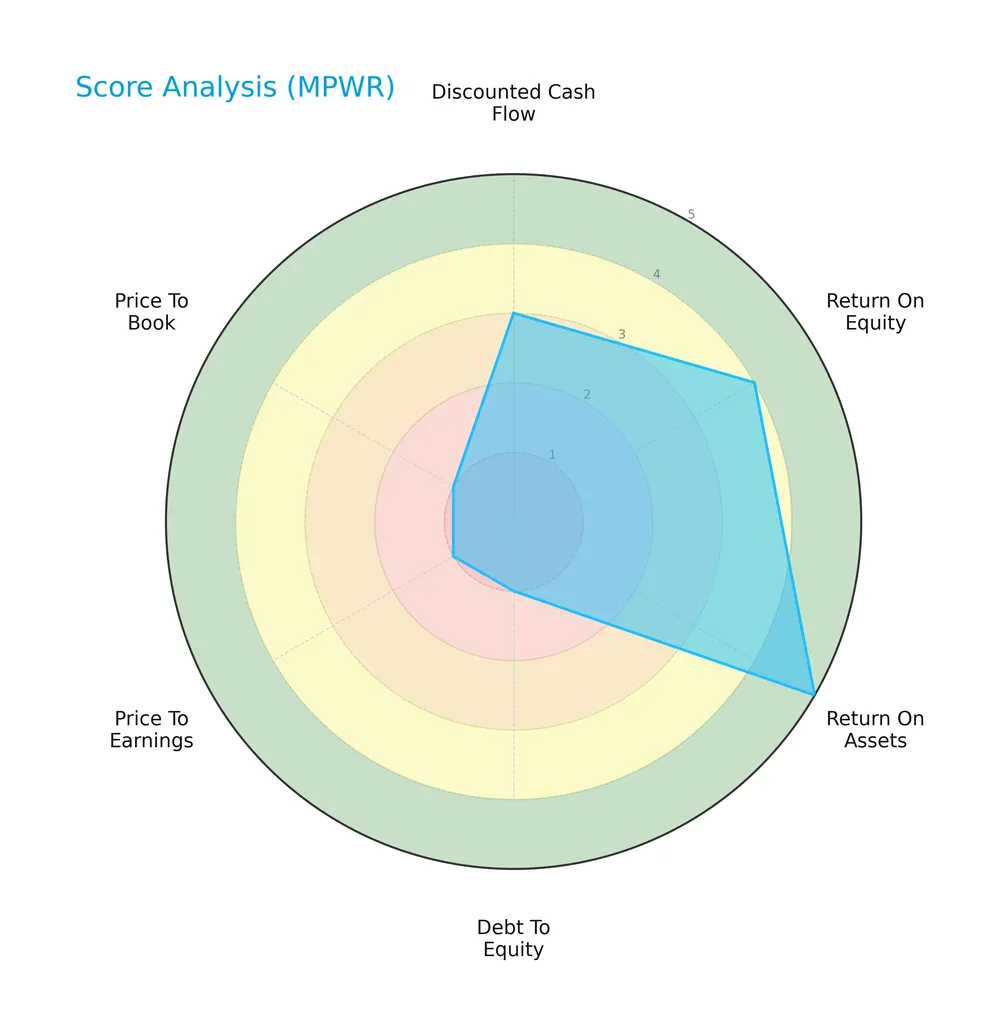
The company shows a very favorable return on assets score of 5 and a favorable return on equity score of 4. However, debt-to-equity, price-to-earnings, and price-to-book scores remain very unfavorable at 1 each. The discounted cash flow score stands moderate at 3.
Analysis of the company’s bankruptcy risk
Monolithic Power Systems, Inc. reports an Altman Z-Score well above the safe zone threshold, indicating a very low bankruptcy risk:

Is the company in good financial health?
The Piotroski Score diagram provides insight into the company’s financial condition and operating efficiency:

With a Piotroski Score of 5, the company falls into an average financial health category, suggesting moderate strength but room for improvement in profitability and efficiency metrics.
Competitive Landscape & Sector Positioning
This sector analysis examines Monolithic Power Systems, Inc.’s strategic positioning, revenue segments, key products, and main competitors. I will assess whether MPWR holds a competitive advantage over its peers in the semiconductor industry.
Strategic Positioning
Monolithic Power Systems concentrates on semiconductor power electronics, primarily DC to DC products generating $1.72B in 2023, with lighting control products at $102M. Its geographic exposure is diversified across China, Taiwan, Korea, and the US, reflecting a strong presence in Asia and growing international reach.
Revenue by Segment
This pie chart illustrates Monolithic Power Systems, Inc.’s revenue distribution by product segment for fiscal year 2023. It highlights the relative contributions of DC To DC Products and Lighting Control Products.
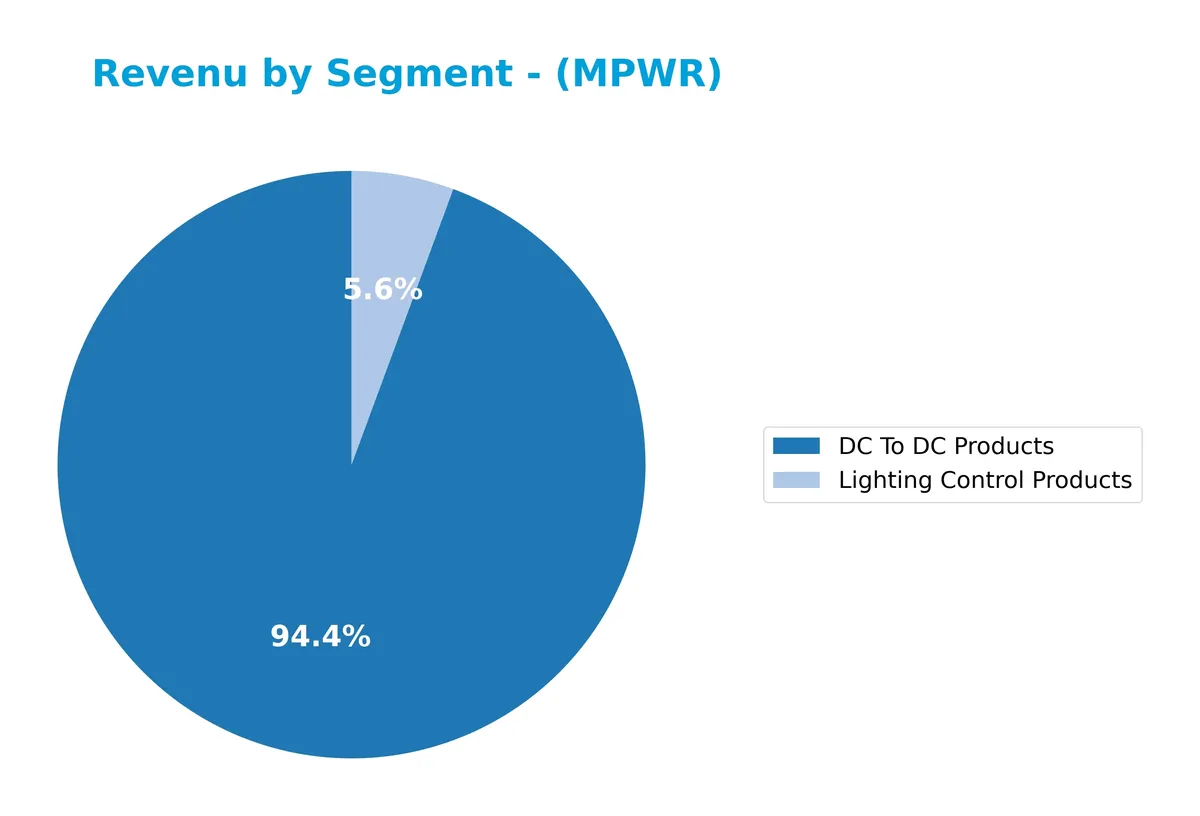
DC To DC Products dominate Monolithic’s revenue with $1.72B in 2023, showing steady growth from $1.70B in 2022 and $1.15B in 2021. Lighting Control Products contribute a smaller $102M, up modestly from $98M in 2022. The business increasingly concentrates on DC To DC solutions, signaling a strong strategic focus and consistent demand acceleration in this core segment.
Key Products & Brands
Monolithic Power Systems, Inc. generates revenue from the following key products and brands:
| Product | Description |
|---|---|
| DC To DC Products | Integrated circuits converting and controlling voltages for electronic systems including portable devices. |
| Lighting Control Products | ICs for backlighting LCD panels in notebooks, monitors, automotive navigation, TVs, and general illumination. |
Monolithic Power Systems primarily earns from DC to DC products, which have consistently driven strong revenue growth. Lighting control products form a smaller, yet stable, part of the portfolio.
Main Competitors
There are 38 competitors in the sector, with the table below showing the top 10 leaders by market capitalization:
| Competitor | Market Cap. |
|---|---|
| NVIDIA Corporation | 4.6T |
| Broadcom Inc. | 1.6T |
| Taiwan Semiconductor Manufacturing Company Limited | 1.6T |
| ASML Holding N.V. | 415B |
| Advanced Micro Devices, Inc. | 363B |
| Micron Technology, Inc. | 353B |
| Lam Research Corporation | 232B |
| Applied Materials, Inc. | 214B |
| QUALCOMM Incorporated | 185B |
| Intel Corporation | 173B |
Monolithic Power Systems, Inc. ranks 17th among 38 competitors. Its market cap is just 1.19% of the leader, NVIDIA. The company stands below the average market cap of the top 10 but above the sector median. It is 1.73% behind its closest competitor above, highlighting a narrow gap to climb.
Comparisons with competitors
Check out how we compare the company to its competitors:
Does MPWR have a competitive advantage?
Monolithic Power Systems presents a slight competitive advantage, with ROIC exceeding WACC by 4.5%, indicating value creation despite a declining ROIC trend. Its semiconductor power solutions maintain favorable margins and strong revenue growth.
Looking ahead, MPWR’s expansion in China and Korea, alongside ongoing innovation in power electronics for automotive and industrial markets, offer significant growth opportunities. The company’s geographic diversification supports resilience and future market penetration.
SWOT Analysis
This SWOT analysis highlights Monolithic Power Systems, Inc.’s key strategic factors shaping its competitive position.
Strengths
- Strong gross margin at 55%
- ROIC well above WACC indicating value creation
- Zero debt enhances financial flexibility
Weaknesses
- High P/E of 70.7 signals expensive valuation
- Declining ROIC trend warns of profitability pressure
- Low dividend yield at 0.65% may deter income investors
Opportunities
- Rapid revenue growth over 130% in five years
- Expanding automotive and industrial semiconductor markets
- Geographic diversification with growing China sales
Threats
- Semiconductor cyclical volatility risks
- Rising competition in power ICs market
- Geopolitical tensions impacting supply chains
Monolithic Power Systems demonstrates robust profitability and growth with a solid moat. However, valuation risks and declining ROIC caution a selective, risk-managed approach. The company must leverage growth opportunities while addressing profitability trends to sustain its leadership.
Stock Price Action Analysis
The weekly stock chart for Monolithic Power Systems, Inc. (MPWR) highlights significant price movements and volume trends over the past 12 months:
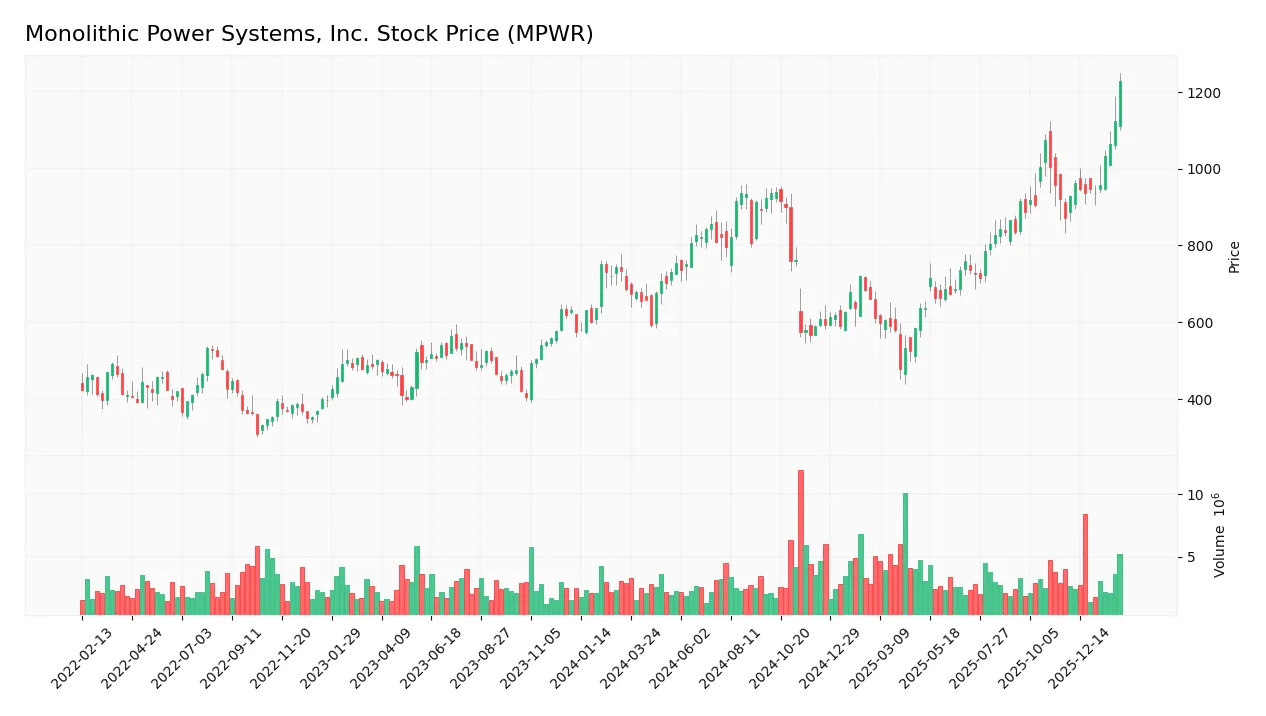
Trend Analysis
Over the past 12 months, MPWR’s stock price increased by 74.65%, indicating a strong bullish trend with accelerating momentum. The price ranged from a low of 477.39 to a high of 1229.82, reflecting heightened volatility with a standard deviation of 164.07.
Volume Analysis
Over the last three months, trading volume in MPWR shows a slight seller dominance at 49.66% buyer volume, suggesting neutral buyer behavior. The overall volume trend is increasing, indicating growing market participation despite balanced buying and selling pressures.
Target Prices
Analysts show a confident target consensus for Monolithic Power Systems, Inc. (MPWR).
| Target Low | Target High | Consensus |
|---|---|---|
| 1,200 | 1,500 | 1,314 |
The target prices indicate a robust upside potential, reflecting strong market confidence in MPWR’s growth trajectory.

Don’t Let Luck Decide Your Entry Point
Optimize your entry points with our advanced ProRealTime indicators. You’ll get efficient buy signals with precise price targets for maximum performance. Start outperforming now!
Analyst & Consumer Opinions
This section examines Monolithic Power Systems, Inc.’s analyst ratings and consumer feedback to provide balanced insights.
Stock Grades
Below is a summary of recent verified grades from reputable financial analysts for Monolithic Power Systems, Inc.:
| Grading Company | Action | New Grade | Date |
|---|---|---|---|
| Citigroup | Maintain | Buy | 2026-02-09 |
| Truist Securities | Maintain | Buy | 2026-02-06 |
| Needham | Maintain | Buy | 2026-02-06 |
| Keybanc | Maintain | Overweight | 2026-02-06 |
| Rosenblatt | Maintain | Neutral | 2026-02-06 |
| Wells Fargo | Maintain | Overweight | 2026-02-06 |
| Stifel | Maintain | Buy | 2026-02-04 |
| Wells Fargo | Maintain | Overweight | 2026-01-26 |
| Wells Fargo | Upgrade | Overweight | 2026-01-15 |
| Truist Securities | Maintain | Buy | 2025-12-19 |
The overall trend in grades remains positive with several Buy and Overweight ratings maintained across multiple firms. Notably, Wells Fargo upgraded its rating earlier this year, indicating growing confidence in the stock’s outlook.
Consumer Opinions
Monolithic Power Systems (MPWR) enjoys a solid reputation for innovation but faces some customer concerns around pricing.
| Positive Reviews | Negative Reviews |
|---|---|
| “Exceptional power efficiency in their chips.” | “Premium pricing limits accessibility.” |
| “Reliable performance under heavy workloads.” | “Customer support response times could improve.” |
| “Innovative designs that optimize energy use.” | “Occasional delays in product availability.” |
Overall, consumers praise MPWR’s technological edge and product reliability. However, pricing and support speed remain recurring weaknesses that could impact broader adoption.
Risk Analysis
Below is a detailed risk assessment table highlighting key categories, their descriptions, probabilities, and impacts:
| Category | Description | Probability | Impact |
|---|---|---|---|
| Valuation Risk | Elevated P/E of 70.7 and P/B of 11.7 suggest overvaluation. | High | High |
| Market Volatility | Beta of 1.455 signals higher sensitivity to market swings. | High | Medium |
| Competitive Pressure | Intense semiconductor industry competition affects margins. | Medium | Medium |
| Liquidity Risk | Current ratio of 5.91 flagged as unfavorable, suggesting inefficiency. | Low | Low |
| Debt Risk | Zero debt indicates low financial risk but limits leverage benefits. | Low | Low |
| Dividend Yield | Low yield of 0.65% may deter income-focused investors. | Medium | Low |
The most likely and impactful risk is valuation. MPWR’s rich multiples heighten correction vulnerability amid market turbulence. Its beta above 1.4 amplifies exposure to tech sector swings. Despite strong profitability and zero debt, overvaluation remains a clear red flag today.
Should You Buy Monolithic Power Systems, Inc.?
Monolithic Power Systems appears to be delivering robust value creation with a slightly favorable moat despite declining ROIC trends. While its leverage profile raises caution, the overall B- rating suggests a very favorable standing supported by strong operational efficiency.
Strength & Efficiency Pillars
Monolithic Power Systems, Inc. exhibits strong profitability with a net margin of 22.07% and a return on equity of 16.55%. Its return on invested capital (ROIC) stands at 14.93%, notably above its weighted average cost of capital (WACC) at 10.38%, confirming the company as a clear value creator. The firm maintains favorable gross (55.18%) and EBIT margins (26.11%), reflecting operational efficiency. Despite a slight decline in ROIC trend, Monolithic Power sustains solid capital allocation and value generation over time.
Weaknesses and Drawbacks
The company’s valuation metrics raise caution. Its price-to-earnings ratio of 70.69 and price-to-book ratio of 11.7 imply a significant premium, which may limit upside potential. While the current ratio is robust at 5.91, this unusually high liquidity level could indicate inefficient asset use or excess cash holdings. Dividend yield is low at 0.65%, reducing income appeal. Recent buyer dominance is neutral at 49.66%, suggesting balanced market pressure but no clear bullish momentum in the short term.
Our Final Verdict about Monolithic Power Systems, Inc.
Monolithic Power Systems maintains a fundamentally sound profile with strong profitability and value creation. The bullish overall trend and accelerating stock price (+74.65% over the period) support long-term optimism. However, recent neutral buyer behavior coupled with stretched valuation metrics suggests caution. This profile might appear attractive for long-term exposure but may warrant a wait-and-see approach for a more favorable entry point.
Disclaimer: This content is for informational purposes only and does not constitute financial, investment, or other professional advice. Investing in financial markets involves a significant risk of loss, and past performance is not indicative of future results.
Additional Resources
- [8-K] MONOLITHIC POWER SYSTEMS INC Reports Material Event | MPWR SEC Filing – Form 8-K – Stock Titan (Feb 27, 2026)
- Monolithic Power Systems (MPWR) Announces Restatement of Financi – GuruFocus (Feb 28, 2026)
- Generali Investments Management Co LLC Has $2 Million Stake in Monolithic Power Systems, Inc. $MPWR – MarketBeat (Feb 27, 2026)
- Monolithic Power Systems and Photronics Stocks Trade Down, What You Need To Know – Finviz (Feb 26, 2026)
- Texas Instruments, Monolithic Power Systems named top picks at Citi (TXN:NASDAQ) – Seeking Alpha (Feb 23, 2026)
For more information about Monolithic Power Systems, Inc., please visit the official website: monolithicpower.com