Home > Analyses > Technology > Microchip Technology Incorporated
Microchip Technology Incorporated powers countless everyday devices with its advanced embedded control solutions, quietly shaping the semiconductor landscape. As a recognized leader in microcontrollers, analog, and mixed-signal products, Microchip’s innovation drives industries from automotive to communications, delivering reliable, secure technology worldwide. With a strong reputation for quality and market influence, the key question remains: do Microchip’s robust fundamentals continue to support its growth and valuation in an evolving tech environment?
Table of contents
Business Model & Company Overview
Microchip Technology Incorporated, founded in 1989 and headquartered in Chandler, Arizona, stands as a dominant player in the semiconductor industry. It delivers a cohesive ecosystem of smart, connected, and secure embedded control solutions spanning 8-bit to 32-bit microcontrollers, microprocessors, analog components, and memory products. This diverse portfolio supports applications across automotive, industrial, computing, communications, and security sectors, illustrating its core mission to power intelligent devices globally.
The company’s revenue engine balances product sales of hardware components with recurring income from proprietary software and licensing of its embedded flash technologies. Its strategic footprint spans the Americas, Europe, and Asia, enabling broad market penetration and resilience. Microchip’s economic moat lies in its extensive intellectual property and integrated solutions, positioning it as a key architect in shaping the future of embedded control systems worldwide.
Financial Performance & Fundamental Metrics
In this section, I analyze Microchip Technology Incorporated’s income statement, key financial ratios, and dividend payout policy to assess its fundamental strength.
Income Statement
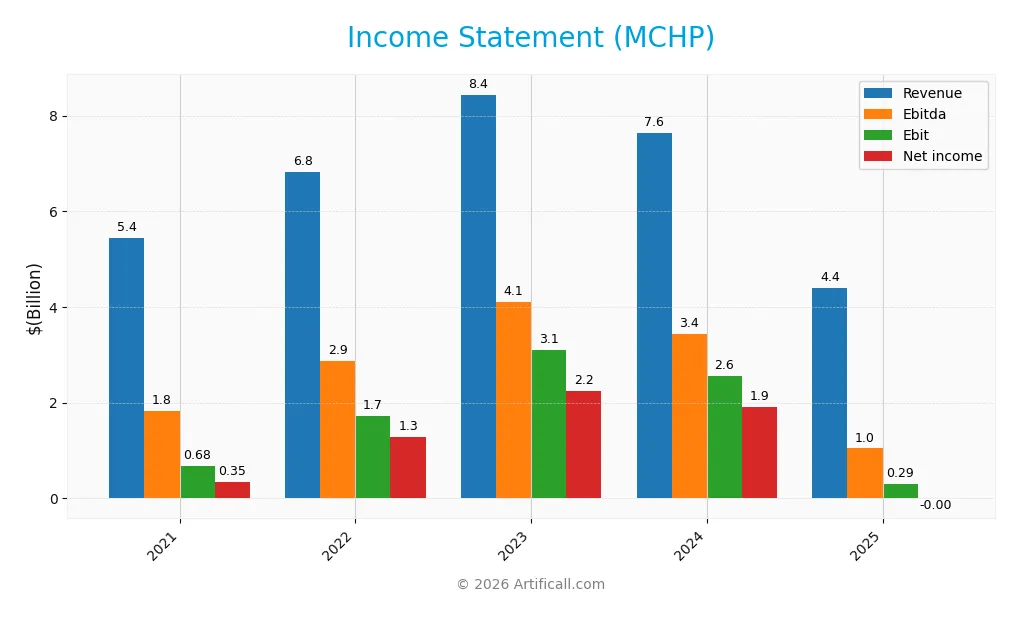
The table below presents Microchip Technology Incorporated’s key income statement figures for fiscal years 2021 through 2025, as reported in USD.
| 2021 | 2022 | 2023 | 2024 | 2025 | |
|---|---|---|---|---|---|
| Revenue | 5.44B | 6.82B | 8.44B | 7.63B | 4.40B |
| Cost of Revenue | 2.06B | 2.37B | 2.74B | 2.64B | 1.93B |
| Operating Expenses | 2.38B | 2.60B | 2.58B | 2.42B | 2.17B |
| Gross Profit | 3.38B | 4.45B | 5.70B | 5.00B | 2.47B |
| EBITDA | 1.83B | 2.87B | 4.10B | 3.44B | 1.04B |
| EBIT | 679M | 1.73B | 3.10B | 2.56B | 290M |
| Interest Expense | 357M | 257M | 204M | 198M | 251M |
| Net Income | 349M | 1.29B | 2.24B | 1.91B | -500K |
| EPS | 0.67 | 2.33 | 4.07 | 3.52 | -0.005 |
| Filing Date | 2021-05-18 | 2022-05-20 | 2023-05-25 | 2024-05-23 | 2025-05-23 |
Income Statement Evolution
Microchip Technology’s revenue declined by 19.06% over 2021-2025, with a sharp 42.35% drop in the latest year. Gross profit followed suit, falling 50.6% year-on-year, reflecting margin pressure. While the gross margin remained relatively favorable at 56.07%, EBIT margin was neutral at 6.6%, indicating higher operating costs relative to revenue. Net income and margins deteriorated significantly, ending in a slight net loss.
Is the Income Statement Favorable?
The 2025 income statement reveals a challenging year: revenue shrank to $4.4B from $7.6B, eroding profitability. Operating income was $296M, but net income slipped to a loss of $0.5M, driven by high interest expenses and other costs. Despite a stable gross margin, the net margin turned negative at -0.01%. Overall fundamentals are unfavorable due to steep declines in revenue, earnings, and margins, signaling operational and financial headwinds.
Financial Ratios
The table below presents key financial ratios for Microchip Technology Incorporated (MCHP) over the fiscal years 2021 to 2025, providing insight into profitability, valuation, liquidity, leverage, efficiency, and dividend metrics:
| Ratios | 2021 | 2022 | 2023 | 2024 | 2025 |
|---|---|---|---|---|---|
| Net Margin | 6.42% | 18.85% | 26.52% | 24.98% | -0.01% |
| ROE | 6.55% | 21.81% | 34.35% | 28.64% | -0.01% |
| ROIC | 6.47% | 10.81% | 16.32% | 14.40% | -0.03% |
| P/E | 115.33 | 32.28 | 20.61 | 25.51 | -52,021.39 |
| P/B | 7.55 | 7.04 | 7.08 | 7.31 | 3.67 |
| Current Ratio | 0.89 | 1.75 | 0.98 | 1.20 | 2.59 |
| Quick Ratio | 0.61 | 1.14 | 0.56 | 0.67 | 1.47 |
| D/E | 1.70 | 1.33 | 1.01 | 0.91 | 0.80 |
| Debt-to-Assets | 55.04% | 48.46% | 40.32% | 38.00% | 36.85% |
| Interest Coverage | 2.80 | 7.20 | 15.28 | 12.97 | 1.18 |
| Asset Turnover | 0.33 | 0.42 | 0.52 | 0.48 | 0.29 |
| Fixed Asset Turnover | 6.36 | 7.05 | 7.16 | 6.39 | 3.72 |
| Dividend Yield | 0.96% | 1.21% | 1.51% | 1.87% | 3.75% |
Evolution of Financial Ratios
Microchip Technology Incorporated’s Return on Equity (ROE) declined sharply, turning negative by fiscal 2025, signaling weakened profitability. The Current Ratio improved significantly, reaching 2.59 in 2025, indicating stronger liquidity. Meanwhile, the Debt-to-Equity Ratio decreased from above 1.6 in earlier years to 0.8, showing a more moderate leverage position. Profitability margins notably worsened in 2025, with net profit margin turning slightly negative.
Are the Financial Ratios Favorable?
In 2025, Microchip’s profitability ratios, including ROE, net margin, and return on invested capital, are unfavorable, reflecting operational challenges. Liquidity ratios such as the Current and Quick Ratios are favorable, suggesting sound short-term financial health. Leverage ratios remain neutral, with a moderate debt-to-equity level and debt-to-assets ratio around 37%. Efficiency indicators like asset turnover are unfavorable, while fixed asset turnover is favorable. Overall, the financial ratios present a slightly unfavorable profile.
Shareholder Return Policy
Microchip Technology Incorporated (MCHP) pays dividends, with a dividend per share increasing from $0.75 in 2021 to $1.82 in 2025, while the dividend yield rose to 3.75% in 2025. However, the company reported a negative net income in 2025, leading to an unsustainable dividend payout ratio of -1951%, despite consistent share buyback activity.
The discrepancy between free cash flow coverage and profitability poses risks for long-term distribution sustainability. While dividend payments and buybacks support shareholder returns, the recent negative earnings raise concerns about the policy’s alignment with durable value creation.
Score analysis
The following radar chart illustrates key financial scores that highlight different valuation and performance metrics for the company:
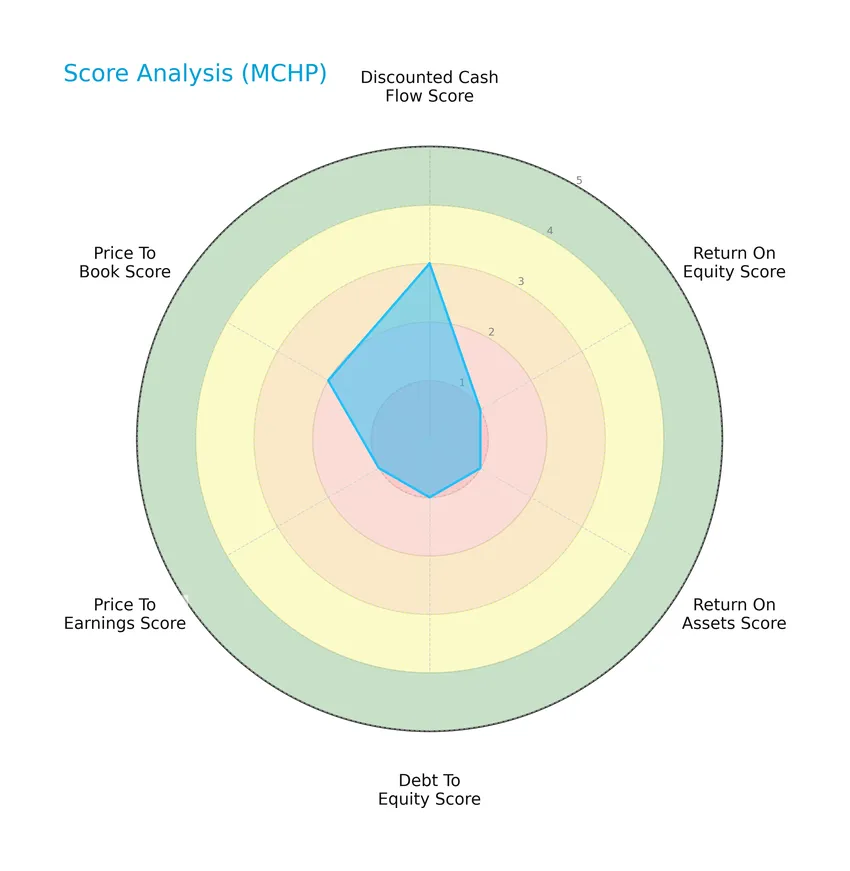
Microchip Technology Incorporated shows a moderate discounted cash flow score of 3 and a moderate price-to-book score of 2. However, return on equity, return on assets, debt to equity, and price to earnings scores are all very unfavorable at 1, indicating challenges in profitability, leverage, and valuation metrics.
Analysis of the company’s bankruptcy risk
The Altman Z-Score places Microchip Technology Incorporated comfortably in the safe zone, indicating a low risk of bankruptcy and solid financial stability:

Is the company in good financial health?
The Piotroski Score diagram provides insight into the company’s financial health as assessed by key operational and financial criteria:

With a Piotroski Score of 3, Microchip Technology Incorporated is categorized as very weak in financial health, reflecting concerns in profitability, leverage, liquidity, or operational efficiency metrics.
Competitive Landscape & Sector Positioning
This section examines Microchip Technology Incorporated’s strategic positioning, revenue segments, key products, and main competitors within the semiconductor industry. I will analyze the company’s strengths and weaknesses to assess whether it holds a competitive advantage over its peers.
Strategic Positioning
Microchip Technology Incorporated maintains a concentrated product portfolio focused primarily on semiconductor products, generating $4.27B in FY2025, alongside a smaller technology licensing segment of $131M. Its operations span the Americas, Europe, and Asia, emphasizing embedded control solutions across diverse applications within a single industry sector.
Revenue by Segment
This pie chart illustrates Microchip Technology Incorporated’s revenue distribution by segment for the fiscal year 2025, highlighting the contributions of semiconductor products and technology licensing.
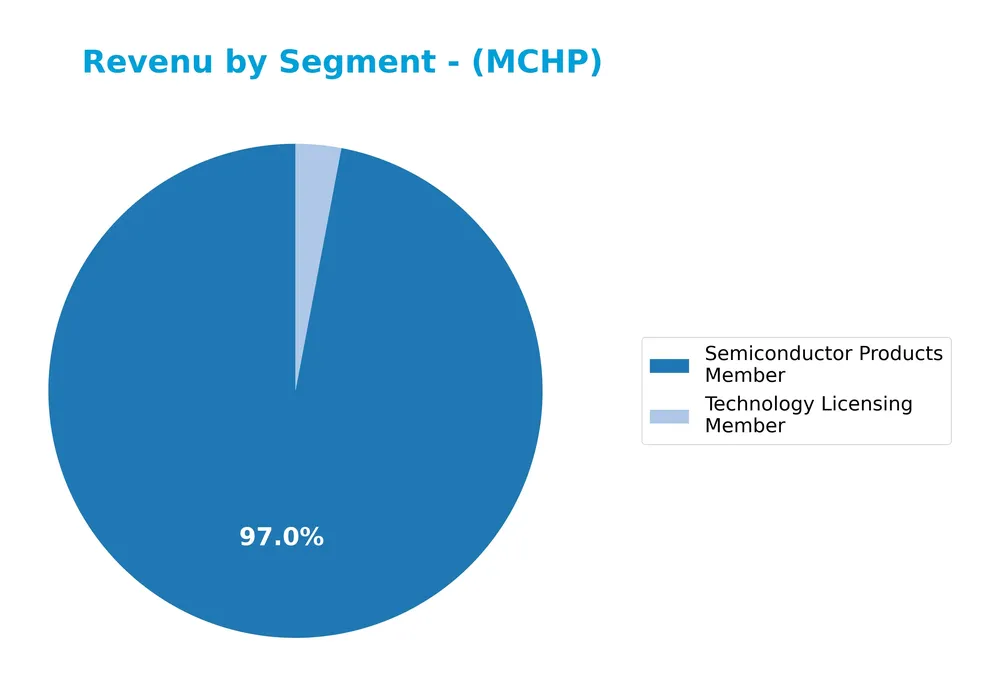
In 2025, semiconductor products remained the dominant revenue driver at 4.27B USD, while technology licensing contributed a smaller 131M USD. Compared to prior years, there is a noticeable slowdown in semiconductor revenue from its peak of 8.28B USD in 2023, suggesting some market headwinds or strategic shifts. The concentration in semiconductor products continues to pose concentration risk, despite steady licensing revenue.
Key Products & Brands
The following table summarizes Microchip Technology Incorporated’s main products and brands in its portfolio:
| Product | Description |
|---|---|
| General Purpose Microcontrollers | 8-bit, 16-bit, and 32-bit microcontrollers for broad embedded control applications. |
| Embedded Microprocessors | 32-bit processors serving markets like automotive, industrial, computing, and communications. |
| Specialized Microcontrollers | Targeted for automotive, industrial, lighting, power supplies, motor control, human machine interface, security, and connectivity uses. |
| Development Tools | Programming tools enabling system designers to configure microcontroller and microprocessor products. |
| Field-Programmable Gate Arrays (FPGA) | Programmable logic devices for custom hardware applications. |
| Analog, Interface & Mixed Signal Products | Includes power management, linear, high-voltage, thermal management, RF, drivers, safety, timing, USB, Ethernet, wireless, and other interfaces. |
| Memory Products | Serial and parallel flash memories, static RAM, electrically erasable programmable memories for small footprint devices. |
| Technology Licensing | Licensing of SuperFlash embedded flash and non-volatile memory technologies to foundries and design partners. |
| Manufacturing Services | Wafer foundry, assembly, test subcontracting, and aerospace-specific products. |
| Application Specific Integrated Circuits (ASICs) | Custom integrated circuits for specific client applications. |
| Timing Systems Products | Precision timing components for various electronic applications. |
Microchip’s product range spans embedded controllers, memory solutions, analog and mixed-signal devices, and specialized manufacturing services, supporting diverse industries worldwide.
Main Competitors
There are 38 competitors in the Semiconductors industry, with the table below showing the top 10 leaders by market capitalization:
| Competitor | Market Cap. |
|---|---|
| NVIDIA Corporation | 4.6T |
| Broadcom Inc. | 1.6T |
| Taiwan Semiconductor Manufacturing Company Limited | 1.6T |
| ASML Holding N.V. | 415B |
| Advanced Micro Devices, Inc. | 363B |
| Micron Technology, Inc. | 353B |
| Lam Research Corporation | 232B |
| Applied Materials, Inc. | 214B |
| QUALCOMM Incorporated | 185B |
| Intel Corporation | 173B |
Microchip Technology Incorporated ranks 18th among 38 competitors in the Semiconductors sector. Its market capitalization is just 0.88% of the leader’s (NVIDIA), placing it well below the average market cap of the top 10 competitors (974.8B) but above the sector median of 30.7B. Microchip also maintains a 11.09% market cap lead over its closest competitor below.
Comparisons with competitors
Check out how we compare the company to its competitors:
Does MCHP have a competitive advantage?
Microchip Technology Incorporated currently does not present a competitive advantage, as it is experiencing value destruction with a declining ROIC significantly below its WACC, reflecting decreasing profitability and efficiency in capital use. Its financial performance shows unfavorable trends in revenue, net margin, and EPS growth, indicating challenges in sustaining economic profits.
Looking ahead, Microchip’s broad portfolio in embedded control solutions and microcontroller technologies across diverse sectors could offer opportunities if market conditions improve or new applications emerge. However, the company’s recent financial and profitability trends suggest that realizing such potential may require overcoming significant operational and market headwinds.
SWOT Analysis
This SWOT analysis highlights the key internal and external factors impacting Microchip Technology Incorporated’s current position and future prospects.
Strengths
- strong market presence in embedded control solutions
- diversified product portfolio including microcontrollers and analog products
- favorable liquidity ratios
Weaknesses
- declining revenue and profitability trends
- weak net margin and ROIC performance
- very weak Piotroski score indicating financial distress
Opportunities
- growth potential in automotive and industrial IoT markets
- expanding demand for secure connected devices
- licensing SuperFlash technology to partners
Threats
- intense competition in semiconductor industry
- global supply chain disruptions
- macroeconomic uncertainties affecting demand
Microchip’s strengths lie in its broad product range and liquidity, but ongoing profitability declines and financial weakness are concerning. Strategic focus on innovation and market expansion, coupled with cautious risk management, is essential to improve value creation and long-term sustainability.
Stock Price Action Analysis
The weekly stock chart for Microchip Technology Incorporated (MCHP) illustrates price movements and key levels over the past year:
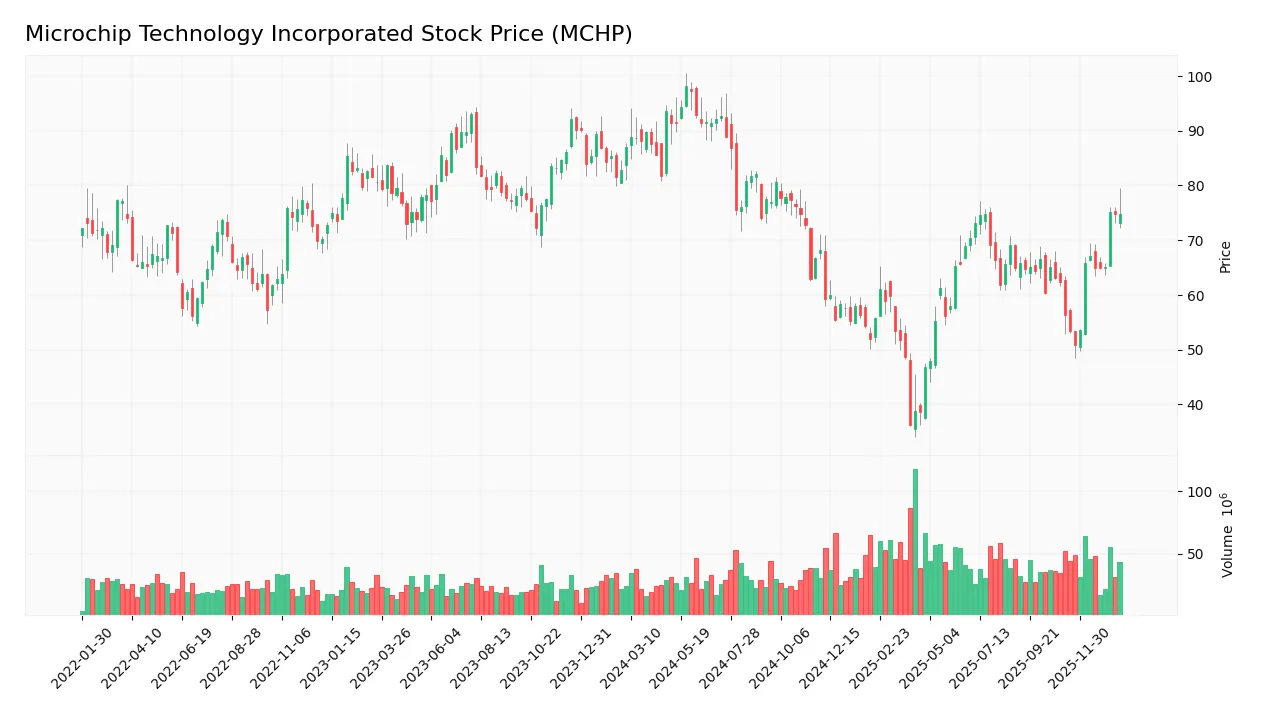
Trend Analysis
Over the past 12 months, MCHP’s stock price declined by 14.13%, indicating a bearish trend. The price showed acceleration in its downward movement, with a high volatility level reflected by a 14.33 standard deviation. Prices ranged between a high of 98.23 and a low of 36.22 during this period.
Volume Analysis
In the last three months, trading volume for MCHP has been increasing, with a total buyer volume of 278M versus seller volume of 225M, showing a slightly buyer-dominant market at 55.29%. This suggests growing investor engagement and cautious optimism despite the overall bearish context.
Target Prices
Analysts present a moderately optimistic consensus on Microchip Technology Incorporated’s stock price.
| Target High | Target Low | Consensus |
|---|---|---|
| 90 | 60 | 79.58 |
The target prices indicate expectations of a potential upside with a high near 90 and a consensus around 79.6, reflecting a positive but cautious market outlook.

Don’t Let Luck Decide Your Entry Point
Optimize your entry points with our advanced ProRealTime indicators. You’ll get efficient buy signals with precise price targets for maximum performance. Start outperforming now!
Analyst & Consumer Opinions
This section reviews recent analyst ratings and consumer feedback related to Microchip Technology Incorporated’s market performance and products.
Stock Grades
Here is the latest overview of Microchip Technology Incorporated’s stock ratings from reputable financial institutions:
| Grading Company | Action | New Grade | Date |
|---|---|---|---|
| Susquehanna | Maintain | Positive | 2026-01-22 |
| B of A Securities | Maintain | Neutral | 2026-01-21 |
| Piper Sandler | Maintain | Overweight | 2026-01-15 |
| Citigroup | Maintain | Buy | 2026-01-15 |
| B. Riley Securities | Maintain | Buy | 2026-01-12 |
| Mizuho | Maintain | Outperform | 2026-01-09 |
| Wells Fargo | Maintain | Equal Weight | 2026-01-07 |
| Morgan Stanley | Maintain | Equal Weight | 2026-01-06 |
| JP Morgan | Maintain | Overweight | 2026-01-06 |
| Rosenblatt | Maintain | Buy | 2026-01-06 |
The consensus among these firms leans toward a positive outlook with no downgrades and a majority maintaining buy or equivalent ratings. There is a balanced distribution across positive, overweight, and neutral grades, reflecting cautious optimism in the stock’s performance.
Consumer Opinions
Consumer sentiment toward Microchip Technology Incorporated (MCHP) reflects a mix of appreciation for product reliability and concerns about customer support responsiveness.
| Positive Reviews | Negative Reviews |
|---|---|
| “Microchip’s microcontrollers are highly reliable and easy to integrate into projects.” | “Customer service response times can be slow during peak periods.” |
| “The extensive documentation and development tools make prototyping much faster.” | “Some pricing options feel a bit steep for smaller businesses or hobbyists.” |
| “Consistent product quality and frequent firmware updates add great value.” | “Availability issues with certain components occasionally disrupt supply chains.” |
Overall, consumers praise Microchip’s product quality and comprehensive support materials but frequently note challenges with customer service speed and pricing, which could impact smaller-scale users.
Risk Analysis
The following table highlights key risks associated with Microchip Technology Incorporated, focusing on their likelihood and potential impact:
| Category | Description | Probability | Impact |
|---|---|---|---|
| Profitability Risk | Negative net margin and return ratios indicate ongoing difficulties in generating profits. | High | High |
| Financial Health | Very weak Piotroski score (3) signals poor financial strength and operational challenges. | High | Medium |
| Market Volatility | Beta of 1.445 shows above-average stock price volatility, increasing investment risk. | Medium | Medium |
| Debt Servicing | Low interest coverage ratio (1.15) raises concerns about ability to meet debt obligations. | Medium | High |
| Valuation | Unfavorable price-to-book ratio (3.67) suggests potential overvaluation risk. | Medium | Medium |
Microchip’s most pressing risks are linked to its weak profitability and financial health, despite being in the safe zone for bankruptcy risk (Altman Z-score 4.1). Investors should carefully monitor operating performance and debt servicing capacity before increasing exposure.
Should You Buy Microchip Technology Incorporated?
Microchip Technology appears to be experiencing deteriorating profitability and a very unfavorable competitive moat, suggesting value erosion. Despite a manageable leverage profile indicated by a safe Altman Z-Score, the overall rating of C- reflects considerable financial weaknesses and operational challenges.
Strength & Efficiency Pillars
Microchip Technology Incorporated benefits from a robust Altman Z-Score of 4.10, positioning it firmly in the safe zone and indicating strong financial stability with low bankruptcy risk. The company maintains a solid liquidity profile, supported by a current ratio of 2.59 and a quick ratio of 1.47, which favorably underpin short-term financial health. Additionally, a dividend yield of 3.75% and a favorable fixed asset turnover of 3.72 reflect operational efficiency and shareholder returns. However, profitability metrics such as ROIC at -0.03% lag behind the WACC of 9.72%, confirming that Microchip is currently a value destroyer rather than a creator.
Weaknesses and Drawbacks
Microchip faces significant challenges, notably in profitability with a net margin of -0.01% and a declining ROIC trend, signaling deteriorating returns on invested capital. The company’s valuation appears stretched, reflected by an unfavorable price-to-book ratio of 3.67, which may deter value-focused investors. Furthermore, the interest coverage ratio of 1.15 raises concerns over its ability to comfortably service debt, while the weak Piotroski score of 3 underscores frail financial strength. The overall bearish stock trend, with a 14.13% price decline over the longer term, also suggests persistent market pressure despite recent buyer dominance.
Our Verdict about Microchip Technology Incorporated
The long-term fundamental profile of Microchip Technology Incorporated appears unfavorable due to its declining profitability and value destruction. Despite recent signs of buyer dominance and a short-term bullish trend, these improvements might not fully offset the underlying weaknesses. Therefore, while the stock may appear to gain temporary traction, it suggests a cautious, wait-and-see approach for investors seeking more stable entry points in the semiconductor sector.
Disclaimer: This content is for informational purposes only and does not constitute financial, investment, or other professional advice. Investing in financial markets involves a significant risk of loss, and past performance is not indicative of future results.
Additional Resources
- Rakuten Investment Management Inc. Buys Shares of 29,868 Microchip Technology Incorporated $MCHP – MarketBeat (Jan 24, 2026)
- Microchip Technology Provides Q3 Fiscal 2026 Business Update – Microchip Technology (Jan 05, 2026)
- Why Microchip Tech (MCHP) Might be Well Poised for a Surge – Finviz (Jan 21, 2026)
- Microchip Technology Stock Gained 1% Last Week After Q3 Sales Forecast Raised – TIKR.com (Jan 22, 2026)
- Microchip Technology Inc (MCHP) Shares Up 4.18% on Jan 21 – GuruFocus (Jan 21, 2026)
For more information about Microchip Technology Incorporated, please visit the official website: microchip.com