Home > Analyses > Healthcare > Gilead Sciences, Inc.
Gilead Sciences transforms the fight against complex diseases with groundbreaking therapies that save millions of lives worldwide. Renowned for its leadership in antiviral drugs, Gilead’s flagship HIV and hepatitis treatments set industry standards for efficacy and innovation. Its expanding oncology and cell therapy portfolio further cements its role as a biotech powerhouse. As the healthcare landscape evolves, I ask: does Gilead’s robust pipeline and solid fundamentals still justify its premium market valuation?

Table of contents
Business Model & Company Overview
Gilead Sciences, Inc. stands as a titan in biopharmaceuticals, founded in 1987 and headquartered in Foster City, California. It leads the drug manufacturing sector with a mission to address unmet medical needs through a robust portfolio of treatments for HIV/AIDS, liver diseases, oncology, and infectious diseases. Its ecosystem spans innovative therapies like Biktarvy and Veklury, underscoring a core business that integrates cutting-edge science with patient-centric solutions.
The company’s revenue engine balances proprietary pharmaceuticals with strategic collaborations across the Americas, Europe, and Asia. Gilead leverages recurring demand for antiviral and oncology drugs, supplemented by partnerships with industry leaders such as Bristol-Myers Squibb and Merck. This global footprint and diversified product mix forge a formidable competitive advantage, creating a durable economic moat in the evolving healthcare landscape.
Financial Performance & Fundamental Metrics
I will analyze Gilead Sciences, Inc.’s income statement, key financial ratios, and dividend payout policy to assess its core financial health and shareholder returns.
Income Statement
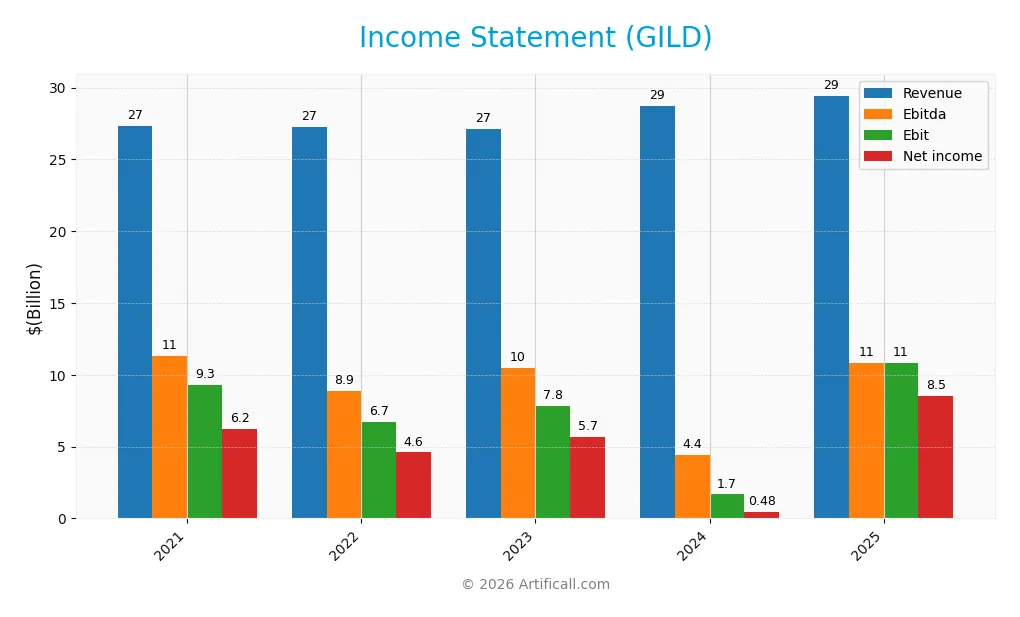
The table below summarizes Gilead Sciences, Inc.’s key income statement metrics for the fiscal years 2021 through 2025, reflecting revenue, expenses, and profitability trends.
| 2021 | 2022 | 2023 | 2024 | 2025 | |
|---|---|---|---|---|---|
| Revenue | 27.3B | 27.3B | 27.1B | 28.8B | 29.4B |
| Cost of Revenue | 6.6B | 5.7B | 6.5B | 6.3B | 3.9B |
| Operating Expenses | 10.8B | 14.3B | 13.0B | 20.8B | 13.7B |
| Gross Profit | 20.7B | 21.6B | 20.6B | 22.5B | 25.5B |
| EBITDA | 11.3B | 8.9B | 10.5B | 4.4B | 10.8B |
| EBIT | 9.3B | 6.7B | 7.8B | 1.7B | 10.8B |
| Interest Expense | 1.0B | 935M | 944M | 977M | 1.0B |
| Net Income | 6.2B | 4.6B | 5.7B | 480M | 8.5B |
| EPS | 4.96 | 3.66 | 4.54 | 0.38 | 6.84 |
| Filing Date | 2022-02-23 | 2023-02-22 | 2024-02-23 | 2025-02-28 | 2026-02-24 |
Income Statement Evolution
Gilead Sciences’ revenue showed modest growth of 2.4% in 2025, slowing compared to previous years. Gross profit increased 13.4%, reflecting margin improvement. Operating expenses grew in line with revenue, supporting a sharp EBIT rise of over 500%. Net income surged 1631%, driving net margin expansion and solid overall profitability trends since 2021.
Is the Income Statement Favorable?
In 2025, fundamentals are broadly favorable. Gross margin sits at a high 86.7%, with EBIT margin at 36.8%, both above sector benchmarks. Interest expense remains manageable at 3.5% of revenue, preserving earnings quality. Net margin nearly 29% confirms strong bottom-line performance. Risks appear limited, with consistent expense control and robust earnings growth reinforcing financial strength.
Financial Ratios
The following table presents key financial ratios for Gilead Sciences, Inc. from 2021 through 2025, providing insight into profitability, valuation, liquidity, leverage, and efficiency metrics:
| Ratios | 2021 | 2022 | 2023 | 2024 | 2025 |
|---|---|---|---|---|---|
| Net Margin | 23% | 17% | 21% | 2% | 29% |
| ROE | 30% | 22% | 25% | 2% | 38% |
| ROIC | 13% | 11% | 12% | 2% | 22% |
| P/E | 15 | 23 | 18 | 240 | 18 |
| P/B | 4.33 | 5.07 | 4.43 | 5.96 | 6.75 |
| Current Ratio | 1.27 | 1.29 | 1.43 | 1.60 | 1.68 |
| Quick Ratio | 1.13 | 1.15 | 1.27 | 1.45 | 1.31 |
| D/E | 1.27 | 1.19 | 1.09 | 1.38 | 0 |
| Debt-to-Assets | 39% | 40% | 40% | 45% | 0% |
| Interest Coverage | 9.9 | 7.8 | 8.1 | 1.7 | 11.5 |
| Asset Turnover | 0.40 | 0.43 | 0.44 | 0.49 | 0.50 |
| Fixed Asset Turnover | 5.33 | 4.98 | 5.10 | 5.31 | 5.25 |
| Dividend Yield | 3.95% | 3.44% | 3.77% | 3.40% | 2.57% |
Evolution of Financial Ratios
Over the analyzed period, Gilead Sciences’ Return on Equity (ROE) displayed significant volatility, plunging in 2024 before surging to 37.6% in 2025. The Current Ratio steadily improved from 1.27 in 2021 to 1.68 in 2025, indicating enhanced liquidity. Debt-to-Equity Ratio sharply declined to zero in 2025 after fluctuating around 1.1 to 1.3, reflecting a strong deleveraging trend. Profitability markedly recovered in 2025 with net margins reaching 28.9%.
Are the Financial Ratios Fovorable?
In 2025, Gilead demonstrates strong profitability with a favorable ROE of 37.6% and a net margin of 28.9%, well above sector averages. Liquidity ratios are robust, with a Current Ratio of 1.68 and Quick Ratio of 1.31. Leverage is minimal, given a zero Debt-to-Equity ratio and zero debt-to-assets. However, the Price-to-Book ratio at 6.75 is unfavorable, and Asset Turnover at 0.5 trails efficiency benchmarks. Overall, 78.6% of ratios are favorable, suggesting very favorable financial health.
Shareholder Return Policy
Gilead Sciences maintains a dividend payout ratio near 46%, with a steady dividend per share around $3.16 and an annual yield close to 2.57%. The policy is supported by robust free cash flow coverage and ongoing share buybacks, indicating balanced capital returns.
This distribution approach aligns with sustainable value creation, given Gilead’s strong operating margins and cash flow generation. However, investors should monitor payout consistency relative to earnings volatility to mitigate risks of unsustainable distributions or excessive repurchases.
Score analysis
The following radar chart illustrates Gilead Sciences, Inc.’s key financial scores across valuation, profitability, and leverage metrics:

Gilead scores very favorably on return on equity and return on assets, indicating strong profitability. Its discounted cash flow is favorable. However, debt-to-equity and price-to-book scores are very unfavorable, signaling leverage and valuation concerns. Price-to-earnings is moderate.
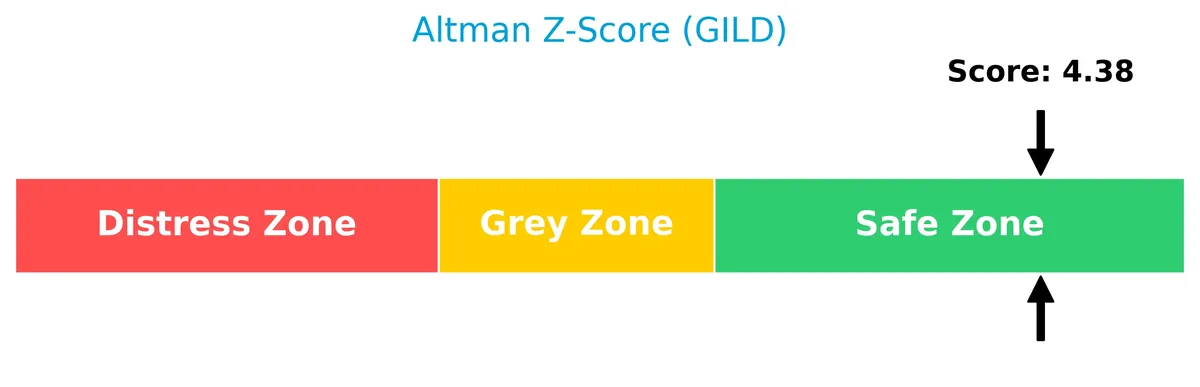
Analysis of the company’s bankruptcy risk
The Altman Z-Score places Gilead Sciences firmly in the safe zone, reflecting a low bankruptcy risk and strong financial stability:
Is the company in good financial health?
This Piotroski diagram highlights the company’s robust financial health and operational efficiency:
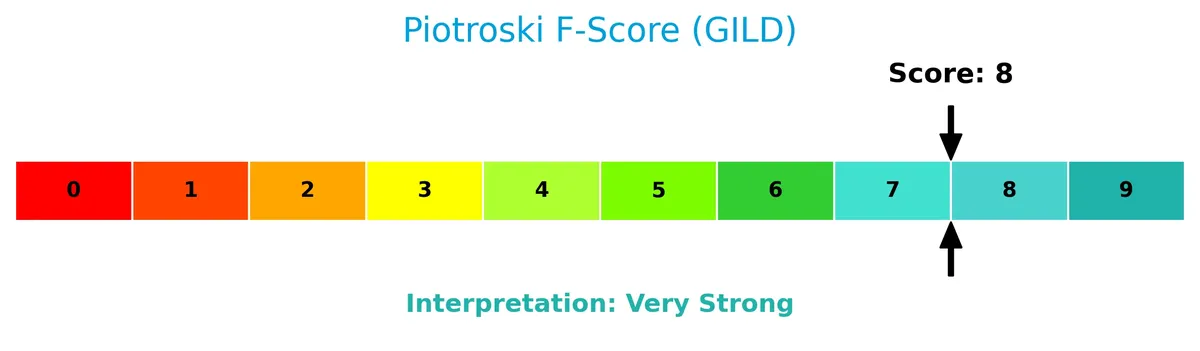
With a very strong Piotroski Score of 8, Gilead demonstrates solid profitability, liquidity, and leverage management, underscoring its favorable fundamental position.
Competitive Landscape & Sector Positioning
This sector analysis explores Gilead Sciences, Inc.’s strategic positioning, revenue segments, and key products. I will assess the company’s main competitors and its competitive advantages. The analysis will also include a SWOT overview. I aim to determine whether Gilead holds a competitive advantage over its peers in the healthcare sector.
Strategic Positioning
Gilead Sciences dominates the HIV/AIDS treatment market while expanding cell therapy and oncology portfolios. Its revenue streams diversify geographically, with the U.S. generating over $20B and Europe contributing $5B in 2025, reflecting concentrated product focus but broad international reach.
Revenue by Segment
This pie chart illustrates Gilead Sciences’ revenue distribution by product segments for the fiscal year 2025, highlighting key contributors to the company’s top line.
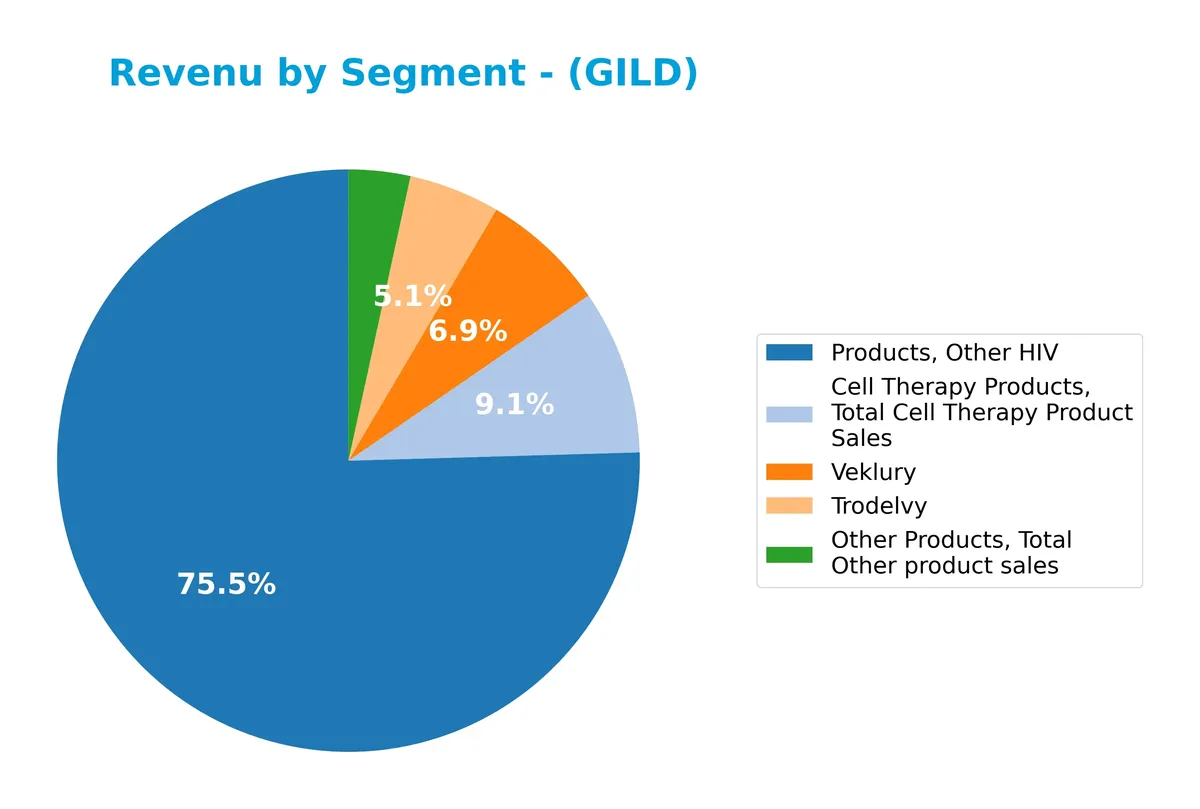
In 2025, Other HIV products dominate Gilead’s revenue at $20.8B, underscoring the segment’s critical role. Cell Therapy products contribute $2.2B, showing steady importance. Trodelvy and Veklury generate $1.4B and $911M, respectively, reflecting solid but smaller revenue streams. Other Products lag at $799M, indicating concentration risk in HIV-related offerings despite diversification efforts. The recent year suggests a plateau in Cell Therapy and a slowdown in Veklury sales.
Key Products & Brands
Below is a snapshot of Gilead Sciences’ key products and brands, highlighting their therapeutic focus and market role:
| Product | Description |
|---|---|
| Biktarvy | Antiretroviral treatment for HIV/AIDS. |
| Genvoya | HIV/AIDS therapy combining multiple antiretroviral agents. |
| Descovy | HIV treatment and pre-exposure prophylaxis. |
| Odefsey | HIV treatment, part of combination antiretroviral therapies. |
| Truvada | HIV prevention and treatment medication. |
| Complera/Eviplera | Combination therapy for HIV infection. |
| Stribild | Antiretroviral treatment for HIV/AIDS. |
| Atripla | Once-daily HIV treatment combining three antiretroviral drugs. |
| Veklury | Intravenous antiviral injection for COVID-19. |
| Epclusa | Hepatitis C virus treatment. |
| Harvoni | Hepatitis C virus therapy. |
| Vosevi | Hepatitis C treatment for patients with prior therapy failure. |
| Vemlidy | Treatment for hepatitis B virus infection. |
| Viread | Antiviral drug for HIV and hepatitis B. |
| Yescarta | CAR-T cell therapy for certain blood cancers. |
| Tecartus | Cell therapy for hematologic malignancies. |
| Trodelvy | Treatment for triple-negative breast cancer and other cancers. |
| Zydelig | Oncology drug for hematologic cancers. |
| Letairis | Oral treatment for pulmonary arterial hypertension. |
| Ranexa | Oral medication for chronic angina. |
| AmBisome | Liposomal antifungal for serious invasive infections. |
Gilead’s portfolio centers on antiviral therapies, especially HIV and hepatitis treatments, complemented by innovative cell therapies and oncology drugs. This diversification reflects the company’s strategic focus on high-need medical areas.
Main Competitors
The Healthcare sector includes 10 main competitors; the table below lists the top 10 leaders by market capitalization:
| Competitor | Market Cap. |
|---|---|
| Eli Lilly and Company | 970B |
| Johnson & Johnson | 500B |
| AbbVie Inc. | 405B |
| AstraZeneca PLC | 285B |
| Merck & Co., Inc. | 268B |
| Amgen Inc. | 176B |
| Gilead Sciences, Inc. | 151B |
| Pfizer Inc. | 143B |
| Bristol-Myers Squibb Company | 109B |
| Biogen Inc. | 26B |
Gilead Sciences ranks 7th among these top competitors. Its market cap is roughly 19% of the sector leader, Eli Lilly. The company sits below both the average market cap of 303B and the sector median of 222B. Gilead holds a narrow 3.7% gap above its closest rival, Amgen, indicating tight competition in this middle tier.
Comparisons with competitors
Check out how we compare the company to its competitors:
Does Gilead Sciences have a competitive advantage?
Gilead Sciences presents a very favorable competitive advantage, demonstrated by a ROIC exceeding WACC by over 16% and a strong upward ROIC trend of 69%. This indicates efficient capital use and sustained value creation amid healthcare sector dynamics.
Looking ahead, Gilead leverages a diversified portfolio including HIV, liver diseases, oncology, and cell therapies, with ongoing collaborations supporting innovation. Expansion in international markets and novel treatments create significant growth opportunities.
SWOT Analysis
This analysis highlights Gilead Sciences’ key internal and external factors shaping its strategic outlook.
Strengths
- strong gross margin at 86.7%
- leading ROIC of 21.7% well above WACC
- robust net margin near 29%
Weaknesses
- below-average asset turnover at 0.5
- high price-to-book ratio at 6.75
- moderate revenue growth of 2.4% last year
Opportunities
- expansion in international markets
- pipeline growth in oncology and cell therapy
- strategic collaborations with top pharma
Threats
- patent cliffs on key HIV drugs
- regulatory risks in global markets
- competition from biosimilars and generics
Gilead’s strengths in profitability and capital efficiency create a solid foundation. However, slower revenue growth and valuation premiums require cautious monitoring. The company must leverage international expansion and R&D partnerships to offset competitive and regulatory pressures.
Stock Price Action Analysis
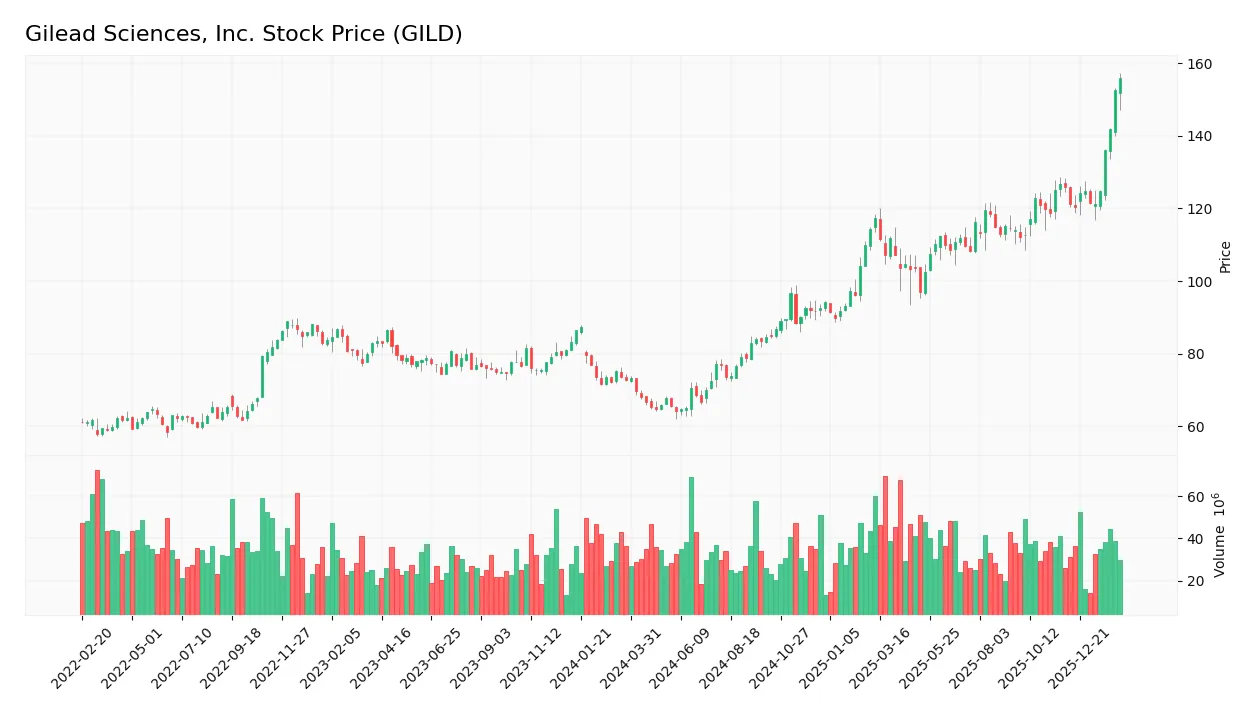
The weekly chart below illustrates Gilead Sciences, Inc.’s stock price movement over the past 12 months, highlighting key fluctuations and trend shifts:
Trend Analysis
Over the past 12 months, GILD’s stock price rose by 112.19%, signaling a strong bullish trend with acceleration. The price ranged between 64.27 and 154.98, showing significant volatility with a 22.22 standard deviation.
Volume Analysis
Trading volume has increased, with buyers dominating 53.58% overall and 68.89% in the recent three months. This buyer-driven activity suggests growing investor confidence and heightened market participation into 2026.
Target Prices
Analysts show a strong bullish consensus for Gilead Sciences, Inc. (GILD).
| Target Low | Target High | Consensus |
|---|---|---|
| 105 | 177 | 157.38 |
The target range indicates optimism, with expectations of significant upside from current levels. This reflects confidence in Gilead’s strategic positioning and pipeline potential.

Don’t Let Luck Decide Your Entry Point
Optimize your entry points with our advanced ProRealTime indicators. You’ll get efficient buy signals with precise price targets for maximum performance. Start outperforming now!
Analyst & Consumer Opinions
This section examines recent analyst grades and consumer feedback to provide a balanced view of Gilead Sciences, Inc.
Stock Grades
Here is the latest consensus and institutional grading snapshot for Gilead Sciences, Inc.:
| Grading Company | Action | New Grade | Date |
|---|---|---|---|
| Needham | Maintain | Buy | 2026-02-11 |
| Truist Securities | Maintain | Buy | 2026-02-11 |
| Cantor Fitzgerald | Maintain | Overweight | 2026-02-11 |
| RBC Capital | Maintain | Sector Perform | 2026-02-11 |
| Scotiabank | Maintain | Sector Outperform | 2026-02-11 |
| Wells Fargo | Maintain | Overweight | 2026-02-11 |
| Citigroup | Maintain | Buy | 2026-01-27 |
| Truist Securities | Maintain | Buy | 2026-01-27 |
| UBS | Maintain | Buy | 2026-01-26 |
| Morgan Stanley | Maintain | Overweight | 2026-01-13 |
The overall grading trend for Gilead Sciences remains stable, with a strong tilt toward Buy and Overweight ratings. Sector-specific firms show moderate enthusiasm with Sector Perform and Outperform grades, reflecting steady analyst confidence.
Consumer Opinions
Gilead Sciences, Inc. generates mixed consumer sentiment, reflecting its complex role in healthcare innovation and pricing.
| Positive Reviews | Negative Reviews |
|---|---|
| Innovative treatments with proven efficacy | High drug prices strain patient affordability |
| Strong commitment to HIV and Hepatitis C | Customer service can be slow and unresponsive |
| Reliable supply chain even during shortages | Limited transparency on clinical trial data |
Overall, consumers praise Gilead for its life-saving drugs and consistent innovation. However, pricing concerns and customer service issues recur as notable weaknesses.
Risk Analysis
Below is a concise overview of key risks facing Gilead Sciences, Inc. as of 2026:
| Category | Description | Probability | Impact |
|---|---|---|---|
| Regulatory Risk | Potential delays or denials in FDA approvals for new drugs | Medium | High |
| Competitive Risk | Intense competition in HIV and oncology drug markets | High | High |
| Patent Expiry | Loss of exclusivity on key drugs could reduce revenue | Medium | Medium |
| Operational Risk | Supply chain disruptions affecting production and distribution | Low | Medium |
| Financial Risk | High price-to-book ratio signals potential overvaluation | Medium | Medium |
| Market Risk | Low beta (0.39) indicates low sensitivity to market volatility | Low | Low |
The most pressing risks are competitive pressures and regulatory hurdles, both carrying high likelihood and potential to disrupt growth. Patent expiries remain a concern but are somewhat mitigated by Gilead’s strong pipeline and collaboration deals. The stock’s elevated price-to-book ratio warns of valuation risk despite solid profitability and balance sheet strength.
Should You Buy Gilead Sciences, Inc.?
Gilead Sciences appears to be delivering robust profitability supported by a durable competitive moat with growing ROIC well above WACC. Despite a challenging leverage profile, its B+ rating and strong financial scores suggest a favorable value creation potential.
Strength & Efficiency Pillars
Gilead Sciences, Inc. demonstrates robust operational efficiency with a net margin of 28.9% and a return on equity (ROE) of 37.62%. The company’s return on invested capital (ROIC) stands at 21.74%, significantly exceeding its weighted average cost of capital (WACC) of 5.44%. This gap confirms Gilead as a clear value creator. Its very strong Piotroski score of 8 further underlines financial strength, while favorable gross and EBIT margins (86.69% and 36.75%) highlight solid profitability and effective cost control.
Weaknesses and Drawbacks
Gilead’s main headwinds lie in valuation and certain efficiency metrics. The price-to-book ratio at 6.75 is notably high, suggesting the stock may be overvalued relative to its book value. Asset turnover is low at 0.5, indicating less efficient use of assets in generating sales. While leverage metrics are favorable with zero debt-to-equity and a strong current ratio of 1.68, the moderate price-to-earnings ratio of 17.94 might reflect tempered market enthusiasm. These factors warrant caution despite operational strengths.
Our Final Verdict about Gilead Sciences, Inc.
Gilead presents a fundamentally strong profile supported by excellent profitability and low financial risk, as reflected by its Altman Z-Score of 4.29, safely in the non-distress zone. The bullish long-term stock trend combined with recent buyer dominance (68.9%) suggests potential upside. This profile might appear attractive for long-term exposure, although investors should monitor valuation levels and efficiency improvements before committing.
Disclaimer: This content is for informational purposes only and does not constitute financial, investment, or other professional advice. Investing in financial markets involves a significant risk of loss, and past performance is not indicative of future results.
Additional Resources
- Decoding Gilead Sciences Inc (GILD): A Strategic SWOT Insight – GuruFocus (Feb 25, 2026)
- Barclays Takes Neutral Stance on Gilead Sciences (GILD) Despite Strategic Refocus – Yahoo Finance (Feb 23, 2026)
- Gilead Sciences (GILD) Price Target Increased by 11.73% to 159.01 – Nasdaq (Feb 24, 2026)
- GILD Stock Quote Price and Forecast – CNN (Feb 22, 2026)
- Gilead Sciences, Inc. $GILD Shares Bought by Nkcfo LLC – MarketBeat (Feb 24, 2026)
For more information about Gilead Sciences, Inc., please visit the official website: gilead.com