Home > Analyses > Real Estate > Extra Space Storage Inc.
Extra Space Storage transforms how millions secure their belongings daily, shaping the self-storage industry with unmatched scale and innovation. As the second-largest U.S. owner and operator of storage facilities, it offers diverse, conveniently located units that meet personal and business needs. Known for operational excellence and steady growth, Extra Space Storage commands respect in the REIT sector. The key question now: do its fundamentals still justify the premium valuation and growth expectations in 2026?

Table of contents
Business Model & Company Overview
Extra Space Storage Inc., founded in 2004 and headquartered in Salt Lake City, Utah, stands as the second largest owner and operator of self-storage facilities in the US. Its portfolio includes 1,906 stores across 40 states, Washington, D.C., and Puerto Rico, offering a cohesive ecosystem of secure storage options, from personal units to boat and RV storage. This broad footprint reflects its core mission to provide accessible, reliable space solutions to diverse customer needs.
The company’s revenue engine blends rental income from approximately 1.4M units with ancillary services, creating steady cash flows typical of the REIT industrial sector. Its well-established presence across the Americas ensures resilient demand and operational scale. Extra Space Storage’s competitive advantage lies in its extensive network and trusted brand, forming a durable economic moat that shapes the future of self-storage.
Financial Performance & Fundamental Metrics
I will analyze Extra Space Storage Inc.’s income statement, key financial ratios, and dividend payout policy to assess its core financial health and shareholder returns.
Income Statement
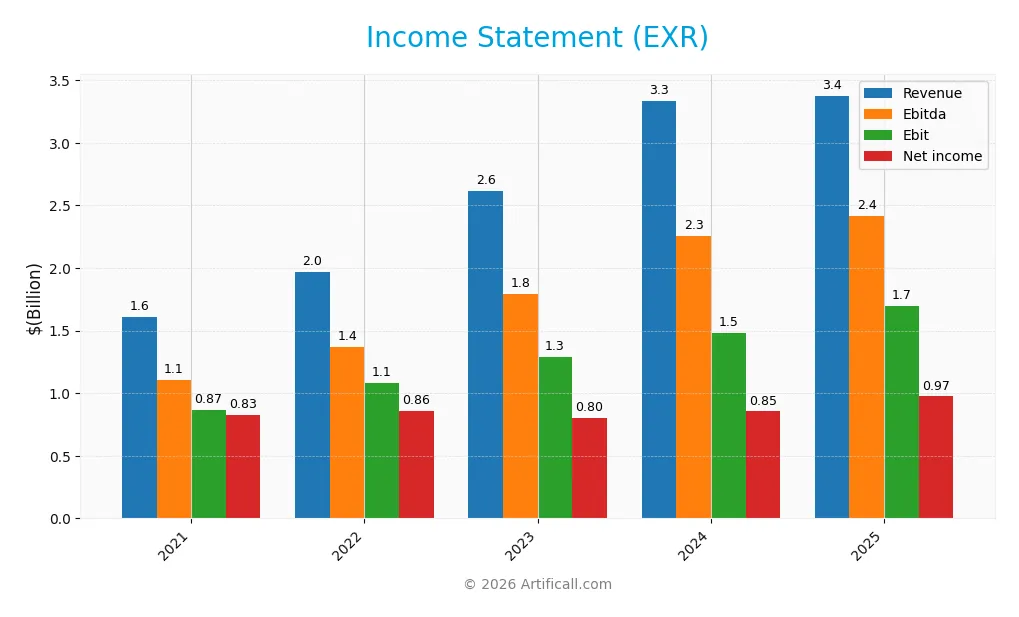
The following table summarizes Extra Space Storage Inc.’s key income statement items for fiscal years 2021 through 2025, reported in USD.
| 2021 | 2022 | 2023 | 2024 | 2025 | |
|---|---|---|---|---|---|
| Revenue | 1.61B | 1.97B | 2.62B | 3.34B | 3.38B |
| Cost of Revenue | 379M | 423M | 594M | 791M | 2.42B |
| Operating Expenses | 254M | 492M | 851M | 1.22B | -529M |
| Gross Profit | 1.23B | 1.54B | 2.02B | 2.55B | 960M |
| EBITDA | 1.11B | 1.37B | 1.79B | 2.26B | 2.41B |
| EBIT | 868M | 1.08B | 1.29B | 1.48B | 1.70B |
| Interest Expense | 166M | 219M | 438M | 595M | 635M |
| Net Income | 828M | 861M | 803M | 854M | 974M |
| EPS | 6.20 | 6.41 | 4.74 | 4.03 | 4.59 |
| Filing Date | 2022-02-28 | 2023-02-28 | 2024-02-29 | 2025-02-28 | 2026-02-20 |
Income Statement Evolution
From 2021 to 2025, Extra Space Storage Inc. grew revenue by 110%, showing robust expansion. Net income rose 18%, but gross profit declined sharply by 62% in the latest year. Margins remain strong with a gross margin at 28.4% and EBIT margin improving to 50.3%. However, net margin fell nearly 44% over the period, signaling margin pressure despite rising top-line figures.
Is the Income Statement Favorable?
In 2025, revenue increased marginally by 1.2%, while EBIT grew 14.7%, reflecting operational efficiency. Net margin improved 12.6% to 28.8%, supported by strong expense control, though interest expense at 18.8% remains a concern. Overall, the income statement shows favorable fundamentals with solid profitability, tempered by elevated financing costs that investors should monitor carefully.
Financial Ratios
The table below presents key financial ratios for Extra Space Storage Inc. (EXR) over the past five fiscal years, illustrating profitability, valuation, liquidity, leverage, and efficiency metrics:
| Ratios | 2021 | 2022 | 2023 | 2024 | 2025 |
|---|---|---|---|---|---|
| Net Margin | 51% | 44% | 31% | 26% | 29% |
| ROE | 27% | 26% | 6% | 6% | 7% |
| ROIC | 9% | 9% | 4% | 4% | 164% |
| P/E | 37 | 23 | 34 | 37 | 28 |
| P/B | 9.7 | 6.1 | 1.9 | 2.3 | 2.1 |
| Current Ratio | 0.83 | 0.67 | 0.85 | 0.93 | 0 |
| Quick Ratio | 0.83 | 0.67 | 0.85 | 0.93 | 0 |
| D/E | 1.99 | 2.32 | 0.78 | 0.93 | 1.10 |
| Debt-to-Assets | 59% | 62% | 41% | 45% | 50% |
| Interest Coverage | 5.9 | 4.8 | 2.7 | 2.2 | 2.3 |
| Asset Turnover | 0.15 | 0.16 | 0.10 | 0.12 | 0.12 |
| Fixed Asset Turnover | 6.3 | 7.4 | 9.5 | 4.5 | 4.6 |
| Dividend Yield | 2.0% | 4.1% | 3.9% | 4.3% | 5.0% |
Note: Current and quick ratios are zero for 2025, indicating missing or unavailable liquidity data for that year.
Evolution of Financial Ratios
From 2021 to 2025, Extra Space Storage’s Return on Equity (ROE) declined sharply from 26.56% to 7.25%. The Current Ratio showed volatility, dropping to 0 in 2025 after fluctuating below 1 in prior years. Debt-to-Equity Ratio rose from 1.99 in 2021 to 1.10 in 2025, indicating increased leverage. Profitability margins mostly narrowed, reflecting pressure on net margins.
Are the Financial Ratios Favorable?
In 2025, profitability ratios show mixed signals: a favorable net margin of 28.8% contrasts with a low ROE of 7.25%. Liquidity ratios are unfavorable, with a zero current ratio raising red flags. Leverage remains high, with a debt-to-equity ratio above 1 and debt-to-assets at 50.4%. Asset turnover is weak, while fixed asset turnover and dividend yield appear favorable. Overall, the ratios suggest a slightly unfavorable financial condition.
Shareholder Return Policy
Extra Space Storage Inc. maintains a consistent dividend payout, with a 2025 dividend per share of 6.49 and a yield near 5%. The payout ratio exceeds 100%, indicating dividends slightly outpace net income, but free cash flow coverage supports distributions.
The company also engages in share buybacks, complementing dividends in returning capital. While the elevated payout ratio poses sustainability risks, coverage by free cash flow and buybacks suggest a balanced approach toward preserving long-term shareholder value.
Score analysis
The following radar chart illustrates key financial scores reflecting valuation, profitability, and leverage metrics for the company:
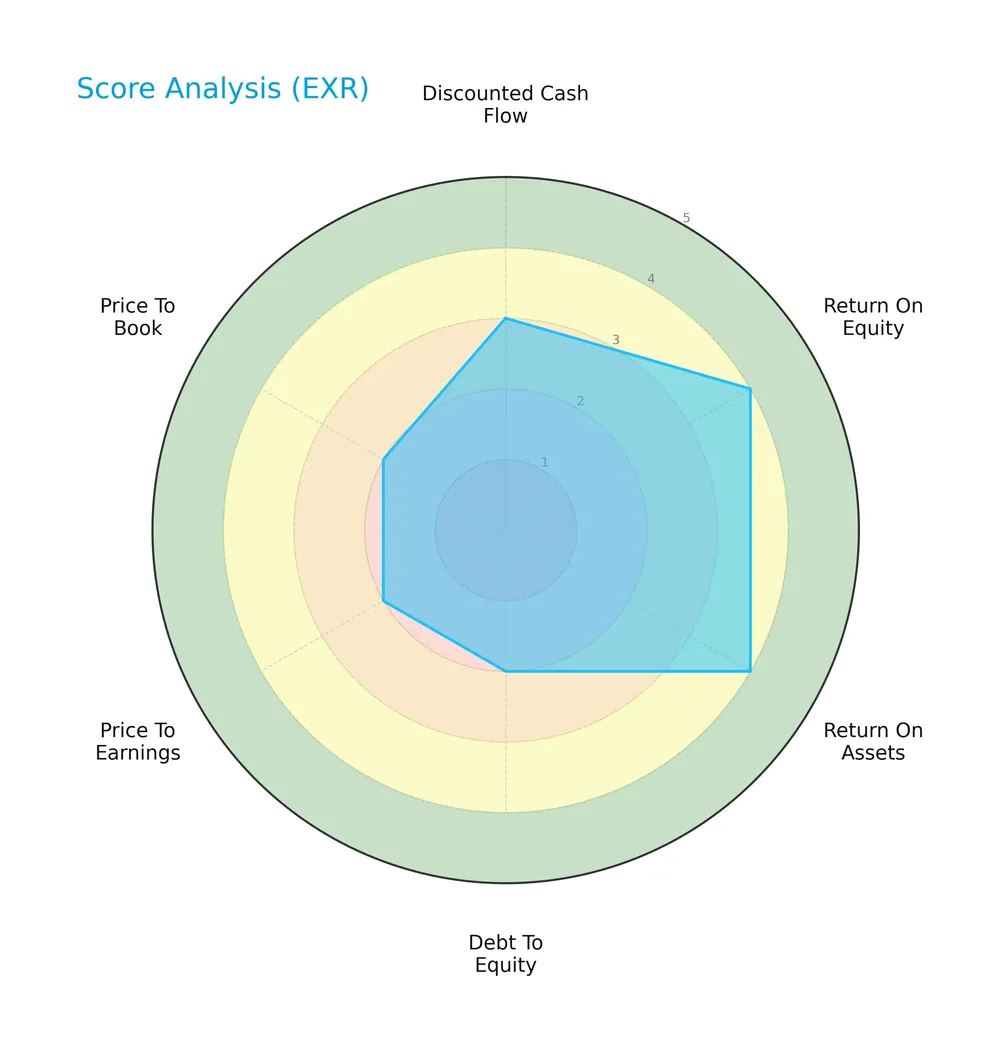
Extra Space Storage Inc. posts moderate discounted cash flow and overall scores. Profitability scores (ROE and ROA) are favorable. Debt-to-equity, PE, and PB scores indicate unfavorable valuation and leverage conditions.
Analysis of the company’s bankruptcy risk
The Altman Z-Score places the company in the distress zone, signaling a high risk of bankruptcy and financial distress:

Is the company in good financial health?
This Piotroski diagram provides insights into the company’s financial strength based on profitability, leverage, and liquidity criteria:

With an average Piotroski Score of 5, the company demonstrates moderate financial health but lacks the robustness seen in stronger value investments.
Competitive Landscape & Sector Positioning
This section analyzes Extra Space Storage Inc.’s strategic positioning, key products, and revenue segments. I will assess whether the company holds a competitive advantage over its main competitors.
Strategic Positioning
Extra Space Storage Inc. concentrates on self-storage operations and tenant reinsurance, generating $2.9B and $353M in 2025 revenue respectively. The company operates 1,906 stores across 40 states, Washington D.C., and Puerto Rico, reflecting focused geographic diversification within the U.S. market.
Revenue by Segment
This pie chart displays Extra Space Storage Inc.’s revenue breakdown by segment for fiscal year 2025, highlighting the contribution of core business lines.
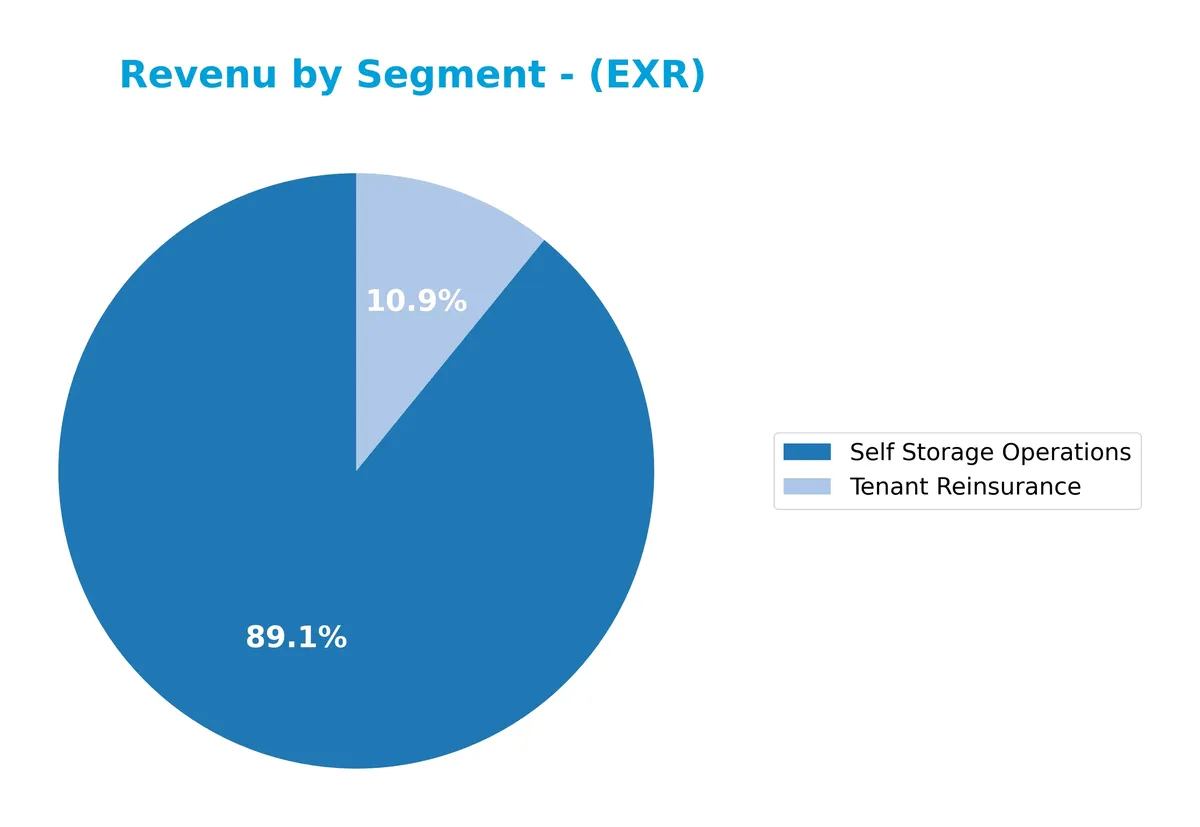
Self Storage Operations dominate revenue with $2.9B in 2025, showing consistent growth since 2017. Tenant Reinsurance, at $353M, grows steadily but remains a smaller contributor. The business remains heavily concentrated in its main segment, reflecting a strong moat but some concentration risk if market conditions shift. The steady acceleration in Self Storage Operations underscores the company’s effective capital allocation and operational scale.
Key Products & Brands
The following table outlines Extra Space Storage Inc.’s primary product segments and their descriptions:
| Product | Description |
|---|---|
| Self Storage Operations | Provides approximately 1.4M storage units across 1,906 stores in 40 states, D.C., and Puerto Rico. Includes boat, RV, and business storage. |
| Tenant Reinsurance | Offers insurance products protecting tenants’ stored goods, complementing core storage services. |
Extra Space Storage dominates the U.S. self-storage industry with a vast network of stores and diversified offerings. Its revenue streams include rental operations and tenant insurance, reflecting a broad and resilient business model.
Main Competitors
The sector includes 3 competitors, with the table below showing the top 3 leaders by market capitalization:
| Competitor | Market Cap. |
|---|---|
| Prologis, Inc. | 120B |
| Public Storage | 45.3B |
| Extra Space Storage Inc. | 27.8B |
Extra Space Storage Inc. ranks 3rd among its competitors. Its market cap is 27.08% of the leader, Prologis, Inc. The company sits below both the average market cap of the top 10 (64.3B) and the median market cap of the sector (45.3B). It maintains a significant 39.87% gap below its nearest competitor, Public Storage.
Comparisons with competitors
Check out how we compare the company to its competitors:
Does EXR have a competitive advantage?
Extra Space Storage Inc. demonstrates a clear competitive advantage, supported by a very favorable moat rating and a ROIC exceeding its WACC by a wide margin. This indicates efficient capital allocation and consistent value creation over 2021-2025.
Looking ahead, the company’s extensive footprint of nearly 1.9K stores across 40 states offers opportunities to leverage scale and expand into new markets. Continued growth in profitability and operational efficiency underpins its strong position in the self-storage REIT industry.
SWOT Analysis
This analysis highlights Extra Space Storage Inc.’s key strategic factors to inform investment decisions.
Strengths
- strong moat with ROIC far above WACC
- growing ROIC trend
- large scale with 1,906 stores nationwide
Weaknesses
- high debt-to-equity ratio at 1.1
- low current and quick ratios signal liquidity risk
- declining gross profit growth recently
Opportunities
- expanding self-storage demand in urban markets
- potential for technology-driven operational efficiencies
- dividend yield near 5% attracts income investors
Threats
- rising interest expenses reduce net income
- competitive pressure from new storage entrants
- economic downturns impacting occupancy rates
Extra Space Storage’s robust competitive advantage and scale support long-term value creation. However, elevated leverage and liquidity concerns require cautious capital management. Strategic focus should balance growth with strengthening financial flexibility.
Stock Price Action Analysis
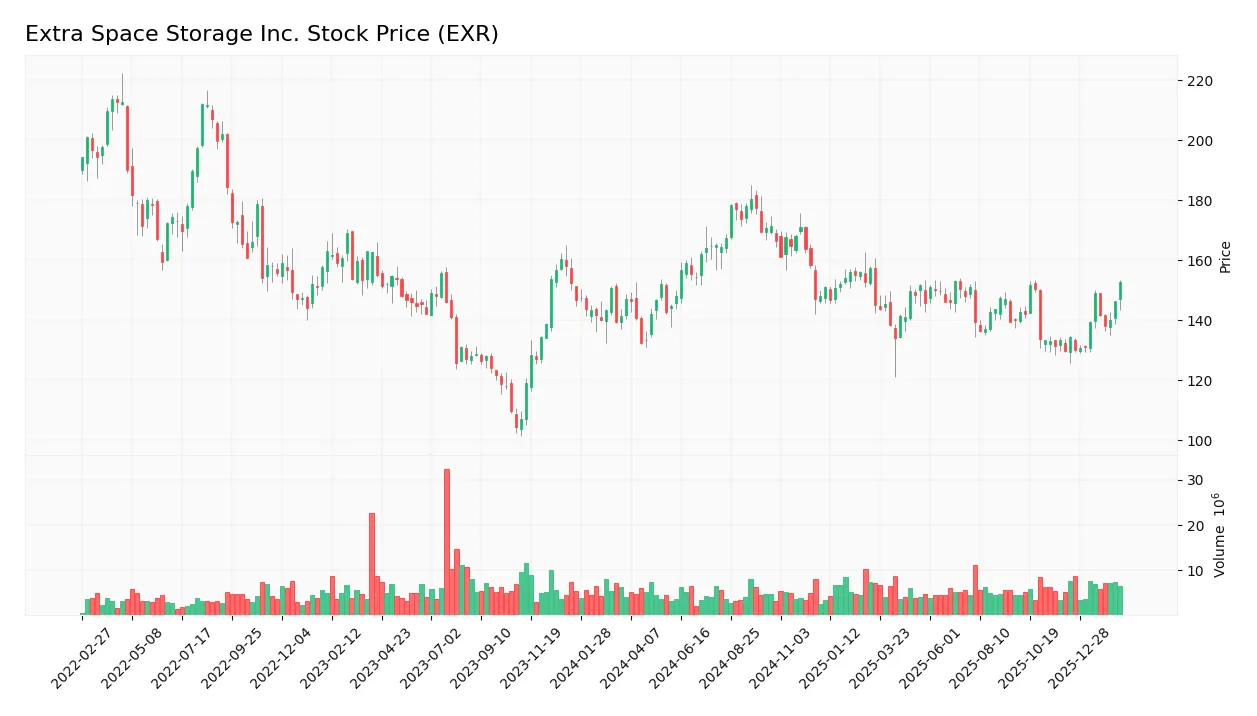
The weekly stock price chart for Extra Space Storage Inc. (EXR) highlights recent momentum and volatility patterns:
Trend Analysis
Over the past 12 months, EXR’s stock price increased by 3.91%, indicating a bullish trend with accelerating momentum. The price ranged between 129.56 and 180.41, accompanied by a high volatility level (std dev 12.47). Recent weeks show strong upward slope and a 17.9% gain since December 2025.
Volume Analysis
Trading volumes have increased, with buyers dominating 65.58% of activity since December 2025. Total volume reached 654M shares, reflecting growing investor interest. The buyer-driven volume surge signals positive market participation and confidence in the stock’s near-term prospects.
Target Prices
Analysts show a solid target consensus for Extra Space Storage Inc., reflecting moderate upside potential.
| Target Low | Target High | Consensus |
|---|---|---|
| 143 | 164 | 149.63 |
The target range suggests cautious optimism, with most analysts expecting steady valuation growth near 150.

Don’t Let Luck Decide Your Entry Point
Optimize your entry points with our advanced ProRealTime indicators. You’ll get efficient buy signals with precise price targets for maximum performance. Start outperforming now!
Analyst & Consumer Opinions
This section examines the grades and consumer feedback related to Extra Space Storage Inc. (EXR) for 2026.
Stock Grades
Here is the latest overview of Extra Space Storage Inc. grades from respected financial institutions:
| Grading Company | Action | New Grade | Date |
|---|---|---|---|
| Wells Fargo | Maintain | Overweight | 2026-02-05 |
| Truist Securities | Maintain | Hold | 2026-01-20 |
| Mizuho | Maintain | Outperform | 2026-01-12 |
| Scotiabank | Downgrade | Sector Perform | 2026-01-08 |
| UBS | Maintain | Buy | 2026-01-08 |
| Truist Securities | Maintain | Hold | 2025-12-16 |
| Mizuho | Maintain | Outperform | 2025-12-05 |
| Morgan Stanley | Maintain | Equal Weight | 2025-12-05 |
| RBC Capital | Maintain | Sector Perform | 2025-11-07 |
| Evercore ISI Group | Maintain | In Line | 2025-11-03 |
The consensus trend shows a predominance of hold and outperform ratings, with few downgrades. Most firms maintain stable views, reflecting cautious optimism for the stock’s near-term prospects.
Consumer Opinions
Consumers express a mix of praise and frustration when it comes to Extra Space Storage Inc.’s service quality and pricing.
| Positive Reviews | Negative Reviews |
|---|---|
| “Facilities are always clean and well-maintained.” | “Pricing feels high compared to local competitors.” |
| “Customer service staff is friendly and helpful.” | “Long wait times during peak hours.” |
| “Easy online reservation and payment system.” | “Some locations have limited unit availability.” |
Overall, customers appreciate the company’s cleanliness and customer service but frequently cite pricing and availability as pain points. These areas could impact retention if not addressed.
Risk Analysis
Below is a table summarizing key risks facing Extra Space Storage Inc., including their likelihood and potential impact:
| Category | Description | Probability | Impact |
|---|---|---|---|
| Financial Leverage | High debt-to-equity ratio (1.1) raises solvency concerns. | High | High |
| Liquidity Risk | Current and quick ratios at zero indicate poor short-term liquidity. | High | High |
| Market Valuation | Elevated P/E (28.3) and moderate P/B (2.05) suggest valuation risk. | Medium | Medium |
| Bankruptcy Risk | Altman Z-Score of 1.49 places company in distress zone. | Medium | High |
| Operational Risk | Asset turnover at 0.12 signals low efficiency in asset usage. | Medium | Medium |
| Interest Coverage | Coverage ratio 2.68 limits ability to manage rising interest costs. | Medium | Medium |
| Dividend Stability | Dividend yield of 4.98% is attractive but dependent on cash flow. | Low | Medium |
Extra Space Storage’s most critical risks stem from its high leverage and poor liquidity, which historically in REITs signal vulnerability during economic downturns. The Altman Z-Score in the distress zone confirms elevated bankruptcy risk despite favorable ROIC. Investors should weigh strong operational scale against these financial constraints.
Should You Buy Extra Space Storage Inc.?
Analytically, Extra Space Storage Inc. appears to be creating strong value with a durable competitive moat and growing profitability. Despite a considerable leverage profile and distress-zone Altman Z-score, the overall B rating suggests a cautiously favorable financial health profile.
Strength & Efficiency Pillars
Extra Space Storage Inc. exhibits robust operational efficiency, with a net margin of 28.84% and an EBIT margin of 50.31%, signaling strong profitability. The company’s return on invested capital (ROIC) stands at an impressive 164.26%, significantly exceeding its weighted average cost of capital (WACC) at 7.84%. This differential confirms that Extra Space Storage is a clear value creator, sustaining a competitive moat with growing profitability. The favorable gross margin of 28.43% further underscores its operational strength despite some headwinds.
Weaknesses and Drawbacks
Extra Space Storage is currently in financial distress, as indicated by an Altman Z-Score of 1.49, placing it in the Distress Zone and signaling a heightened bankruptcy risk. This solvency concern overshadows other factors. Additionally, the company faces valuation pressures with a relatively high P/E ratio of 28.32, suggesting premium pricing that may limit upside. Leverage is a concern, with a debt-to-equity ratio of 1.1 and a current ratio of 0, highlighting liquidity constraints that could exacerbate financial strain. These risks warrant caution.
Our Final Verdict about Extra Space Storage Inc.
Despite demonstrating strong operational margins and clear value creation, Extra Space Storage’s distressed solvency profile makes its investment case highly speculative. The company’s risk of bankruptcy, as flagged by its low Altman Z-Score, dominates the outlook. Therefore, this profile appears too risky for conservative capital. Investors might consider waiting for improved financial stability before engaging, even as the stock’s recent bullish momentum suggests underlying business potential.
Disclaimer: This content is for informational purposes only and does not constitute financial, investment, or other professional advice. Investing in financial markets involves a significant risk of loss, and past performance is not indicative of future results.
Additional Resources
- Extra Space Storage (EXR) Price Target Cut as Wells Fargo Flags Sector Caution – Finviz (Feb 21, 2026)
- Extra Space Storage Inc. Reports 2025 Fourth Quarter and Year-End Results – PR Newswire (Feb 19, 2026)
- Extra Space Storage Inc (EXR) Q4 2025 Earnings Call Highlights: Strategic Growth Amidst Challenging Conditions – GuruFocus (Feb 21, 2026)
- Extra Space Storage Inc. SEC 10-K Report – TradingView (Feb 20, 2026)
- REITs in the Community: Rep. Moore visits Extra Space Storage – Nareit (Feb 19, 2026)
For more information about Extra Space Storage Inc., please visit the official website: extraspace.com