Home > Analyses > Healthcare > Danaher Corporation
Danaher Corporation transforms healthcare and industry through cutting-edge diagnostics, life sciences tools, and environmental solutions. Its innovations power critical research, clinical care, and industrial quality worldwide. As a dominant player in medical diagnostics and laboratory automation, Danaher continually pushes boundaries in science and technology. Yet, in 2026, investors must ask: does Danaher’s robust market position and growth pipeline still justify its premium valuation? The answer demands a closer look.

Table of contents
Business Model & Company Overview
Danaher Corporation, founded in 1969 and headquartered in Washington, DC, stands as a dominant force in the Medical – Diagnostics & Research industry. It operates a cohesive ecosystem spanning Life Sciences, Diagnostics, and Environmental & Applied Solutions. This integrated approach supports advancements in healthcare, industrial, and commercial sectors through cutting-edge instruments, consumables, and software.
Danaher’s revenue engine balances hardware sales with recurring software and service offerings across global markets in the Americas, Europe, and Asia. Its diversified segments deliver value from mass spectrometers to clinical diagnostics and water treatment systems. I see Danaher’s competitive advantage rooted in its innovation-driven portfolio and strong global footprint, securing a robust economic moat in shaping the future of medical and environmental technology.
Financial Performance & Fundamental Metrics
I analyze Danaher Corporation’s income statement, key financial ratios, and dividend payout policy to reveal its operational strength and shareholder value approach.
Income Statement
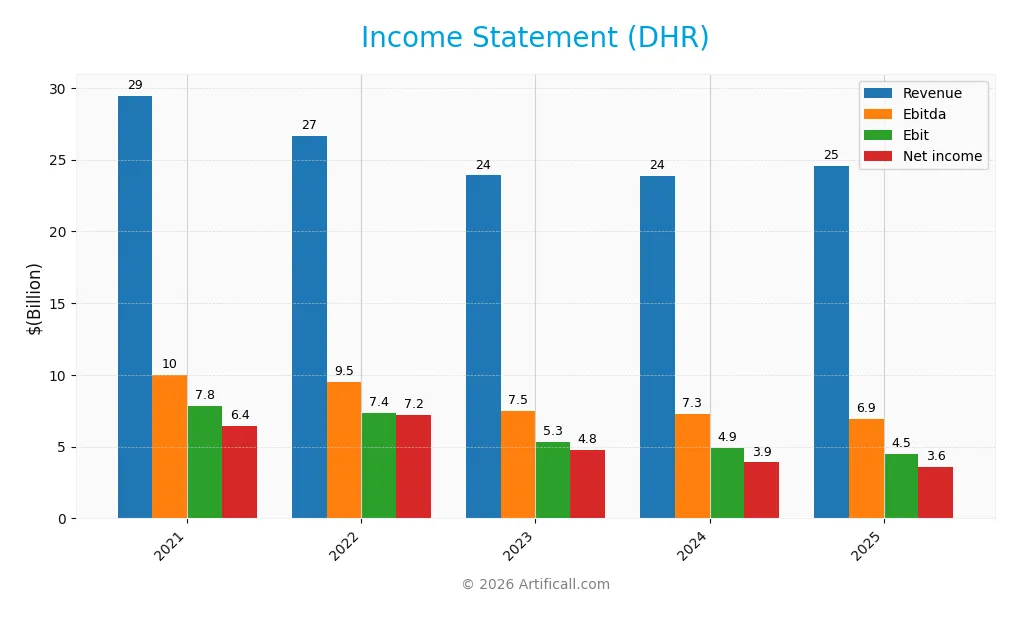
The table below summarizes Danaher Corporation’s key income statement items for fiscal years 2021 through 2025. All figures are in USD.
| 2021 | 2022 | 2023 | 2024 | 2025 | |
|---|---|---|---|---|---|
| Revenue | 29.5B | 26.6B | 23.9B | 23.9B | 24.6B |
| Cost of Revenue | 11.5B | 10.5B | 9.9B | 9.7B | 9.6B |
| Operating Expenses | 9.9B | 8.7B | 8.8B | 9.0B | 9.8B |
| Gross Profit | 17.9B | 16.2B | 14.0B | 14.2B | 15.0B |
| EBITDA | 10.0B | 9.5B | 7.5B | 7.3B | 6.9B |
| EBIT | 7.8B | 7.4B | 5.3B | 4.9B | 4.5B |
| Interest Expense | 241M | 207M | 289M | 278M | 265M |
| Net Income | 6.4B | 7.2B | 4.8B | 3.9B | 3.6B |
| EPS | 8.77 | 9.80 | 6.44 | 5.33 | 5.07 |
| Filing Date | 2022-02-23 | 2023-02-22 | 2024-02-21 | 2025-02-20 | 2026-02-24 |
Income Statement Evolution
From 2021 to 2025, Danaher’s revenue declined by 16.6%, signaling a contraction in top-line growth. Net income fell significantly by 43.8%, reflecting margin compression and cost pressures. Despite this, gross margin remained stable at 60.9%, indicating consistent production efficiency, while EBIT and net margins contracted, revealing rising operating costs relative to revenue.
Is the Income Statement Favorable?
The 2025 income statement shows mixed fundamentals. Revenue grew modestly by 2.9% year-over-year, but EBIT declined by 8.7%, and net margin dropped nearly 10%, signaling margin erosion. Interest expense remains low at 1.08% of revenue, a favorable sign. However, the overall income statement leans unfavorable due to declining profitability and earnings per share, overshadowing stable gross margins.
Financial Ratios
The table below presents key financial ratios for Danaher Corporation (DHR) from 2021 to 2025, illustrating profitability, valuation, liquidity, leverage, and efficiency metrics:
| Ratios | 2021 | 2022 | 2023 | 2024 | 2025 |
|---|---|---|---|---|---|
| Net Margin | 22% | 27% | 20% | 16% | 15% |
| ROE | 14.2% | 14.4% | 8.9% | 7.9% | 6.9% |
| ROIC | 8.9% | 8.7% | 5.7% | 6.1% | 5.7% |
| P/E | 32.4 | 23.7 | 35.8 | 43.0 | 44.8 |
| P/B | 4.61 | 3.41 | 3.19 | 3.39 | 3.08 |
| Current Ratio | 1.43 | 1.89 | 1.68 | 1.40 | 1.87 |
| Quick Ratio | 1.09 | 1.56 | 1.37 | 1.05 | 1.51 |
| D/E | 0.52 | 0.41 | 0.37 | 0.35 | 0.35 |
| Debt-to-Assets | 28% | 24% | 23% | 22% | 22% |
| Interest Coverage | 33.4 | 36.4 | 18.3 | 18.6 | 19.4 |
| Asset Turnover | 0.35 | 0.32 | 0.28 | 0.31 | 0.29 |
| Fixed Asset Turnover | 6.10 | 5.80 | 4.26 | 3.93 | 4.44 |
| Dividend Yield | 0.36% | 0.48% | 0.48% | 0.46% | 0.54% |
Evolution of Financial Ratios
Danaher’s Return on Equity (ROE) declined from 14.3% in 2022 to 6.9% in 2025, signaling reduced profitability. The Current Ratio improved steadily, rising from 1.43 in 2021 to 1.87 in 2025, enhancing liquidity. The Debt-to-Equity Ratio decreased from 0.52 in 2021 to 0.35 in 2025, reflecting better leverage management and financial stability.
Are the Financial Ratios Fovorable?
In 2025, Danaher’s profitability shows mixed signals: a favorable net margin of 14.7% contrasts with an unfavorable ROE of 6.9%. Liquidity ratios, including a 1.87 current ratio and 1.51 quick ratio, appear strong. Leverage metrics, with a 0.35 debt-to-equity ratio and 22.1% debt-to-assets, are favorable. However, valuation ratios like a 44.8 P/E and 3.08 P/B are unfavorable. Overall, 57% of ratios are favorable, supporting a generally positive financial standing.
Shareholder Return Policy
Danaher Corporation maintains a modest dividend payout ratio around 19-24%, with dividends per share rising steadily to $1.24 in 2025. The dividend yield remains below 1%, supported by free cash flow coverage and balanced capital expenditures. The company also engages in share buybacks, complementing its dividend strategy.
This disciplined approach aligns with sustainable long-term value creation by avoiding excessive distributions and maintaining financial flexibility. Danaher’s combination of dividends and buybacks demonstrates prudent capital allocation in line with its strong profitability and cash flow generation.
Score analysis
The radar chart below visualizes Danaher Corporation’s key financial scores relative to industry standards:
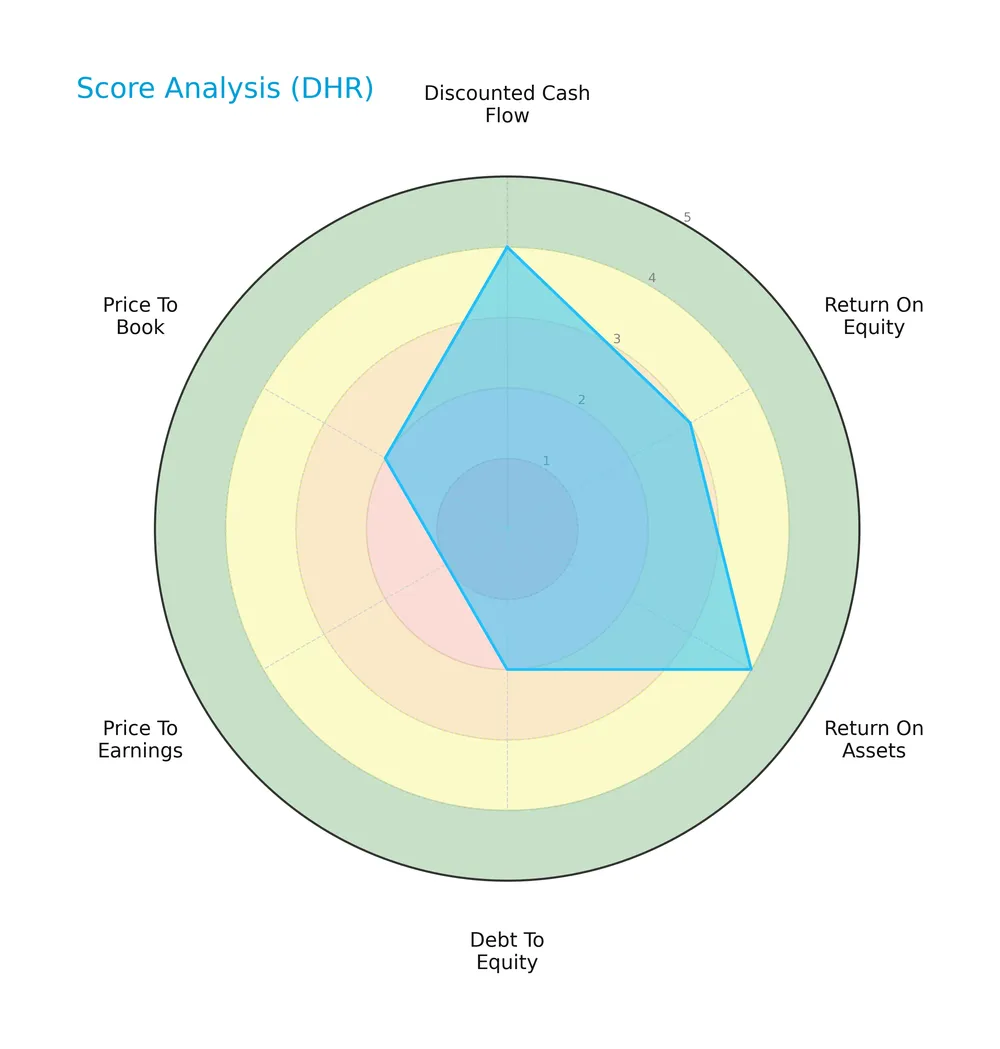
Danaher shows strong discounted cash flow (4) and return on assets (4) scores, indicating efficient capital use. Return on equity is moderate (3). Debt to equity (2), price to earnings (1), and price to book (2) scores highlight valuation and leverage concerns.
Analysis of the company’s bankruptcy risk
Danaher’s Altman Z-Score places it firmly in the safe zone, signaling low bankruptcy risk and solid financial stability:

Is the company in good financial health?
The Piotroski Score diagram offers insight into Danaher’s overall financial strength and operational efficiency:

With a strong score of 7, Danaher demonstrates robust profitability, liquidity, and operational improvements, reflecting good financial health despite some valuation and leverage weaknesses.
Competitive Landscape & Sector Positioning
This section analyzes Danaher Corporation’s strategic positioning within the healthcare sector. It covers revenue breakdown, key products, and main competitors. I will evaluate whether Danaher holds a competitive advantage over its industry peers.
Strategic Positioning
Danaher Corporation maintains a diversified product portfolio spanning Life Sciences, Diagnostics, and Environmental & Applied Solutions segments. Its geographic exposure covers North America, China, and other developed markets, reflecting a balanced approach between mature and high-growth regions.
Revenue by Segment
This pie chart illustrates Danaher Corporation’s revenue breakdown by segment for the fiscal year 2025.
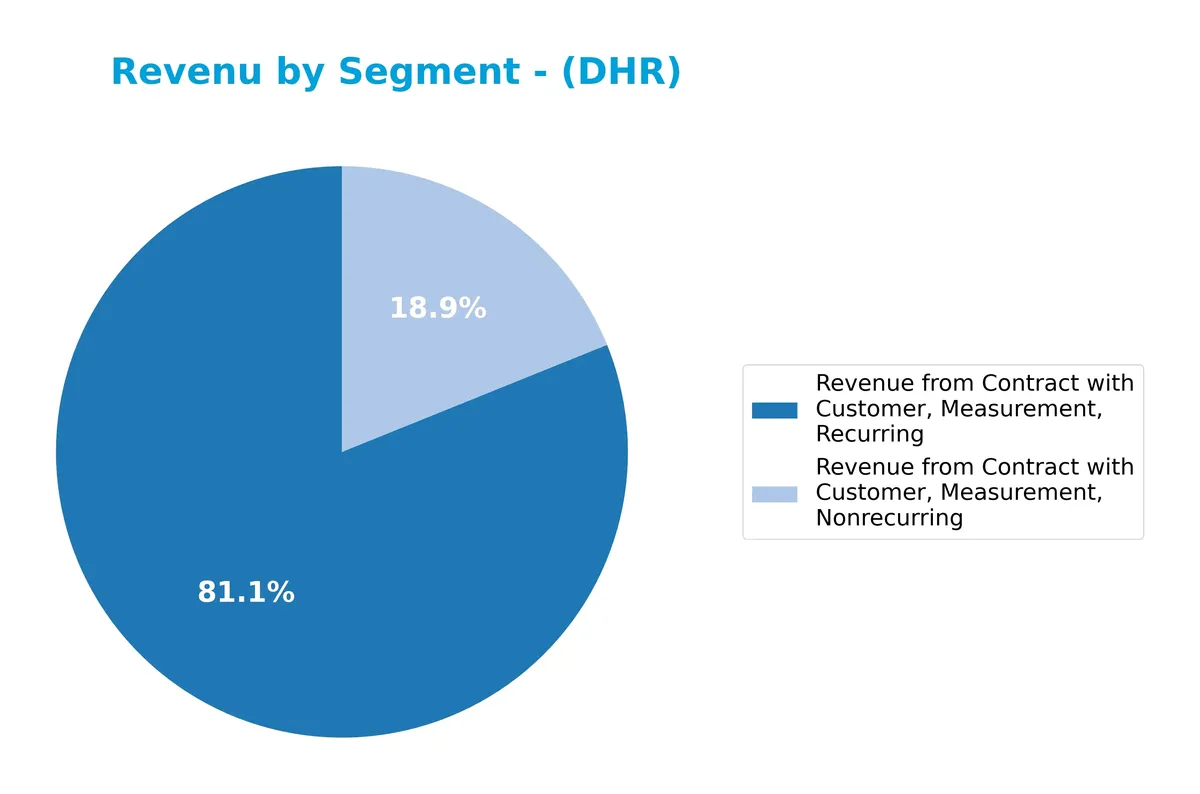
In 2025, recurring measurement revenue dominated with $20.1B, reflecting Danaher’s strong subscription and service model. Nonrecurring measurement revenue contributed $4.4B, showing a decline from previous years. The shift towards recurring revenues indicates a strategic focus on stable, predictable income streams. However, the drop in nonrecurring revenue signals potential concentration risks if recurring growth slows. Overall, the business leans heavily on measurement recurring contracts for growth.
Key Products & Brands
The following table outlines Danaher Corporation’s main product lines and brand segments:
| Product | Description |
|---|---|
| Life Sciences | Mass spectrometers, flow cytometry, genomics, lab automation, centrifugation, and microscopes. |
| Diagnostics | Chemistry, immunoassay, microbiology, hematology, molecular, acute care, and pathology diagnostics. |
| Environmental & Applied Solutions | Instruments, consumables, software, and disinfection systems for water quality and packaging management. |
| Dental | Dental products serving clinical and laboratory markets. |
| Industrial Technologies | Instrumentation and software for industrial applications including test and measurement. |
| Test & Measurement | Equipment and systems for precise measurement in industrial and scientific settings. |
Danaher’s portfolio spans critical healthcare and industrial sectors with a focus on recurring revenues from diagnostics and life sciences, supported by diversified environmental and dental instrument offerings.
Main Competitors
In the Healthcare sector’s Medical – Diagnostics & Research industry, 11 competitors exist; here are the top 10 leaders by market capitalization:
| Competitor | Market Cap. |
|---|---|
| Thermo Fisher Scientific Inc. | 225B |
| Danaher Corporation | 165B |
| IDEXX Laboratories, Inc. | 53.5B |
| Agilent Technologies, Inc. | 39.1B |
| IQVIA Holdings Inc. | 38.4B |
| Mettler-Toledo International Inc. | 28.8B |
| Waters Corporation | 22.7B |
| Quest Diagnostics Incorporated | 19.4B |
| Revvity, Inc. | 11.6B |
| Charles River Laboratories International, Inc. | 10.0B |
Danaher ranks 2nd among 11 competitors, holding 65.85% of the market cap of leader Thermo Fisher Scientific. Its market cap sits above both the 61.3B average of the top 10 and the 28.8B sector median. Danaher leads its nearest rival by a substantial 51.9%, indicating a strong position in this competitive landscape.
Comparisons with competitors
Check out how we compare the company to its competitors:
Does Danaher Corporation have a competitive advantage?
Danaher Corporation currently lacks a competitive advantage, as its return on invested capital (ROIC) falls below its weighted average cost of capital (WACC). The company is shedding value with a declining ROIC trend, indicating decreasing profitability over 2021-2025.
Looking ahead, Danaher operates diverse segments in Life Sciences, Diagnostics, and Environmental & Applied Solutions. Future opportunities lie in expanding advanced medical and bioprocess technologies, as well as growth in global developed markets and emerging regions.
SWOT Analysis
This SWOT analysis highlights Danaher Corporation’s key internal and external factors affecting its strategic positioning.
Strengths
- strong gross margin at 61%
- diversified business segments
- favorable liquidity ratios
Weaknesses
- declining revenue and net income over 5 years
- ROIC below WACC indicates value destruction
- high valuation multiples (PE 44.8, PB 3.08)
Opportunities
- growth potential in emerging markets like China
- innovation in life sciences and diagnostics
- environmental solutions demand rising globally
Threats
- intense competition in medical diagnostics
- regulatory risks in healthcare sector
- macroeconomic uncertainty affecting capital spending
Danaher’s robust margins and diversified portfolio provide resilience. However, declining profitability and value destruction demand strategic focus on innovation and cost control. Emerging market expansion and environmental solutions offer growth avenues, but investors must watch competitive and regulatory pressures closely.
Stock Price Action Analysis
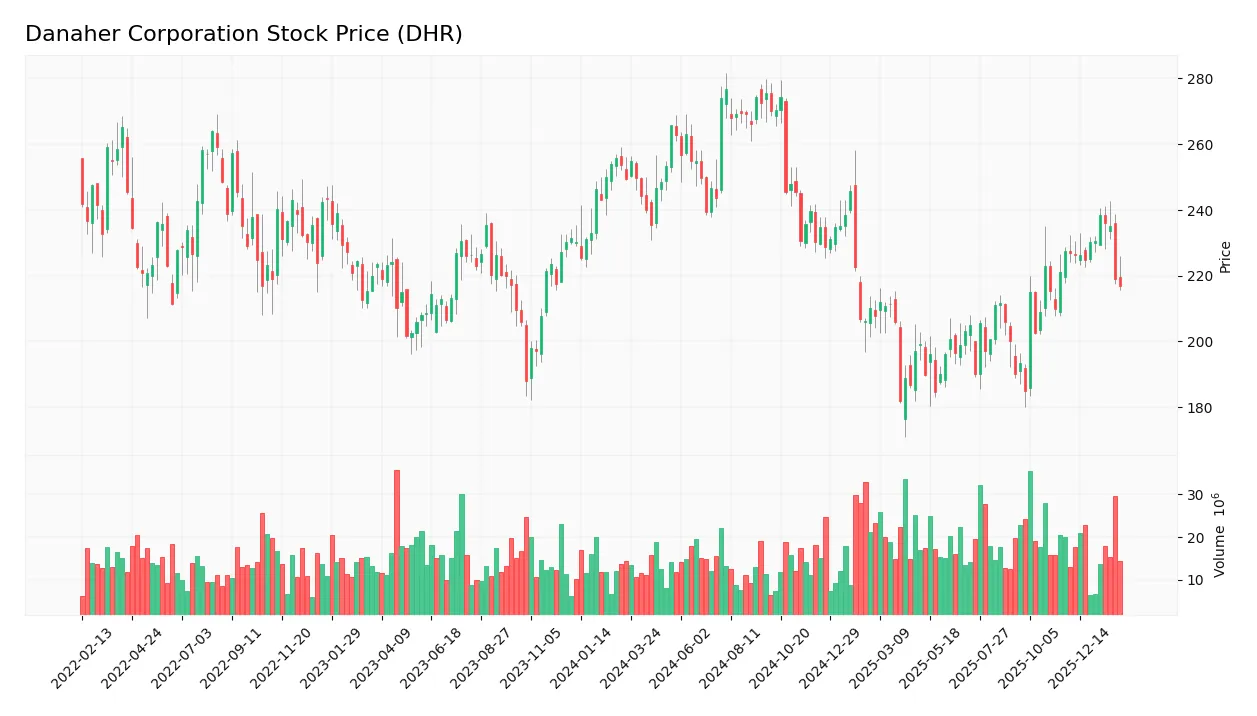
The weekly stock chart below illustrates Danaher Corporation’s price movements over the past 12 months, highlighting key fluctuations and overall direction:
Trend Analysis
Over the past year, Danaher’s stock declined by 14.36%, indicating a bearish trend with decelerating momentum. The price ranged from a high of 276.75 to a low of 181.77, showing significant volatility with a standard deviation of 26.38. Recent three-month data confirms this bearish posture with a -7.57% drop.
Volume Analysis
Trading volume shows an increasing trend with a total of 1.97B shares traded. Buyer volume slightly exceeds seller volume overall, but recent months reveal seller dominance at 77%. This suggests weakening buyer conviction and elevated selling pressure among investors.
Target Prices
Analysts show a bullish consensus for Danaher Corporation, reflecting confidence in its growth prospects.
| Target Low | Target High | Consensus |
|---|---|---|
| 220 | 270 | 252.33 |
The target range from 220 to 270 suggests robust upside potential. The consensus at 252.33 indicates strong market optimism.

Don’t Let Luck Decide Your Entry Point
Optimize your entry points with our advanced ProRealTime indicators. You’ll get efficient buy signals with precise price targets for maximum performance. Start outperforming now!
Analyst & Consumer Opinions
This section reviews analyst grades and consumer feedback to provide a balanced view of Danaher Corporation’s market perception.
Stock Grades
Here is the latest collection of verified analyst grades for Danaher Corporation, reflecting current market sentiment and analyst views:
| Grading Company | Action | New Grade | Date |
|---|---|---|---|
| JP Morgan | Maintain | Overweight | 2026-01-29 |
| Jefferies | Maintain | Buy | 2026-01-29 |
| TD Cowen | Maintain | Buy | 2026-01-07 |
| Guggenheim | Maintain | Buy | 2026-01-05 |
| Wells Fargo | Maintain | Equal Weight | 2025-12-15 |
| Wells Fargo | Maintain | Equal Weight | 2025-10-23 |
| TD Cowen | Maintain | Buy | 2025-10-22 |
| Barclays | Maintain | Overweight | 2025-10-22 |
| Rothschild & Co | Downgrade | Neutral | 2025-10-08 |
| Evercore ISI Group | Maintain | Outperform | 2025-10-07 |
The consensus leans strongly toward a Buy rating, with multiple firms maintaining positive outlooks. Notably, Rothschild & Co’s recent downgrade to Neutral stands out amid broad analyst confidence.
Consumer Opinions
Danaher Corporation earns strong praise from consumers, reflecting its solid reputation in innovation and quality.
| Positive Reviews | Negative Reviews |
|---|---|
| Consistently high-quality products that meet expectations. | Customer service can be slow during peak times. |
| Innovative solutions that simplify complex processes. | Pricing is higher than some competitors. |
| Reliable performance across various industries. | Occasional delays in product delivery reported. |
Overall, consumers admire Danaher’s innovation and product reliability. However, customer service responsiveness and pricing remain common concerns.
Risk Analysis
Below is a summary of Danaher Corporation’s key risks, categorized by probability and impact:
| Category | Description | Probability | Impact |
|---|---|---|---|
| Valuation Risk | Elevated P/E ratio (44.8) and P/B (3.08) suggest overvaluation | Medium | High |
| Profitability Risk | ROE at 6.88% lags industry norms, indicating return concerns | Medium | Medium |
| Leverage Risk | Debt-to-Equity score unfavorable despite low debt ratios | Low | Medium |
| Market Volatility | Beta near 1 implies stock moves with market, exposing to swings | Medium | Medium |
| Dividend Yield | Low yield (0.54%) may deter income-focused investors | Low | Low |
| Operational Risk | Below-average asset turnover (0.29) signals inefficiency | Medium | Medium |
The highest risks stem from valuation and moderate profitability concerns. Danaher trades at a premium compared to the S&P 500 average P/E (~20-25), increasing correction risk. Its safe-zone Altman Z-score (4.21) and strong Piotroski score (7) mitigate bankruptcy fears. However, inefficiencies in asset utilization and moderate ROE suggest management must improve capital allocation to sustain growth. I recommend close monitoring of valuation multiples and operational metrics amid market volatility.
Should You Buy Danaher Corporation?
Danaher appears to be a company with moderate profitability but a very unfavorable moat, as its declining ROIC suggests value destruction. Despite a manageable debt profile, valuation metrics appear weak. Overall, it holds a solid B rating, reflecting cautious optimism.
Strength & Efficiency Pillars
Danaher Corporation posts a solid net margin of 14.71%, underscoring healthy profitability. Its interest expense remains modest at 1.08%, supporting operational efficiency. The company maintains a favorable weighted average cost of capital (WACC) at 7.59%, but with a return on invested capital (ROIC) of 5.72%, Danaher is shedding value rather than creating it. While the ROIC underperforms WACC, the strong Piotroski score of 7 signals sound financial strength and resilience in core operations.
Weaknesses and Drawbacks
Danaher faces valuation headwinds with a high price-to-earnings ratio of 44.8 and a price-to-book ratio of 3.08, indicating premium pricing that may limit upside. The stock’s asset turnover ratio is weak at 0.29, signaling inefficiencies in asset utilization. Recent market trends show seller dominance at 76.9%, creating short-term pressure. Despite a safe-zone Altman Z-Score of 4.21, these valuation and operational concerns warrant caution for risk-sensitive investors.
Our Final Verdict about Danaher Corporation
Danaher’s strong financial footing, as evidenced by its safe Altman Z-Score and robust Piotroski score, suggests a fundamentally stable profile. However, the bearish stock trend and recent seller dominance imply that despite long-term strength, a wait-and-see approach might appear prudent. The premium valuation and operational inefficiencies suggest the stock could face headwinds before becoming an attractive long-term exposure.
Disclaimer: This content is for informational purposes only and does not constitute financial, investment, or other professional advice. Investing in financial markets involves a significant risk of loss, and past performance is not indicative of future results.
Additional Resources
- All-Cash Masimo Deal Offers Strong Strategic Fit For Danaher Corporation (DHR) – Finviz (Feb 24, 2026)
- Danaher (DHR) is Gaining from Improvement in Its Bioprocessing Business – Yahoo Finance (Feb 24, 2026)
- Decoding Danaher Corp (DHR): A Strategic SWOT Insight – GuruFocus (Feb 25, 2026)
- Danaher to pay shareholders $0.40 per share in April dividend – Stock Titan (Feb 24, 2026)
- All-Cash Masimo Deal Offers Strong Strategic Fit For Danaher Corporation (DHR) – Insider Monkey (Feb 24, 2026)
For more information about Danaher Corporation, please visit the official website: danaher.com