Home > Analyses > Technology > CoreWeave, Inc. Class A Common Stock
CoreWeave powers the future of artificial intelligence by delivering cutting-edge cloud infrastructure tailored for GenAI workloads. Its robust platform accelerates enterprises’ compute demands with GPU and CPU services, plus advanced tools for AI model training and rendering. Known for innovation and scalability, CoreWeave challenges industry giants with its nimble approach. Yet, as the cloud infrastructure space intensifies, I question whether CoreWeave’s fundamentals sustain its lofty valuation and rapid growth trajectory.

Table of contents
Business Model & Company Overview
CoreWeave, Inc. Class A Common Stock operates a cloud platform specializing in infrastructure for GenAI workloads. Founded in 2017 and based in Livingston, New Jersey, the company has quickly established a leading position in software infrastructure. Its ecosystem integrates GPU and CPU compute, storage, networking, and managed services, forming a cohesive solution that supports enterprises’ complex compute demands with tools like tensorizer and mission control.
CoreWeave generates revenue by blending hardware-intensive services like virtual and bare metal servers with scalable software solutions for AI model training, inference, and VFX rendering. Its footprint spans the Americas, Europe, and Asia, addressing global demand. The company’s competitive advantage lies in its specialized infrastructure that underpins next-generation AI applications, positioning it as a key player shaping the future of cloud compute.
Financial Performance & Fundamental Metrics
I will analyze CoreWeave, Inc.’s income statement, key financial ratios, and dividend payout policy to assess its profitability, efficiency, and shareholder returns.
Income Statement
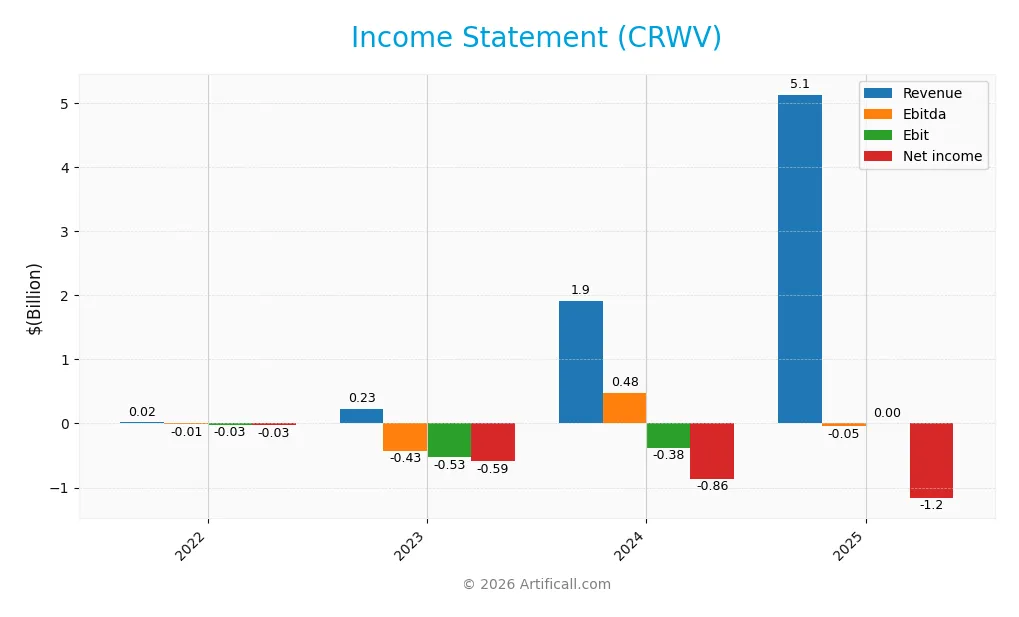
This table presents CoreWeave, Inc.’s key income statement figures from 2022 through 2025, highlighting revenue growth alongside fluctuating profitability metrics.
| 2022 | 2023 | 2024 | 2025 | |
|---|---|---|---|---|
| Revenue | 15.8M | 229M | 1.92B | 5.13B |
| Cost of Revenue | 12.1M | 69M | 493M | 1.45B |
| Operating Expenses | 26.6M | 175M | 1.10B | 3.72B |
| Gross Profit | 3.7M | 160M | 1.42B | 3.68B |
| EBITDA | -14M | -426M | 480M | -46M |
| EBIT | -25.6M | -530M | -383M | 0 |
| Interest Expense | 9.4M | 28.4M | 361M | 1.23B |
| Net Income | -31.1M | -594M | -863M | -1.17B |
| EPS | -0.08 | -1.47 | -2.33 | -2.75 |
| Filing Date | 2022-12-31 | 2023-12-31 | 2024-12-31 | 2026-02-26 |
Income Statement Evolution
CoreWeave’s revenue surged dramatically from $23M in 2023 to $5.13B in 2025, reflecting rapid top-line growth. Gross margin held strong near 72%, indicating efficient cost control despite scale. However, net income remained negative, though net margin improved modestly, showing some progress in profitability amid expanding operating expenses.
Is the Income Statement Favorable?
In 2025, CoreWeave posted $5.13B revenue with a robust 71.7% gross margin, signaling solid core profitability. Yet, the company reported a net loss of $1.17B due to high operating and interest expenses, pushing net margin to -22.7%. While revenue growth and gross margins are favorable, persistent net losses and zero EBIT margin highlight ongoing challenges. Overall, fundamentals appear mixed but lean toward favorable given strong revenue momentum.
Financial Ratios
The following table summarizes CoreWeave, Inc. Class A Common Stock’s key financial ratios for the fiscal years 2022 through 2025:
| Ratios | 2022 | 2023 | 2024 | 2025 |
|---|---|---|---|---|
| Net Margin | -196% | -259% | -451% | -227% |
| ROE | 0 | 1.0% | 209% | -350% |
| ROIC | 0 | -0.3% | 2.1% | -0.1% |
| P/E | -520 | -27 | -19 | -27 |
| P/B | 0 | -27 | -39 | 9.3 |
| Current Ratio | 0 | 0.50 | 0.39 | 0.46 |
| Quick Ratio | 0 | 0.50 | 0.39 | 0.46 |
| D/E | 0 | -3.4 | -26 | 4.5 |
| Debt-to-Assets | 0 | 40% | 60% | 31% |
| Interest Coverage | -2.4 | -0.5 | 0.9 | 0.04 |
| Asset Turnover | 0 | 0.05 | 0.11 | 0.10 |
| Fixed Asset Turnover | 0 | 0.06 | 0.13 | 0.13 |
| Dividend Yield | 0% | 0% | 0.36% | 0% |
Evolution of Financial Ratios
From 2022 to 2025, CoreWeave’s Return on Equity (ROE) declined sharply, reaching -35% in 2025. The Current Ratio remained below 1.0 throughout, indicating persistent liquidity constraints. The Debt-to-Equity Ratio rose significantly, peaking at 4.54 in 2025, signaling increased leverage. Profitability stayed negative, with net margins worsening to -22.7%.
Are the Financial Ratios Favorable?
In 2025, profitability ratios such as ROE and net margin were distinctly unfavorable, reflecting ongoing losses. Liquidity ratios, including the Current and Quick Ratios at 0.46, signal weak short-term financial health. Leverage is high with a Debt-to-Equity of 4.54. Asset turnover and interest coverage also rank poorly. Only the negative P/E ratio appears favorable. Overall, the financial ratios paint a very unfavorable picture.
Shareholder Return Policy
CoreWeave, Inc. does not pay dividends, reflecting its negative net income and ongoing reinvestment strategy. The company focuses on growth and capital expenditure, as shown by its negative free cash flow per share of -16.7 in 2025.
The absence of dividends aligns with CoreWeave’s high-growth phase priorities, including R&D and acquisitions. There is no current share buyback program, indicating a reinvestment focus that supports long-term shareholder value creation under its business model.
Score analysis
The following radar chart displays CoreWeave’s key financial metric scores for a comprehensive view:
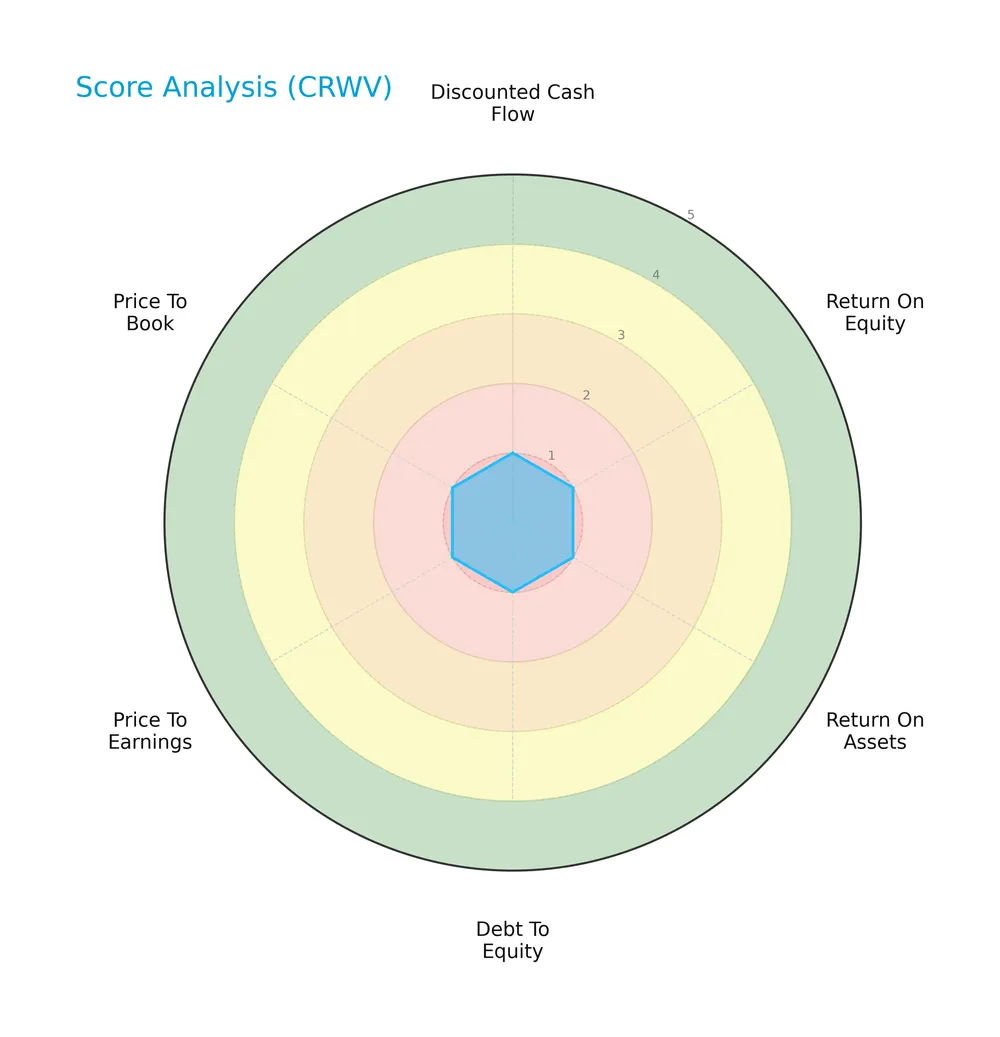
CoreWeave scores uniformly low across all metrics: DCF, ROE, ROA, Debt/Equity, PE, and PB each rank as very unfavorable. This indicates persistent fundamental weaknesses across valuation and profitability measures.
Analysis of the company’s bankruptcy risk
CoreWeave’s Altman Z-Score places it firmly in the distress zone, signaling a high risk of bankruptcy:
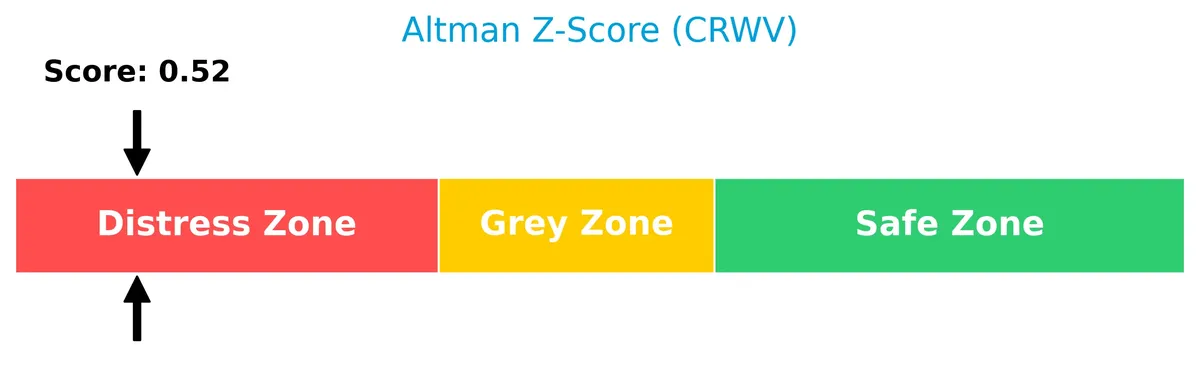
The score of 0.52 falls well below the 1.8 distress threshold, highlighting significant financial vulnerability and liquidity concerns.
Is the company in good financial health?
The Piotroski Score diagram below illustrates CoreWeave’s moderate financial strength based on nine criteria:
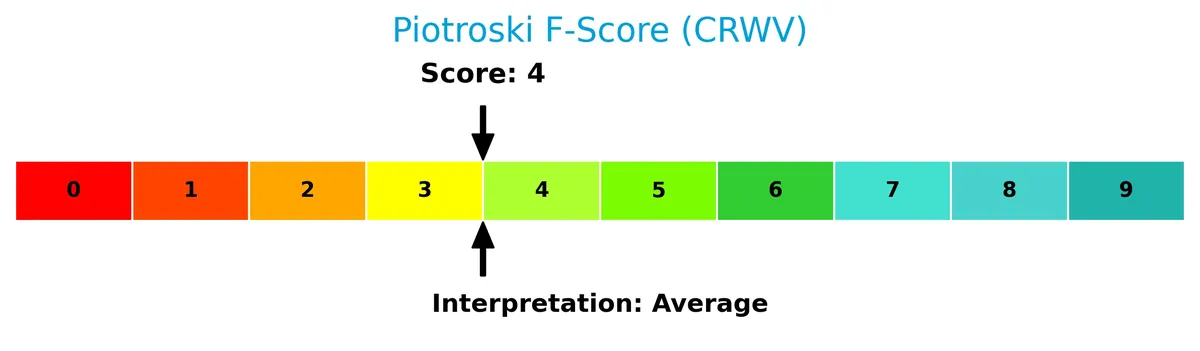
With a score of 4, CoreWeave sits in the average category, reflecting mixed signals in profitability, leverage, and operational efficiency. This middling score suggests cautious evaluation of its financial health.
Competitive Landscape & Sector Positioning
This sector analysis examines CoreWeave, Inc.’s strategic positioning, revenue segments, key products, and main competitors. I will assess whether CoreWeave holds a competitive advantage in the software infrastructure industry.
Strategic Positioning
CoreWeave concentrates its offerings on cloud infrastructure tailored for GenAI and compute workloads. Its product portfolio spans GPU and CPU compute, storage, networking, and managed services, serving enterprise applications with a focus on scalability and performance. The company operates primarily from the US.
Key Products & Brands
CoreWeave offers a diverse cloud platform with multiple products and services designed for scalable compute workloads:
| Product | Description |
|---|---|
| GPU Compute | High-performance graphics processing unit resources tailored for demanding compute tasks. |
| CPU Compute | Central processing unit resources supporting general-purpose computing needs. |
| Storage Services | Cloud storage solutions enabling data persistence and accessibility for enterprise workloads. |
| Networking Services | Infrastructure facilitating efficient data transfer and connectivity across cloud resources. |
| Managed Services | Support and operational management for customers’ cloud infrastructure environments. |
| Virtual and Bare Metal Servers | Provisioning of both virtualized and dedicated physical servers for flexible deployment options. |
| Fleet Lifecycle Controller | Tool managing the entire lifecycle of computing fleets within the platform. |
| Node Lifecycle Controller | Software handling the provisioning, maintenance, and decommissioning of individual compute nodes. |
| Tensorizer | Specialized platform component designed to optimize tensor operations for AI workloads. |
| Observability | Monitoring and analytics tools providing insight into platform performance and health. |
| VFX and Rendering | Services supporting visual effects creation and rendering processes. |
| AI Model Training | Infrastructure and tools dedicated to training artificial intelligence models. |
| AI Inference | Real-time AI model deployment for inference tasks on the platform. |
| Mission Control | Centralized management interface for orchestrating and controlling cloud resources and workloads. |
CoreWeave’s suite spans core infrastructure components and specialized AI tools, reflecting its focus on GenAI scaling and enterprise compute acceleration. The product mix supports both foundational and advanced cloud computing needs.
Main Competitors
The sector includes 32 competitors, with the table below listing the top 10 leaders by market capitalization:
| Competitor | Market Cap. |
|---|---|
| Microsoft Corporation | 3.52T |
| Oracle Corporation | 553B |
| Palantir Technologies Inc. | 383B |
| Adobe Inc. | 140B |
| Palo Alto Networks, Inc. | 120B |
| CrowdStrike Holdings, Inc. | 113B |
| Synopsys, Inc. | 92B |
| Cloudflare, Inc. | 69B |
| Fortinet, Inc. | 59B |
| Block, Inc. | 40B |
CoreWeave ranks 11th among 32 competitors. Its market cap is just 1.38% of Microsoft’s, the sector leader. The company is below the $508B average market cap of the top 10 but remains above the $18.8B median for the sector. It sits roughly 18.6% below its nearest competitor above, indicating a moderate gap in scale.
Does CoreWeave have a competitive advantage?
CoreWeave operates in the software infrastructure sector with strong revenue growth and a favorable gross margin of 71.68%. However, its ROIC is significantly below WACC, indicating the company is currently shedding value and lacks a sustainable economic moat.
Looking ahead, CoreWeave’s cloud platform supports scaling and acceleration for GenAI, with diverse products including GPU compute and AI model training. These offerings position the company to capture growth opportunities in emerging AI and rendering markets, despite present profitability challenges.
Comparisons with competitors
Check out how we compare the company to its competitors:
SWOT Analysis
This SWOT analysis highlights CoreWeave’s strategic position by examining internal capabilities and external factors.
Strengths
- rapid revenue growth
- strong gross margin (71.7%)
- innovative GenAI infrastructure platform
Weaknesses
- negative net margin (-22.7%)
- poor liquidity (current ratio 0.46)
- high financial leverage (D/E 4.54)
Opportunities
- expanding AI and cloud computing markets
- increasing enterprise demand for GPU compute
- potential for managed service expansion
Threats
- intense competition in cloud infrastructure
- high beta (21.65) indicates extreme volatility
- technology obsolescence risk
CoreWeave’s rapid growth and industry focus position it well for capitalizing on AI trends. However, weak profitability and liquidity signal financial risk. The company must prioritize margin improvement and balance sheet strength to sustain growth.
Stock Price Action Analysis
The weekly stock chart below illustrates CoreWeave’s price movements, highlighting key trend shifts and volatility patterns over the analyzed period:
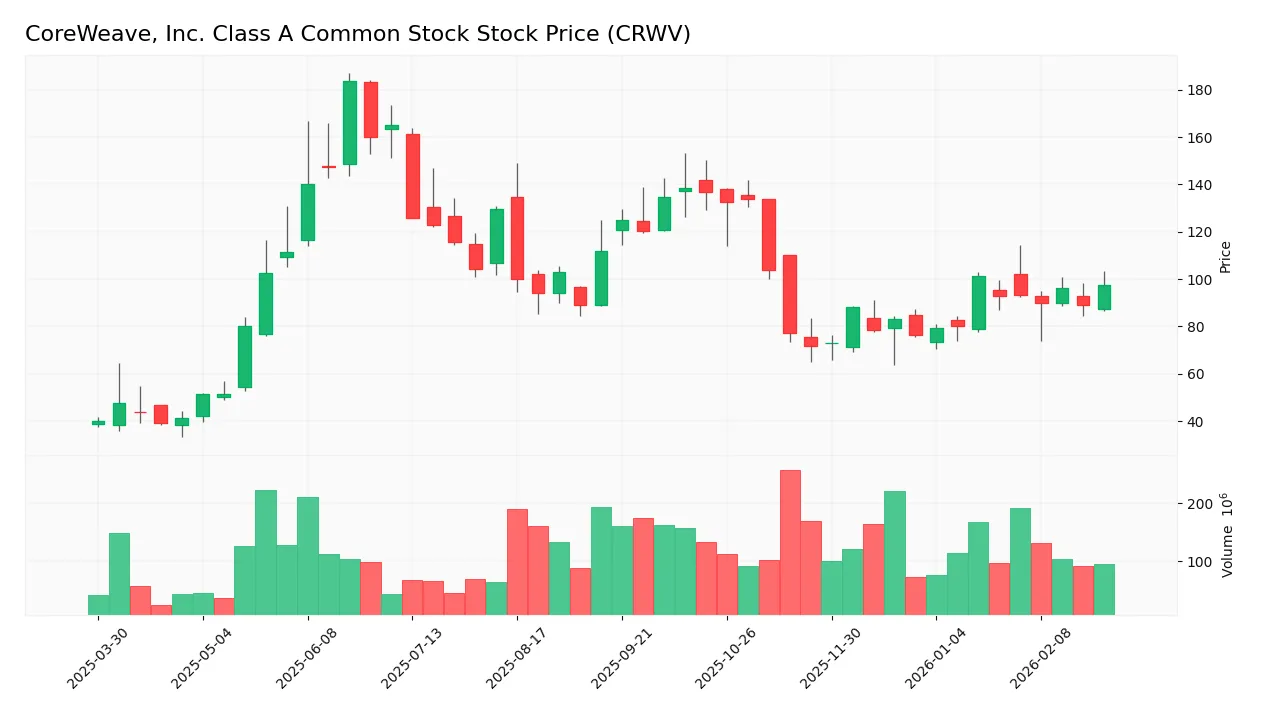
Trend Analysis
Over the past two years, CRWV’s stock price surged 144.07%, confirming a strong bullish trend with accelerating momentum. The price ranged from a low of 39.09 to a high of 183.58, accompanied by a high volatility level (33.53 std deviation), reflecting significant investor interest and price swings.
Volume Analysis
Trading volume shows an increasing trend, with buyers dominating 63.53% of activity in the last three months. This buyer-driven volume suggests growing investor confidence and robust market participation supporting the bullish price trajectory.
Target Prices
Analysts present a moderately bullish consensus for CoreWeave, Inc. Class A Common Stock (CRWV).
| Target Low | Target High | Consensus |
|---|---|---|
| 84 | 175 | 121.07 |
The target prices indicate a wide range, reflecting some uncertainty, but the consensus suggests upside potential above current levels.
Analyst & Consumer Opinions
This section examines recent analyst grades and consumer feedback related to CoreWeave, Inc. Class A Common Stock (CRWV).

Don’t Let Luck Decide Your Entry Point
Optimize your entry points with our advanced ProRealTime indicators. You’ll get efficient buy signals with precise price targets for maximum performance. Start outperforming now!
Stock Grades
Here is the latest rating summary for CoreWeave, Inc. Class A Common Stock from established analysts:
| Grading Company | Action | New Grade | Date |
|---|---|---|---|
| Deutsche Bank | Upgrade | Buy | 2026-01-27 |
| Macquarie | Maintain | Neutral | 2026-01-27 |
| Mizuho | Maintain | Neutral | 2026-01-27 |
| DA Davidson | Upgrade | Buy | 2026-01-26 |
| Needham | Maintain | Hold | 2026-01-26 |
| Barclays | Maintain | Equal Weight | 2026-01-12 |
| Wells Fargo | Maintain | Overweight | 2026-01-08 |
| DA Davidson | Upgrade | Neutral | 2026-01-05 |
| Jefferies | Maintain | Buy | 2026-01-05 |
| Goldman Sachs | Maintain | Neutral | 2025-11-17 |
Overall, the grades show a positive tilt with multiple upgrades to Buy and no downgrades, reflecting growing analyst confidence. Several firms maintain Neutral or Hold, indicating cautious optimism without consensus enthusiasm.
Consumer Opinions
CoreWeave, Inc. sparks a mix of enthusiasm and caution among its user base, reflecting its rapid growth and evolving service quality.
| Positive Reviews | Negative Reviews |
|---|---|
| “Impressive GPU cloud performance and speed.” | “Customer support response times are slow.” |
| “Scalable solutions meet our growing needs.” | “Pricing can be unpredictable for startups.” |
| “Reliable uptime boosts our project delivery.” | “Limited documentation for new users.” |
Consumers consistently praise CoreWeave’s high-performance infrastructure and scalability. However, concerns about customer support and pricing transparency surface regularly, signaling areas for management to address.
Risk Analysis
Below is a detailed table summarizing CoreWeave’s key risks by category, probability, and impact:
| Category | Description | Probability | Impact |
|---|---|---|---|
| Financial Health | Negative net margin (-22.7%) and ROE (-35%) signal ongoing losses and poor profitability. | High | High |
| Liquidity | Current and quick ratios at 0.46 indicate weak short-term liquidity, raising solvency concerns. | High | High |
| Leverage | Debt-to-equity ratio of 4.54 shows heavy reliance on debt, increasing financial risk. | High | Medium |
| Market Volatility | Extremely high beta at 21.65 implies CoreWeave’s stock price swings far exceed the market. | High | High |
| Operational | Low asset turnover (0.1) suggests inefficient use of assets to generate revenue. | Medium | Medium |
| Bankruptcy Risk | Altman Z-score of 0.52 places CoreWeave firmly in the distress zone, signaling bankruptcy risk. | High | Critical |
CoreWeave faces significant risks, chiefly its dire liquidity and profitability metrics combined with a very high beta. The distress-zone Altman Z-score warns of potential insolvency. Investors must weigh these red flags against the company’s growth potential in the cloud infrastructure sector.
Should You Buy CoreWeave, Inc. Class A Common Stock?
CoreWeave’s analytical interpretation suggests a challenging profile with deteriorating profitability and an unfavorable moat marked by persistent value destruction. Despite manageable debt signals, its overall rating stands at D+, reflecting significant operational inefficiencies and financial distress risks.
Strength & Efficiency Pillars
CoreWeave, Inc. Class A Common Stock exhibits strong operational efficiency with a gross margin of 71.68%, reflecting effective cost management. Revenue growth soars at 167.88% year-over-year, signaling robust top-line expansion. However, profitability metrics underperform, as net margin is negative at -22.74% and ROIC stands at -0.11%, well below the WACC of 78.89%. The company is clearly destroying value rather than creating it, despite favorable revenue dynamics.
Weaknesses and Drawbacks
CoreWeave faces significant financial distress, with an Altman Z-Score of 0.52 placing it firmly in the distress zone and indicating a high bankruptcy risk. Leverage is excessive, with a debt-to-equity ratio of 4.54 and a precarious current ratio of 0.46, signaling liquidity challenges. Valuation is stretched, as evidenced by a price-to-book ratio of 9.34, while profitability and efficiency scores remain very unfavorable. These factors combine to create a risky profile for investors.
Our Final Verdict about CoreWeave, Inc. Class A Common Stock
Despite some operational strengths, CoreWeave’s solvency risk, highlighted by its distress zone Altman Z-Score of 0.52, renders the investment highly speculative. The company’s weak financial health and looming bankruptcy risk make it too risky for conservative capital, regardless of its recent bullish price trend and buyer dominance. Caution is paramount before considering exposure.
Disclaimer: This content is for informational purposes only and does not constitute financial, investment, or other professional advice. Investing in financial markets involves a significant risk of loss, and past performance is not indicative of future results.
Additional Resources
- NVIDIA and CoreWeave Strengthen Collaboration to Accelerate Buildout of AI Factories – CoreWeave (Jan 26, 2026)
- Is CoreWeave (CRWV) Stock a Buy Ahead of Earnings February 26? – MEXC (Feb 25, 2026)
- Coreweave CDO McBee sells $504,977 in class a common stock By Investing.com – Investing.com South Africa (Feb 20, 2026)
- What’s Going On With CoreWeave Stock On Friday? – Benzinga (Feb 20, 2026)
- AI for investors – MLQ.ai (Feb 21, 2026)
For more information about CoreWeave, Inc. Class A Common Stock, please visit the official website: coreweave.com