In the evolving landscape of technology, UiPath Inc. (PATH) and ServiceTitan, Inc. (TTAN) stand out as innovators in software solutions. UiPath leads in robotic process automation, streamlining complex workflows with AI-driven tools, while ServiceTitan revolutionizes field service management for residential and commercial infrastructure. Both companies target efficiency through technology, making their comparison crucial for investors seeking growth in the software sector. Let’s explore which company offers the most compelling investment opportunity.
Table of contents
Companies Overview
I will begin the comparison between UiPath and ServiceTitan by providing an overview of these two companies and their main differences.
UiPath Overview
UiPath Inc. specializes in robotic process automation (RPA) software, delivering an end-to-end automation platform that integrates AI, low-code development, and centralized management tools. Founded in 2005 and based in New York City, UiPath serves industries such as banking, healthcare, and government, with a workforce of 3,868 employees and a market cap of approximately 8.5B USD.
ServiceTitan Overview
ServiceTitan, Inc. focuses on software solutions for field service management, helping to install, maintain, and service infrastructure in residential and commercial buildings. Established in 2008 and headquartered in Glendale, CA, it employs around 3,049 people and holds a market cap near 9.5B USD, trading on the NASDAQ Global Select market.
Key similarities and differences
Both companies operate in the technology sector but target different software niches: UiPath in infrastructure automation with AI-driven RPA, and ServiceTitan in application software for field service operations. Each has a similar workforce size and market capitalization, yet UiPath’s business emphasizes automation across various industries, while ServiceTitan concentrates on field service activity management.
Income Statement Comparison
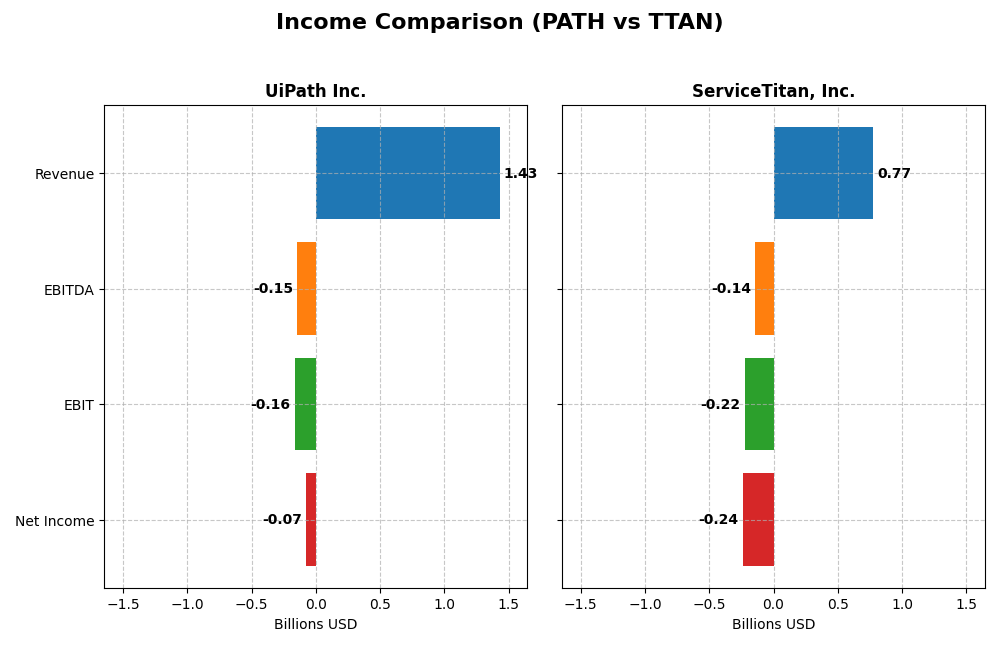
The table below presents a side-by-side comparison of the key income statement metrics for UiPath Inc. and ServiceTitan, Inc. for their most recent fiscal year.
| Metric | UiPath Inc. (PATH) | ServiceTitan, Inc. (TTAN) |
|---|---|---|
| Market Cap | 8.5B | 9.5B |
| Revenue | 1.43B | 772M |
| EBITDA | -145M | -141M |
| EBIT | -163M | -221M |
| Net Income | -74M | -239M |
| EPS | -0.13 | -8.53 |
| Fiscal Year | 2025 | 2025 |
Income Statement Interpretations
UiPath Inc.
UiPath has shown consistent revenue growth from 607M in 2021 to nearly 1.43B in 2025, with net income losses narrowing from -525M in 2022 to -74M in 2025. Its gross margin remains strong at 82.73%, while EBIT margin is negative but slightly improving. The latest year shows a favorable 9.3% revenue rise and a 25% net margin improvement, signaling stabilizing profitability.
ServiceTitan, Inc.
ServiceTitan’s revenue increased from 468M in 2023 to 772M in 2025, reflecting strong growth, but net losses remain substantial, with -240M in 2025. Gross margin is solid at 64.9%, yet EBIT and net margins are deeply negative at -28.67% and -30.98%. The latest year saw robust revenue and gross profit growth but deteriorating EBIT and EPS, indicating margin pressure despite sales gains.
Which one has the stronger fundamentals?
UiPath demonstrates stronger fundamentals with higher gross margins, improving net margins, and consistent revenue and net income growth over five years. ServiceTitan, while growing revenue rapidly, faces deeper losses and margin challenges, especially in EBIT and EPS. Overall, UiPath’s income statement reflects a more favorable balance of growth and margin improvement, suggesting comparatively stronger financial health.
Financial Ratios Comparison
Below is a comparison of key financial ratios for UiPath Inc. and ServiceTitan, Inc. for their latest fiscal year ending January 31, 2025.
| Ratios | UiPath Inc. (PATH) | ServiceTitan, Inc. (TTAN) |
|---|---|---|
| ROE | -3.99% | -16.44% |
| ROIC | -7.41% | -14.25% |
| P/E | -108.0 | -18.1 |
| P/B | 4.31 | 2.98 |
| Current Ratio | 2.93 | 3.74 |
| Quick Ratio | 2.93 | 3.74 |
| D/E (Debt-to-Equity) | 0.042 | 0.114 |
| Debt-to-Assets | 2.72% | 9.35% |
| Interest Coverage | 0 | -14.82 |
| Asset Turnover | 0.50 | 0.44 |
| Fixed Asset Turnover | 14.41 | 9.57 |
| Payout ratio | 0 | 0 |
| Dividend yield | 0 | 0 |
Interpretation of the Ratios
UiPath Inc.
UiPath Inc. exhibits a mixed ratio profile with several unfavorable metrics, including a negative net margin of -5.15% and a return on equity of -3.99%, indicating profitability challenges. Favorable ratios include a strong current ratio of 2.93 and low debt levels, reflecting solid liquidity and conservative leverage. The company does not pay dividends, likely due to ongoing reinvestment in its automation platform and growth phase priorities.
ServiceTitan, Inc.
ServiceTitan, Inc. shows several weak ratios such as a net margin of -30.98% and a return on equity of -16.44%, suggesting significant losses. However, it benefits from a favorable weighted average cost of capital at 4.85% and low debt ratios, contributing to financial stability. The company also does not distribute dividends, presumably focusing on expanding its software application offerings and investing in research and development.
Which one has the best ratios?
Both UiPath Inc. and ServiceTitan, Inc. have a similar balance of favorable and unfavorable ratios, each with 42.86% favorable and 50% unfavorable metrics. UiPath shows stronger liquidity and lower debt, while ServiceTitan has a better cost of capital but more pronounced profitability issues. Overall, both companies present slightly unfavorable ratio profiles, reflecting risks in their current financial performance.
Strategic Positioning
This section compares the strategic positioning of UiPath Inc. and ServiceTitan, Inc. including Market position, Key segments, and disruption:
UiPath Inc.
- Established player in software infrastructure with competitive pressure from automation market leaders.
- Focuses on robotic process automation with revenues from licenses, subscription services, and professional services.
- Leverages AI and low-code automation tools; faces ongoing technological evolution in AI and automation space.
ServiceTitan, Inc.
- Operates in application software for field service with moderate competition in residential and commercial sectors.
- Generates revenue mainly from platform and subscription services targeting field service management.
- Relies on software platform innovation; exposed to disruption through evolving field service digital tools.
UiPath Inc. vs ServiceTitan, Inc. Positioning
UiPath’s strategy is diversified across automation software segments including licenses and subscriptions, supporting broad industry adoption. ServiceTitan concentrates on field service software, generating stable platform and subscription revenues but with narrower market focus. Each approach has distinct operational scopes and market pressures.
Which has the best competitive advantage?
Both companies are currently shedding value relative to their capital costs, with UiPath showing improving profitability trends, while ServiceTitan’s profitability remains stable but unfavorable. UiPath’s growing ROIC trend suggests a slightly better competitive advantage in value creation.
Stock Comparison
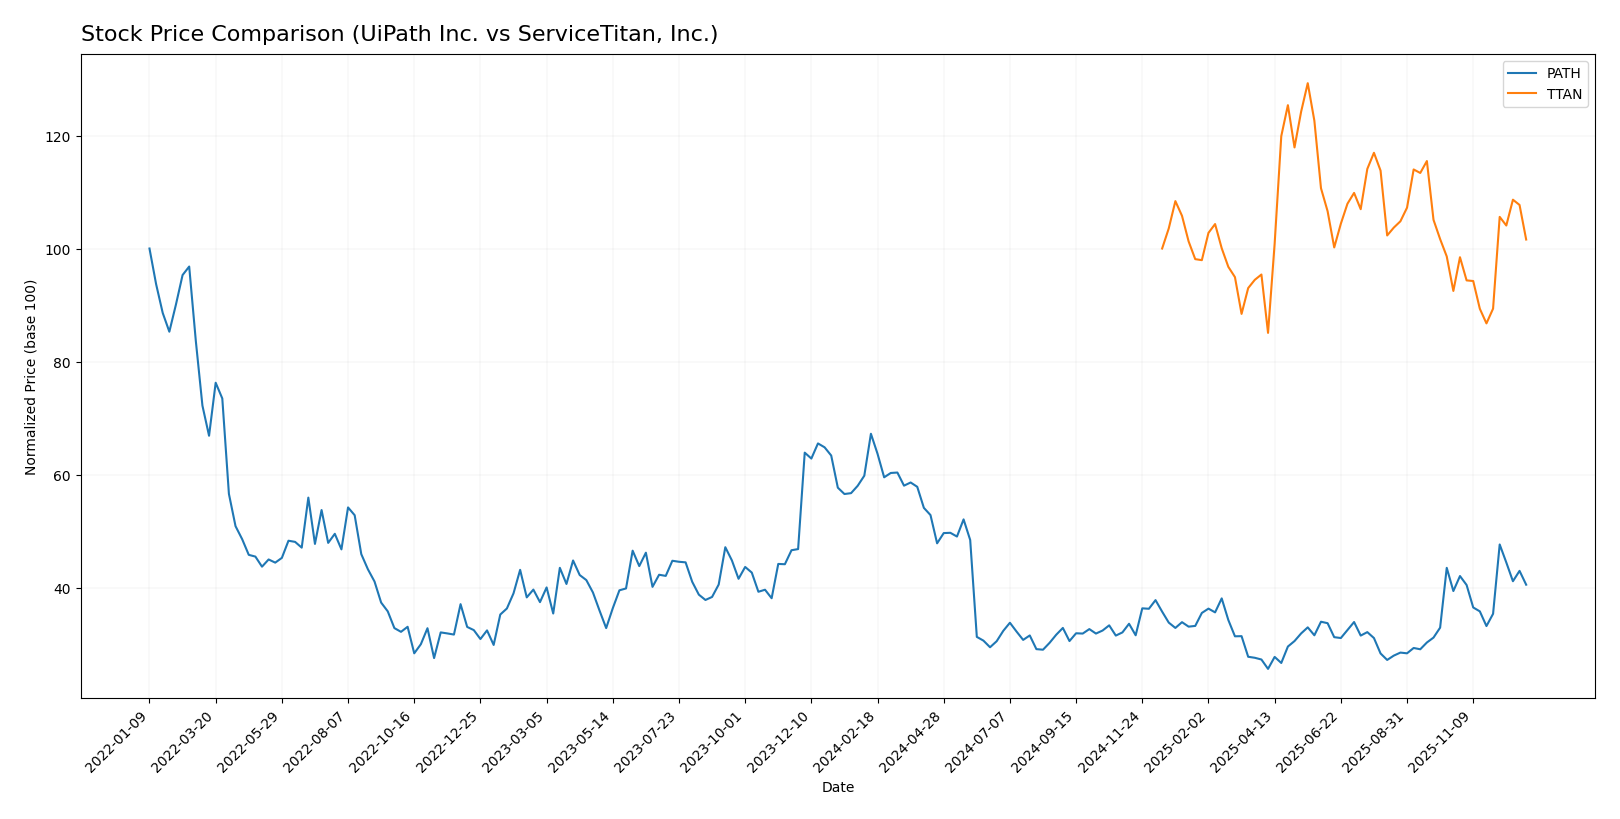
The stock price movements of UiPath Inc. and ServiceTitan, Inc. over the past 12 months reveal contrasting dynamics, with UiPath showing a significant decline and ServiceTitan maintaining relative stability with modest gains.
Trend Analysis
UiPath Inc. experienced a bearish trend with a price decrease of -39.73% over the past year, marked by acceleration and a volatility standard deviation of 3.69. The stock reached a high of 26.35 and a low of 10.04.
ServiceTitan, Inc. showed a neutral trend with a 1.59% price increase, also accelerating but with higher volatility (std deviation 9.85). Its price fluctuated between 85.07 and 129.26 during the same period.
Comparing the two, ServiceTitan delivered higher market performance, maintaining a near-neutral trend, while UiPath suffered a substantial decline over the last 12 months.
Target Prices
The current consensus target prices reflect moderate upside potential for both UiPath Inc. and ServiceTitan, Inc.
| Company | Target High | Target Low | Consensus |
|---|---|---|---|
| UiPath Inc. | 19 | 14 | 16.6 |
| ServiceTitan, Inc. | 145 | 125 | 135 |
Analysts expect UiPath’s stock to trade slightly above its current price of 15.88 USD, while ServiceTitan shows a significant potential gain compared to its current price of 101.59 USD.
Analyst Opinions Comparison
This section compares analysts’ ratings and grades for UiPath Inc. and ServiceTitan, Inc.:
Rating Comparison
UiPath Inc. Rating
- Rating: B+, indicating a very favorable overall assessment.
- Discounted Cash Flow Score: 3, a moderate indicator of valuation.
- ROE Score: 4, favorable efficiency in generating profit from equity.
- ROA Score: 4, favorable asset utilization to generate earnings.
- Debt To Equity Score: 4, favorable financial risk profile.
- Overall Score: 3, moderate summary score of financial standing.
ServiceTitan, Inc. Rating
- Rating: C-, reflecting a very unfavorable overall assessment.
- Discounted Cash Flow Score: 1, very unfavorable valuation metric.
- ROE Score: 1, very unfavorable efficiency in profit generation.
- ROA Score: 1, very unfavorable asset utilization.
- Debt To Equity Score: 3, moderate financial risk profile.
- Overall Score: 1, very unfavorable summary score.
Which one is the best rated?
Based strictly on the provided data, UiPath Inc. holds a significantly better rating than ServiceTitan, Inc., with higher scores across all key financial metrics except for a slightly better debt-to-equity score for UiPath.
Scores Comparison
Here is a comparison of the financial scores for UiPath Inc. and ServiceTitan, Inc.:
UiPath Inc. Scores
- Altman Z-Score: 6.53, indicating a safe financial zone with low bankruptcy risk.
- Piotroski Score: 7, categorized as strong financial health based on profitability and efficiency.
ServiceTitan, Inc. Scores
- Altman Z-Score: 19.00, indicating a safe financial zone with very low bankruptcy risk.
- Piotroski Score: 6, categorized as average financial health based on profitability and efficiency.
Which company has the best scores?
ServiceTitan has a significantly higher Altman Z-Score, indicating stronger financial stability, while UiPath has a higher Piotroski Score, suggesting better financial strength. The scores reflect differing strengths in financial health.
Grades Comparison
The following section compares the recent grades assigned to UiPath Inc. and ServiceTitan, Inc. by reputable grading companies:
UiPath Inc. Grades
This table shows the latest grades from multiple established grading companies for UiPath Inc.
| Grading Company | Action | New Grade | Date |
|---|---|---|---|
| RBC Capital | Maintain | Sector Perform | 2025-12-10 |
| Morgan Stanley | Maintain | Equal Weight | 2025-12-09 |
| DA Davidson | Maintain | Neutral | 2025-12-05 |
| BMO Capital | Maintain | Market Perform | 2025-12-04 |
| RBC Capital | Maintain | Sector Perform | 2025-12-04 |
| Mizuho | Maintain | Neutral | 2025-12-04 |
| Canaccord Genuity | Maintain | Buy | 2025-12-04 |
| Wells Fargo | Maintain | Equal Weight | 2025-12-04 |
| Evercore ISI Group | Maintain | In Line | 2025-12-04 |
| Barclays | Maintain | Equal Weight | 2025-12-04 |
UiPath’s grades mostly range from Neutral to Sector Perform, with a single Buy rating, indicating a generally cautious but stable outlook.
ServiceTitan, Inc. Grades
This table presents the most recent grades from well-known grading firms for ServiceTitan, Inc.
| Grading Company | Action | New Grade | Date |
|---|---|---|---|
| TD Cowen | Maintain | Buy | 2025-12-05 |
| Piper Sandler | Maintain | Overweight | 2025-12-05 |
| BMO Capital | Maintain | Outperform | 2025-12-05 |
| Morgan Stanley | Maintain | Equal Weight | 2025-12-05 |
| BMO Capital | Maintain | Outperform | 2025-11-20 |
| Piper Sandler | Maintain | Overweight | 2025-09-19 |
| Stifel | Maintain | Buy | 2025-09-19 |
| Wells Fargo | Maintain | Overweight | 2025-09-19 |
| Canaccord Genuity | Maintain | Buy | 2025-09-19 |
| Citigroup | Maintain | Neutral | 2025-09-09 |
ServiceTitan’s ratings predominantly reflect positive sentiment, with multiple Buy, Outperform, and Overweight grades, suggesting a stronger bullish consensus.
Which company has the best grades?
ServiceTitan, Inc. has received notably more favorable grades compared to UiPath Inc., with several Buy and Outperform ratings versus mostly Neutral and Sector Perform for UiPath. This difference may influence investor sentiment by highlighting ServiceTitan’s perceived stronger growth prospects.
Strengths and Weaknesses
Below is a comparison table highlighting key strengths and weaknesses of UiPath Inc. (PATH) and ServiceTitan, Inc. (TTAN) based on the most recent financial and operational data:
| Criterion | UiPath Inc. (PATH) | ServiceTitan, Inc. (TTAN) |
|---|---|---|
| Diversification | Revenue spread across License (587M), Subscription Services (802M), and Professional Services (71M) | Revenue mainly from Platform (739M) and Subscription (566M) services |
| Profitability | Negative net margin (-5.15%) and ROIC (-7.41%); shedding value but improving ROIC trend (+65%) | More negative profitability with net margin (-30.98%) and ROIC (-14.25%); stable ROIC trend (~0.76%) |
| Innovation | Strong growth in ROIC suggests improving operational efficiency and innovation efforts | Neutral ROIC trend indicates limited recent improvement in profitability or innovation impact |
| Global presence | Not explicitly detailed but implied by significant license and subscription sales | Similarly unclear but likely focused on North American markets given product focus |
| Market Share | Large subscription revenue implies solid market penetration in automation segment | Strong platform revenue suggests good market position in service management software |
Key takeaways: Both companies are currently unprofitable and shedding value, but UiPath shows a promising upward trend in profitability, suggesting better operational improvements and innovation potential. ServiceTitan, while stable, faces greater profitability challenges. Investors should weigh UiPath’s improving fundamentals against ServiceTitan’s steadier yet weaker financial profile.
Risk Analysis
The following table summarizes key risks for UiPath Inc. (PATH) and ServiceTitan, Inc. (TTAN) based on their latest financial and operational data from 2025.
| Metric | UiPath Inc. (PATH) | ServiceTitan, Inc. (TTAN) |
|---|---|---|
| Market Risk | Moderate (Beta 1.1) | Moderate (Beta -0.85) |
| Debt level | Low (Debt/Equity 0.04) | Low (Debt/Equity 0.11) |
| Regulatory Risk | Moderate (Tech sector exposure) | Moderate (Tech & service sector) |
| Operational Risk | Moderate (negative margins) | High (net margin -31%) |
| Environmental Risk | Low (Software company) | Low (Service software focus) |
| Geopolitical Risk | Moderate (US, Japan, Romania) | Moderate (US focused) |
UiPath faces operational risks due to negative profitability but benefits from low debt and sound liquidity. ServiceTitan has higher operational risks with deeper losses and weaker liquidity ratios. Both companies have moderate market and geopolitical risks typical of tech firms operating in multiple regions. Caution is advised, particularly with ServiceTitan’s financial sustainability.
Which Stock to Choose?
UiPath Inc. shows a favorable income statement with 78.57% positive metrics and a revenue growth of 135.28% over 2021-2025. Despite slightly unfavorable financial ratios and negative profitability, its low debt and a solid B+ rating indicate improving financial health.
ServiceTitan, Inc. reports a favorable income statement at 50% favorable metrics and strong revenue growth of 65.02% over 2023-2025. However, it displays slightly unfavorable financial ratios, significant negative profitability, and a lower C- rating, reflecting ongoing challenges in operational efficiency.
For investors, UiPath might appear more attractive for growth-oriented profiles due to stronger income growth and a higher rating, while ServiceTitan could appeal to those seeking potential value from a company with recent revenue momentum but higher risk. The final consideration depends on individual risk tolerance and investment strategy.
Disclaimer: Investment carries a risk of loss of initial capital. The past performance is not a reliable indicator of future results. Be sure to understand risks before making an investment decision.
Go Further
I encourage you to read the complete analyses of UiPath Inc. and ServiceTitan, Inc. to enhance your investment decisions: