Workday, Inc. and The Trade Desk, Inc. are two prominent players in the software application industry, each innovating in distinct yet overlapping markets. Workday focuses on enterprise cloud solutions for financial and human capital management, while The Trade Desk leads in data-driven digital advertising platforms. Comparing these companies reveals contrasting growth strategies and market potentials. Join me as we analyze which stock presents the most compelling investment opportunity today.

Table of contents
Companies Overview
I will begin the comparison between Workday, Inc. and The Trade Desk, Inc. by providing an overview of these two companies and their main differences.
Workday Overview
Workday, Inc. offers enterprise cloud applications focused on financial management, human capital management, and analytics. Its software helps organizations plan, execute, and analyze business operations, serving various sectors including healthcare, finance, education, and retail. Headquartered in Pleasanton, California, Workday has positioned itself as a leading provider of integrated cloud solutions for business operations and workforce management.
The Trade Desk Overview
The Trade Desk, Inc. operates a cloud-based platform that enables buyers to create and manage digital advertising campaigns across multiple formats and devices. Serving advertising agencies globally, the company focuses on data-driven ad optimization and value-added services. Based in Ventura, California, The Trade Desk has established itself as a key player in programmatic advertising technology, supporting diverse media channels like video, audio, and connected TV.
Key similarities and differences
Both Workday and The Trade Desk operate in the technology sector and provide cloud-based software solutions, targeting enterprise customers worldwide. However, Workday specializes in business and human capital management software, while The Trade Desk focuses exclusively on programmatic digital advertising platforms. Their business models differ in application scope but share reliance on data analytics and cloud technology to enhance operational efficiency and customer outcomes.
Income Statement Comparison
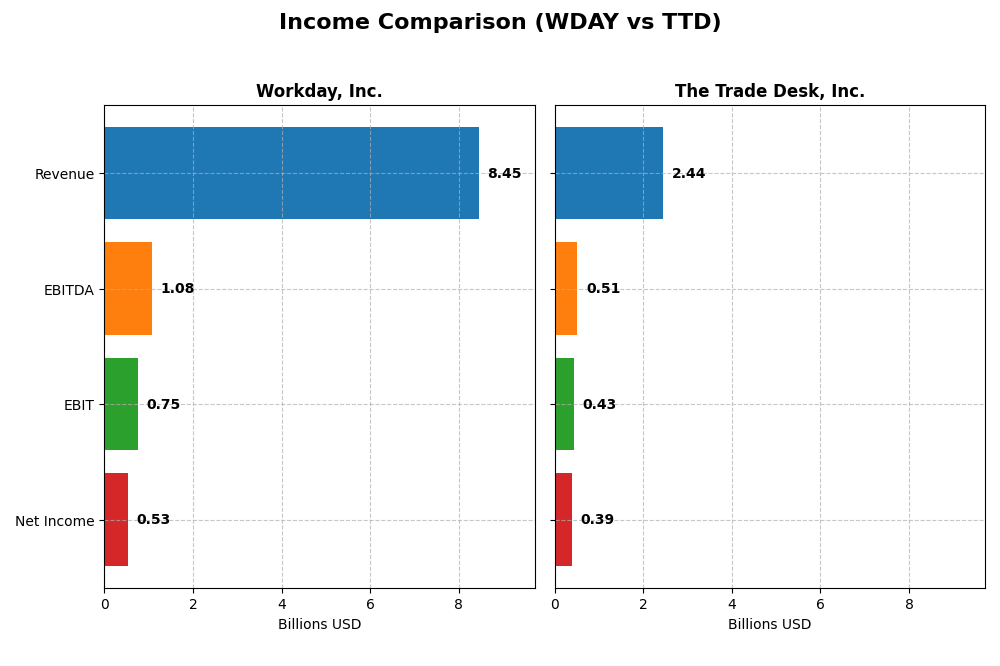
The table below presents a side-by-side comparison of key income statement metrics for Workday, Inc. and The Trade Desk, Inc. for their most recent fiscal years.
| Metric | Workday, Inc. (WDAY) | The Trade Desk, Inc. (TTD) |
|---|---|---|
| Market Cap | 49.9B | 17.3B |
| Revenue | 8.45B | 2.44B |
| EBITDA | 1.08B | 515M |
| EBIT | 752M | 427M |
| Net Income | 526M | 393M |
| EPS | 1.98 | 0.80 |
| Fiscal Year | 2025 | 2024 |
Income Statement Interpretations
Workday, Inc.
Workday’s revenue nearly doubled from 2021 to 2025, reaching $8.45B in 2025, with net income rising substantially overall to $526M after a prior dip. Gross margin remained strong at 75.5%, while EBIT margin was stable at 8.9%. Despite a 16.4% revenue growth in 2025, net margin and EPS declined sharply, indicating margin pressures last year.
The Trade Desk, Inc.
The Trade Desk showed robust revenue growth from $837M in 2020 to $2.44B in 2024, with net income increasing to $393M. Margins improved favorably, with gross margin at 80.7% and EBIT margin at 17.5%. The latest year’s revenue surged 25.6%, accompanied by strong net margin and EPS expansion, reflecting improved profitability and operational leverage.
Which one has the stronger fundamentals?
Both companies demonstrate favorable income statement trends with solid revenue growth and profitability. The Trade Desk exhibits higher and improving margins, stronger recent net margin growth, and better EPS growth. Workday shows impressive long-term revenue and net income gains but faced recent margin contractions. Overall, The Trade Desk’s income statement fundamentals appear more robust in the latest fiscal year.
Financial Ratios Comparison
The following table presents a side-by-side comparison of key financial ratios for Workday, Inc. (WDAY) and The Trade Desk, Inc. (TTD) based on their most recent fiscal year data.
| Ratios | Workday, Inc. (WDAY) FY 2025 | The Trade Desk, Inc. (TTD) FY 2024 |
|---|---|---|
| ROE | 5.82% | 13.33% |
| ROIC | 2.73% | 10.02% |
| P/E | 132.15 | 146.77 |
| P/B | 7.69 | 19.56 |
| Current Ratio | 1.85 | 1.86 |
| Quick Ratio | 1.85 | 1.86 |
| D/E (Debt-to-Equity) | 0.37 | 0.11 |
| Debt-to-Assets | 18.70% | 5.11% |
| Interest Coverage | 3.64 | 0 (not reported) |
| Asset Turnover | 0.47 | 0.40 |
| Fixed Asset Turnover | 5.36 | 5.17 |
| Payout Ratio | 0 | 0 |
| Dividend Yield | 0 | 0 |
Interpretation of the Ratios
Workday, Inc.
Workday’s ratios present a mixed picture with 43% favorable and 43% unfavorable indicators. The company shows strengths in liquidity with a current ratio of 1.85 and low debt levels, but weak returns on equity and invested capital, along with high valuation multiples, raise concerns. Workday does not pay dividends, likely reflecting reinvestment in growth and R&D priorities.
The Trade Desk, Inc.
The Trade Desk exhibits a more favorable ratio profile, with 57% favorable metrics including strong net margin of 16.08% and solid returns on invested capital at 10.02%. Liquidity and leverage ratios also appear robust. Despite a high price-to-earnings ratio, The Trade Desk does not pay dividends, consistent with a growth-oriented strategy that emphasizes reinvestment over shareholder distributions.
Which one has the best ratios?
The Trade Desk holds an edge with a higher proportion of favorable ratios and stronger profitability metrics, while Workday shows balanced but weaker returns and valuation concerns. Both companies avoid dividends, focusing on growth investments, but The Trade Desk’s financial health and returns suggest a more favorable ratio set overall.
Strategic Positioning
This section compares the strategic positioning of Workday, Inc. and The Trade Desk, Inc., including market position, key segments, and exposure to technological disruption:
Workday, Inc.
- Large market cap of $49.9B, faces competitive pressure in enterprise cloud software.
- Focus on subscription services and professional services mainly in enterprise cloud applications and HCM.
- Exposure to disruption through cloud applications and machine learning integration in business management.
The Trade Desk, Inc.
- Smaller market cap $17.3B, competes in digital advertising technology.
- Focuses on self-service cloud platform for data-driven digital advertising campaigns.
- Faces disruption risks in digital ad formats and emerging channels like connected TV.
Workday, Inc. vs The Trade Desk, Inc. Positioning
Workday is diversified across enterprise cloud applications and professional services, benefiting from a broad industry base; The Trade Desk is more concentrated in digital advertising technology, focusing on programmatic ad management and data services.
Which has the best competitive advantage?
Both companies have a slightly unfavorable MOAT status; Workday shows growing profitability despite value destruction, while The Trade Desk has declining profitability and does not yet create value, indicating cautious competitive advantage for Workday.
Stock Comparison
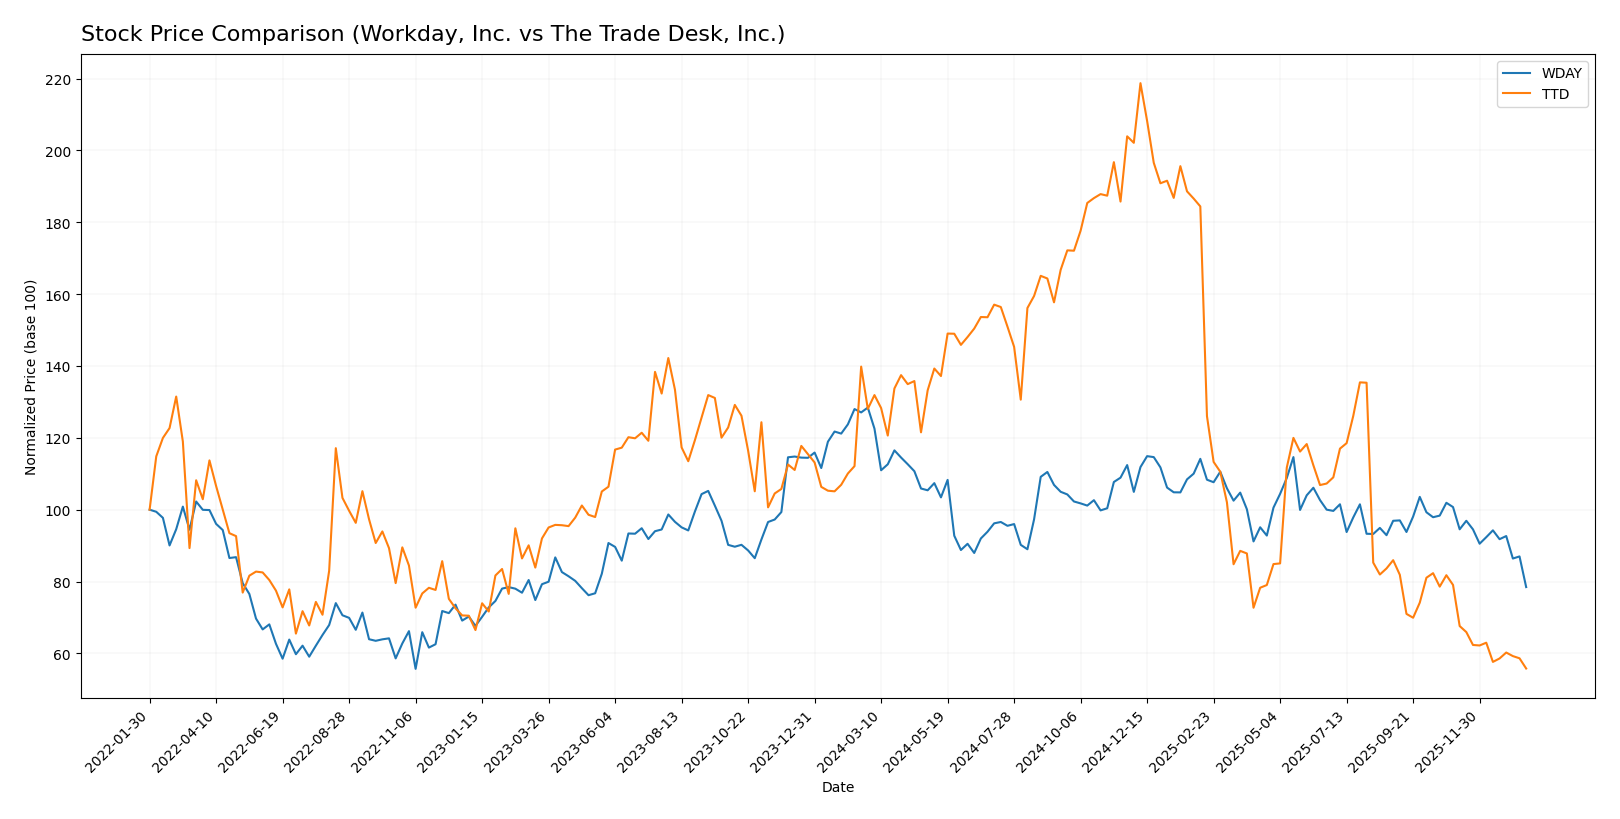
The stock price movements of Workday, Inc. (WDAY) and The Trade Desk, Inc. (TTD) over the past year reveal sustained bearish trends with significant declines and decelerating momentum in both cases.
Trend Analysis
Workday, Inc. experienced a bearish trend over the past 12 months with a price decline of 38.91%, showing deceleration and a high volatility level at a 20.22 standard deviation. The stock peaked at 305.88 and troughed at 186.86.
The Trade Desk, Inc. showed a more pronounced bearish trend with a 56.43% price drop in the same period, accompanied by deceleration and even higher volatility at 28.36 standard deviation. Its highest and lowest prices were 139.11 and 35.48, respectively.
Comparing the two, Workday, Inc. delivered a less severe market performance decline than The Trade Desk, Inc., indicating relatively better resilience despite both stocks trending downward.
Target Prices
The current analyst consensus suggests notable upside potential for both Workday, Inc. and The Trade Desk, Inc.
| Company | Target High | Target Low | Consensus |
|---|---|---|---|
| Workday, Inc. | 320 | 235 | 274.47 |
| The Trade Desk, Inc. | 98 | 39 | 56.73 |
Analysts expect Workday’s share price to rise significantly above its current 186.86 USD, while The Trade Desk shows potential to increase from 35.48 USD, reflecting generally optimistic market sentiment.
Analyst Opinions Comparison
This section compares analysts’ ratings and grades for Workday, Inc. and The Trade Desk, Inc.:
Rating Comparison
WDAY Rating
- Rating: B- indicating a very favorable overall status.
- Discounted Cash Flow Score: 4, favorable valuation.
- ROE Score: 3, moderate efficiency in generating profit.
- ROA Score: 3, moderate asset utilization.
- Debt To Equity Score: 2, moderate financial risk.
- Overall Score: 2, moderate overall financial standing.
TTD Rating
- Rating: B indicating a very favorable overall status.
- Discounted Cash Flow Score: 4, favorable valuation.
- ROE Score: 4, favorable efficiency in generating profit.
- ROA Score: 4, favorable asset utilization.
- Debt To Equity Score: 3, moderate financial risk.
- Overall Score: 3, moderate overall financial standing.
Which one is the best rated?
Based on the data, The Trade Desk holds higher ratings in ROE, ROA, and overall score compared to Workday, while both have equal discounted cash flow scores. Overall, The Trade Desk is better rated strictly by these metrics.
Scores Comparison
Here is a comparison of the financial scores for Workday, Inc. and The Trade Desk, Inc.:
WDAY Scores
- Altman Z-Score: 4.41, indicating a safe zone with low bankruptcy risk.
- Piotroski Score: 6, classified as average financial strength.
TTD Scores
- Altman Z-Score: 4.30, indicating a safe zone with low bankruptcy risk.
- Piotroski Score: 5, classified as average financial strength.
Which company has the best scores?
Both companies have Altman Z-Scores in the safe zone, showing low bankruptcy risk. Workday has a slightly higher Altman score and Piotroski score, indicating marginally better financial strength based on the data provided.
Grades Comparison
The following is a comparison of recent grades assigned to Workday, Inc. and The Trade Desk, Inc.:
Workday, Inc. Grades
This table summarizes recent grades from established financial institutions for Workday, Inc.:
| Grading Company | Action | New Grade | Date |
|---|---|---|---|
| Barclays | Maintain | Overweight | 2026-01-12 |
| RBC Capital | Maintain | Outperform | 2026-01-05 |
| TD Cowen | Maintain | Buy | 2025-11-26 |
| DA Davidson | Maintain | Neutral | 2025-11-26 |
| Wells Fargo | Maintain | Overweight | 2025-11-26 |
| Barclays | Maintain | Overweight | 2025-11-26 |
| Keybanc | Maintain | Overweight | 2025-11-26 |
| Citigroup | Maintain | Neutral | 2025-11-26 |
| JP Morgan | Maintain | Overweight | 2025-11-26 |
| UBS | Maintain | Neutral | 2025-11-26 |
The overall grading trend for Workday, Inc. is positive, with a majority of “Overweight,” “Buy,” and “Outperform” ratings maintained across reputable firms.
The Trade Desk, Inc. Grades
This table summarizes recent grades from established financial institutions for The Trade Desk, Inc.:
| Grading Company | Action | New Grade | Date |
|---|---|---|---|
| Morgan Stanley | Maintain | Equal Weight | 2026-01-13 |
| Wells Fargo | Maintain | Equal Weight | 2026-01-12 |
| Cantor Fitzgerald | Maintain | Neutral | 2026-01-08 |
| Wolfe Research | Maintain | Outperform | 2026-01-06 |
| Guggenheim | Maintain | Buy | 2026-01-05 |
| Jefferies | Maintain | Hold | 2025-12-11 |
| Wedbush | Maintain | Neutral | 2025-12-08 |
| DA Davidson | Maintain | Buy | 2025-11-10 |
| Truist Securities | Maintain | Buy | 2025-11-07 |
| Wells Fargo | Maintain | Equal Weight | 2025-11-07 |
The Trade Desk, Inc.’s grades show a mixed but generally moderate outlook, with several “Buy” ratings balanced by “Equal Weight,” “Hold,” and “Neutral” assessments.
Which company has the best grades?
Workday, Inc. has received stronger and more consistent buy-side grades than The Trade Desk, Inc., which displays a broader spread including more neutral and hold ratings. This difference may indicate greater analyst confidence in Workday’s near-term prospects, potentially influencing investor sentiment and portfolio positioning.
Strengths and Weaknesses
Below is a comparison of key strengths and weaknesses for Workday, Inc. (WDAY) and The Trade Desk, Inc. (TTD) based on the most recent financial and operational data.
| Criterion | Workday, Inc. (WDAY) | The Trade Desk, Inc. (TTD) |
|---|---|---|
| Diversification | Primarily subscription services with growing professional services segment; moderate diversification | Focused on digital advertising platform; less diversified product range |
| Profitability | Net margin 6.23% (neutral), ROIC 2.73% (unfavorable); currently shedding value but improving ROIC trend | Net margin 16.08% (favorable), ROIC 10.02% (favorable); still shedding value but profitability declining |
| Innovation | Strong growth in subscription revenues suggests ongoing innovation in SaaS offerings | Leading-edge advertising technology but facing margin pressure and valuation concerns |
| Global presence | Established global SaaS footprint with expanding service revenue | Global digital advertising reach, but niche market exposure |
| Market Share | Large in enterprise HCM and finance cloud market | Significant share in programmatic advertising but highly competitive |
Key takeaways: Workday shows improving profitability trends despite current value destruction, supported by strong subscription growth and solid balance sheet metrics. The Trade Desk delivers higher profitability but faces declining returns and valuation challenges. Both require cautious consideration with attention to evolving market dynamics.
Risk Analysis
Below is a comparison of key risk factors for Workday, Inc. (WDAY) and The Trade Desk, Inc. (TTD) based on the most recent data available in 2026:
| Metric | Workday, Inc. (WDAY) | The Trade Desk, Inc. (TTD) |
|---|---|---|
| Market Risk | Beta 1.14; moderate market volatility exposure | Beta 1.11; moderate market volatility exposure |
| Debt level | Debt-to-Equity 0.37; moderate, manageable leverage | Debt-to-Equity 0.11; low leverage, strong balance sheet |
| Regulatory Risk | Moderate; operates globally with data/privacy regulations | Moderate; advertising data privacy regulations impact business |
| Operational Risk | Medium; complex cloud software platform with integration needs | Medium; reliance on advertising platforms and data accuracy |
| Environmental Risk | Low; primarily software, limited direct environmental impact | Low; technology platform with minimal environmental footprint |
| Geopolitical Risk | Moderate; global operations exposed to geopolitical uncertainties | Moderate; international ad market exposure to geopolitical shifts |
In synthesis, both companies face moderate market and regulatory risks typical of the tech sector. Workday’s higher leverage compared to The Trade Desk suggests slightly elevated financial risk, although both have favorable liquidity profiles. The most impactful risk for both remains regulatory changes around data privacy, which could affect operational models significantly. Investors should monitor regulatory developments and market volatility closely.
Which Stock to Choose?
Workday, Inc. (WDAY) has shown favorable income growth with a 16.35% revenue increase in 2025 and strong gross margin at 75.5%. Its financial ratios present a mixed picture: favorable liquidity and low debt, but unfavorable profitability metrics such as ROE (5.82%) and ROIC (2.73%) below WACC. The company’s rating is very favorable (B-), supported by a safe Altman Z-Score (4.41) and average Piotroski score (6).
The Trade Desk, Inc. (TTD) reported a higher 25.63% revenue growth for 2024 and a strong gross margin of 80.7%. Its financial ratios are mostly favorable, including better ROE (13.33%) and ROIC (10.02%), with a low debt-to-equity ratio. TTD holds a very favorable rating (B) with a safe Altman Z-Score (4.30) and an average Piotroski score (5). However, its ROIC shows a declining trend.
For investors seeking growth, TTD’s stronger profitability and favorable financial ratios may appear more attractive, while risk-averse investors might find WDAY’s improving income and stable financial health more reassuring. The ratings and income evaluations suggest both have strengths, with TTD slightly favored for performance and WDAY for financial stability.
Disclaimer: Investment carries a risk of loss of initial capital. The past performance is not a reliable indicator of future results. Be sure to understand risks before making an investment decision.
Go Further
I encourage you to read the complete analyses of Workday, Inc. and The Trade Desk, Inc. to enhance your investment decisions: