Unity Software Inc. and The Trade Desk, Inc. are two dynamic players in the software application sector, each driving innovation in digital experiences and advertising technology. Unity specializes in real-time 3D content creation, while The Trade Desk excels in data-driven digital advertising platforms. Their complementary yet competitive approaches make them compelling candidates for investors seeking exposure to cutting-edge tech. In this article, I will help you identify which company presents the most attractive opportunity for your investment portfolio.
Table of contents
Companies Overview
I will begin the comparison between Unity Software Inc. and The Trade Desk, Inc. by providing an overview of these two companies and their main differences.
Unity Software Inc. Overview
Unity Software Inc. develops and operates an interactive real-time 3D content platform. Its platform enables users to create, run, and monetize 2D and 3D content across mobile, PC, consoles, and AR/VR devices. Unity serves content creators, developers, artists, and engineers globally, offering software solutions through various sales channels. Established in 2004, Unity is headquartered in San Francisco and operates within the technology sector.
The Trade Desk, Inc. Overview
The Trade Desk, Inc. provides a self-service cloud-based platform for managing data-driven digital advertising campaigns across multiple formats and devices. The company targets advertising agencies and service providers, offering tools for campaign creation, optimization, and data services. Founded in 2009 and based in Ventura, California, The Trade Desk operates in the technology sector with a global presence focused on digital advertising solutions.
Key similarities and differences
Both Unity and The Trade Desk operate in the technology sector and provide software application solutions, serving global markets. Unity focuses on interactive real-time 3D content creation across various devices, while The Trade Desk specializes in digital advertising campaign management via a cloud platform. Unity’s business centers on content development tools, whereas The Trade Desk emphasizes data-driven marketing optimization and cross-channel advertising.
Income Statement Comparison
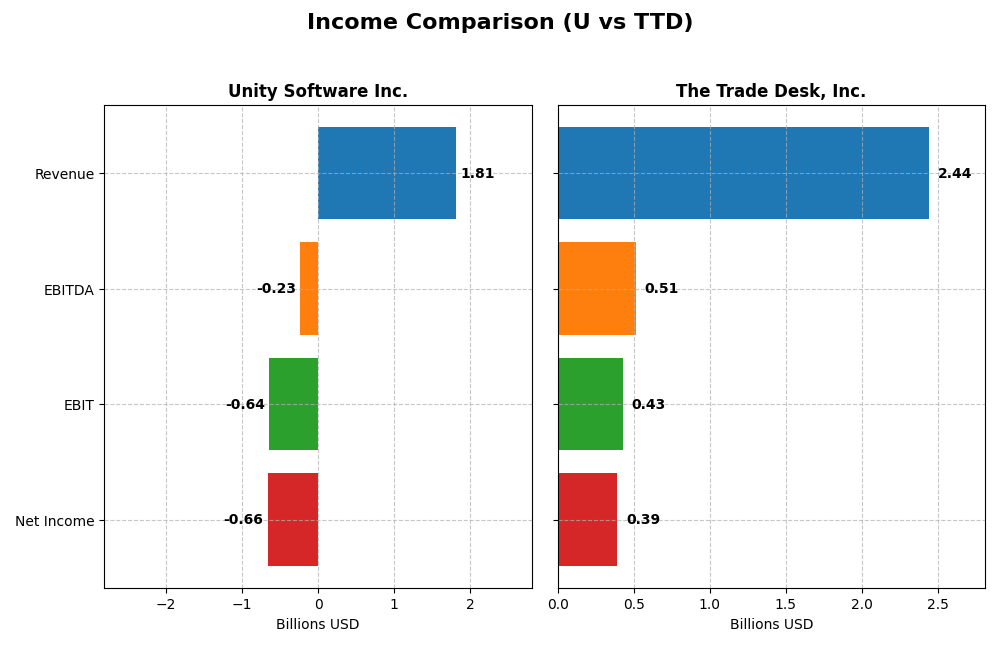
Below is a side-by-side comparison of key income statement metrics for Unity Software Inc. and The Trade Desk, Inc. based on their most recent fiscal year data.
| Metric | Unity Software Inc. | The Trade Desk, Inc. |
|---|---|---|
| Market Cap | 17.5B | 17.3B |
| Revenue | 1.81B | 2.44B |
| EBITDA | -235M | 515M |
| EBIT | -644M | 427M |
| Net Income | -664M | 393M |
| EPS | -1.68 | 0.80 |
| Fiscal Year | 2024 | 2024 |
Income Statement Interpretations
Unity Software Inc.
Unity Software’s revenue grew substantially by 135% over 2020-2024 but declined by 17.1% in 2024 alone. Despite a strong gross margin of 73.48%, the company reported negative EBIT and net margins of -35.49% and -36.63%, respectively. In 2024, EBIT improved by 16.77%, and EPS rose 22.22%, indicating some operational progress despite continued net losses.
The Trade Desk, Inc.
The Trade Desk showed robust revenue growth of 192% over five years and 25.63% in 2024. It maintained a high gross margin of 80.69% and delivered positive EBIT and net margins of 17.47% and 16.08%, respectively. In 2024, EBIT more than doubled by 113%, and net income surged 75%, reflecting strong margin expansion and profitability gains.
Which one has the stronger fundamentals?
The Trade Desk exhibits stronger fundamentals with predominantly favorable margin profiles, consistent profitability, and significant growth in revenue, EBIT, and net income. Unity Software, while growing revenue, struggles with persistent losses and negative margins despite some recent operational improvements. Trade Desk’s superior margin stability and positive net income mark a more favorable overall income statement performance.
Financial Ratios Comparison
The following table compares key financial ratios for Unity Software Inc. and The Trade Desk, Inc. based on their most recent fiscal year data for 2024.
| Ratios | Unity Software Inc. (U) | The Trade Desk, Inc. (TTD) |
|---|---|---|
| ROE | -20.8% | 13.3% |
| ROIC | -12.8% | 10.0% |
| P/E | -13.4 | 146.8 |
| P/B | 2.79 | 19.56 |
| Current Ratio | 2.50 | 1.86 |
| Quick Ratio | 2.50 | 1.86 |
| D/E (Debt-to-Equity) | 0.74 | 0.11 |
| Debt-to-Assets | 34.9% | 5.1% |
| Interest Coverage | -32.1 | 0 |
| Asset Turnover | 0.27 | 0.40 |
| Fixed Asset Turnover | 18.3 | 5.17 |
| Payout Ratio | 0 | 0 |
| Dividend Yield | 0 | 0 |
Interpretation of the Ratios
Unity Software Inc.
Unity Software Inc. shows a mixed ratio profile with 28.57% favorable and 50% unfavorable ratios, leading to a slightly unfavorable global opinion. Key concerns include negative net margin (-36.63%) and return on equity (-20.81%), alongside poor interest coverage (-27.34). Current and quick ratios at 2.5 are strong, indicating good liquidity. The company does not pay dividends, likely reflecting reinvestment in growth and R&D, supported by a high research and development expense ratio.
The Trade Desk, Inc.
The Trade Desk displays a favorable ratio profile with 57.14% favorable and 28.57% unfavorable ratios. Positive net margin (16.08%) and return on invested capital (10.02%) contrast with a high price-to-earnings ratio of 146.77 and price-to-book of 19.56, which may imply overvaluation risks. Liquidity ratios are solid, and debt levels are low. The Trade Desk also does not pay dividends, consistent with a focus on reinvestment and growth initiatives.
Which one has the best ratios?
The Trade Desk presents a more favorable overall ratio profile, with stronger profitability metrics and healthier debt management than Unity Software. While Unity shows better liquidity ratios, its negative profitability and coverage ratios weigh heavily. The Trade Desk’s elevated valuation multiples and some unfavorable asset turnover metrics may require caution, but its profitability and capital structure currently appear superior.
Strategic Positioning
This section compares the strategic positioning of Unity Software Inc. (U) and The Trade Desk, Inc. (TTD), focusing on market position, key segments, and exposure to technological disruption:
Unity Software Inc. (U)
- Leading software platform in real-time 3D content with high beta and NYSE listing.
- Key segments: Create Solutions and Operate Solutions driving revenue growth.
- Operates in a technology-driven space with emerging AR/VR but no explicit disruption data.
The Trade Desk, Inc. (TTD)
- Cloud-based digital advertising platform with lower beta, NASDAQ-listed.
- Focused on data-driven digital advertising campaign management for agencies.
- Exposure to adtech innovation with multi-format advertising across devices.
Unity Software Inc. vs The Trade Desk, Inc. Positioning
Unity offers a diversified platform serving multiple content creators with two main solution lines. The Trade Desk concentrates on optimizing digital advertising campaigns with a cloud-based platform. Unity’s broader product scope contrasts with The Trade Desk’s focused advertising service.
Which has the best competitive advantage?
Both companies show declining ROIC trends and are shedding value versus WACC, but Unity’s position is very unfavorable while The Trade Desk’s is slightly unfavorable, indicating The Trade Desk currently maintains a marginally better competitive advantage.
Stock Comparison
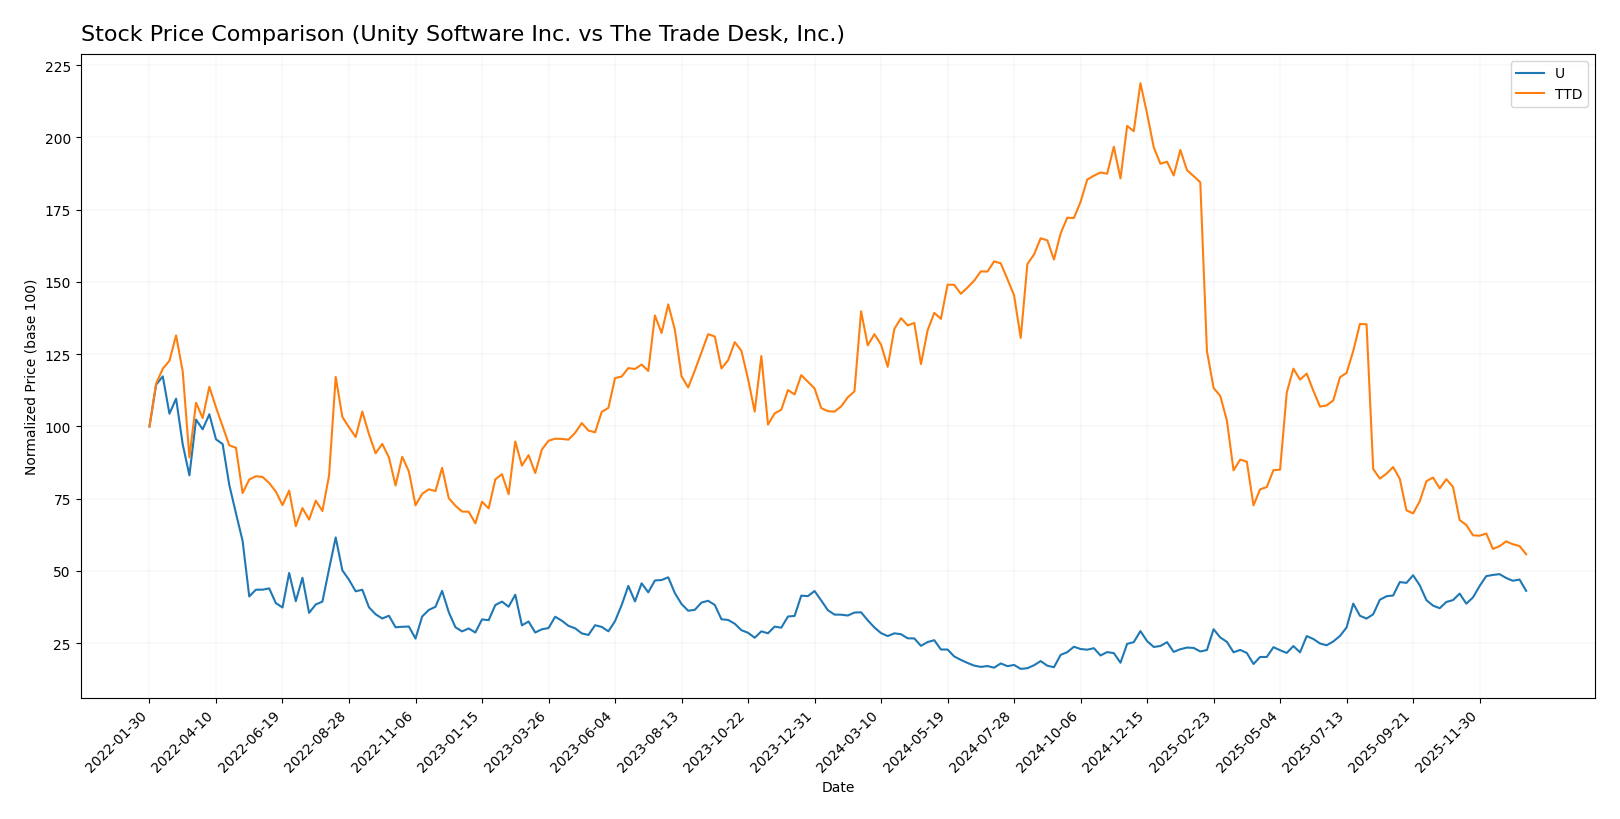
The stock price dynamics over the past 12 months reveal a strong bullish acceleration for Unity Software Inc., contrasted with a pronounced bearish deceleration for The Trade Desk, Inc.
Trend Analysis
Unity Software Inc. exhibited a 31.0% price increase over the past year, indicating a bullish trend with acceleration and moderate volatility (9.04 std deviation). Recent movement confirms continued positive momentum.
The Trade Desk, Inc. experienced a -56.43% price decline over the same period, reflecting a bearish trend with deceleration and high volatility (28.36 std deviation). Recent data show further weakening.
Comparing the two, Unity Software Inc. delivered substantially higher market performance, outperforming The Trade Desk, Inc.’s declining stock trend over the past 12 months.
Target Prices
The current analyst consensus presents a cautiously optimistic outlook for these technology firms.
| Company | Target High | Target Low | Consensus |
|---|---|---|---|
| Unity Software Inc. | 60 | 39 | 50.98 |
| The Trade Desk, Inc. | 98 | 39 | 56.73 |
Analysts expect both Unity Software and The Trade Desk to appreciate from current prices of $40.95 and $35.48, respectively, suggesting potential upside while acknowledging downside risks within their target ranges.
Analyst Opinions Comparison
This section compares analysts’ ratings and grades for Unity Software Inc. and The Trade Desk, Inc.:
Rating Comparison
Unity Software Inc. Rating
- Rating: D+, classified as very favorable overall rating.
- Discounted Cash Flow Score: 1, very unfavorable valuation.
- ROE Score: 1, very unfavorable return on equity.
- ROA Score: 1, very unfavorable return on assets.
- Debt To Equity Score: 1, very unfavorable financial risk.
- Overall Score: 1, very unfavorable overall financial health.
The Trade Desk, Inc. Rating
- Rating: B, classified as very favorable overall rating.
- Discounted Cash Flow Score: 4, favorable valuation.
- ROE Score: 4, favorable return on equity.
- ROA Score: 4, favorable return on assets.
- Debt To Equity Score: 3, moderate financial risk.
- Overall Score: 3, moderate overall financial health.
Which one is the best rated?
Based strictly on the provided data, The Trade Desk, Inc. is better rated than Unity Software Inc., showing higher scores in discounted cash flow, ROE, ROA, debt-to-equity, and overall financial health.
Scores Comparison
Here is a comparison of the financial health scores for Unity Software Inc. and The Trade Desk, Inc.:
Unity Software Inc. Scores
- Altman Z-Score: 2.93, indicating moderate bankruptcy risk in the grey zone.
- Piotroski Score: 4, assessed as average financial strength.
The Trade Desk, Inc. Scores
- Altman Z-Score: 4.30, indicating low bankruptcy risk in the safe zone.
- Piotroski Score: 5, assessed as average financial strength.
Which company has the best scores?
The Trade Desk, Inc. has a higher Altman Z-Score than Unity Software Inc., placing it in the safer zone against bankruptcy. Both companies show average Piotroski Scores, with The Trade Desk slightly higher at 5 versus 4.
Grades Comparison
Here is a comparison of the recent grades assigned to Unity Software Inc. and The Trade Desk, Inc.:
Unity Software Inc. Grades
This table presents recent grades and actions from reputable financial institutions for Unity Software Inc.
| Grading Company | Action | New Grade | Date |
|---|---|---|---|
| Morgan Stanley | Maintain | Overweight | 2026-01-13 |
| Goldman Sachs | Maintain | Neutral | 2026-01-13 |
| Wells Fargo | Maintain | Overweight | 2026-01-08 |
| Jefferies | Maintain | Buy | 2026-01-05 |
| Piper Sandler | Upgrade | Overweight | 2025-12-11 |
| BTIG | Upgrade | Buy | 2025-12-11 |
| Wells Fargo | Upgrade | Overweight | 2025-12-05 |
| Arete Research | Upgrade | Buy | 2025-12-01 |
| Citigroup | Maintain | Buy | 2025-11-11 |
| Wells Fargo | Maintain | Equal Weight | 2025-11-07 |
Unity Software shows a positive trend with multiple upgrades to Buy and Overweight, indicating growing analyst confidence.
The Trade Desk, Inc. Grades
This table summarizes recent grades and actions from recognized grading companies for The Trade Desk, Inc.
| Grading Company | Action | New Grade | Date |
|---|---|---|---|
| Morgan Stanley | Maintain | Equal Weight | 2026-01-13 |
| Wells Fargo | Maintain | Equal Weight | 2026-01-12 |
| Cantor Fitzgerald | Maintain | Neutral | 2026-01-08 |
| Wolfe Research | Maintain | Outperform | 2026-01-06 |
| Guggenheim | Maintain | Buy | 2026-01-05 |
| Jefferies | Maintain | Hold | 2025-12-11 |
| Wedbush | Maintain | Neutral | 2025-12-08 |
| DA Davidson | Maintain | Buy | 2025-11-10 |
| Truist Securities | Maintain | Buy | 2025-11-07 |
| Wells Fargo | Maintain | Equal Weight | 2025-11-07 |
The Trade Desk’s grades mostly cluster around Equal Weight and Neutral, with some Buy and Outperform ratings, reflecting a stable but less bullish stance.
Which company has the best grades?
Unity Software has received more frequent upgrades and a higher number of Buy and Overweight ratings compared to The Trade Desk, which mostly holds Neutral and Equal Weight grades. This suggests stronger analyst optimism for Unity, which could influence investor sentiment towards growth potential.
Strengths and Weaknesses
Below is a comparative overview of Unity Software Inc. (U) and The Trade Desk, Inc. (TTD) based on key financial and strategic criteria.
| Criterion | Unity Software Inc. (U) | The Trade Desk, Inc. (TTD) |
|---|---|---|
| Diversification | Moderate diversification in Create and Operate Solutions; revenue volatile with recent decline in Create Solutions | Focused on digital advertising technology; limited product diversification |
| Profitability | Negative net margin (-36.63%), negative ROIC (-12.78%), value destroying | Positive net margin (16.08%), favorable ROIC (10.02%), slightly unfavorable moat status |
| Innovation | Strong innovation in real-time 3D development but declining profitability challenges reinvestment | Innovative in programmatic advertising with solid technology platform |
| Global presence | Global reach in gaming and interactive media sectors | Global presence in digital advertising markets |
| Market Share | Significant in gaming engine market but facing competition and shrinking margins | Leading position in programmatic ad buying with growing market share |
Key takeaways: Unity shows strong innovation and a globally recognized platform but struggles with profitability and value creation. The Trade Desk maintains better profitability and a favorable financial profile, though its moat is slightly unfavorable due to recent declining returns. Investors should weigh Unity’s growth potential against its financial risks, while The Trade Desk offers more stability with moderate growth prospects.
Risk Analysis
Below is a comparative risk assessment table for Unity Software Inc. (U) and The Trade Desk, Inc. (TTD) based on the most recent 2024 data.
| Metric | Unity Software Inc. (U) | The Trade Desk, Inc. (TTD) |
|---|---|---|
| Market Risk | High beta (2.05) indicates high volatility | Moderate beta (1.11), less volatile |
| Debt level | Moderate debt-to-equity (0.74), neutral risk | Low debt-to-equity (0.11), favorable risk |
| Regulatory Risk | Moderate, operates globally with diverse regulations | Moderate, U.S. focused with international presence |
| Operational Risk | Unfavorable net margin (-36.6%), negative ROE and ROIC | Favorable net margin (16.1%), positive ROE and ROIC |
| Environmental Risk | Moderate, no dividend and high WACC (12.26%) indicating capital costs | Moderate, no dividend, WACC (8.93%) lower |
| Geopolitical Risk | High, presence in multiple countries including China and Europe | Moderate, primarily U.S. based with some international exposure |
Unity Software’s risks are mainly operational and market-related, given its high volatility, negative profitability, and moderate leverage. The Trade Desk shows stronger financial stability with lower debt and positive profitability but carries valuation risks due to high P/E and P/B ratios. The most impactful and likely risks for Unity are its operational losses and market volatility, whereas for The Trade Desk, valuation and moderate market exposure pose caution.
Which Stock to Choose?
Unity Software Inc. (U) shows a mixed income evolution with declining revenue recently but overall growth since 2020. Its financial ratios are slightly unfavorable, marked by negative profitability and moderate debt levels. The company’s profitability metrics and ROIC are negative, indicating value destruction, while its rating is very unfavorable with a D+ score.
The Trade Desk, Inc. (TTD) exhibits strong income growth, favorable margins, and positive profitability ratios. Its financial ratios are mostly favorable, supported by low debt and solid return metrics, despite a high P/E and P/B ratio. The company’s ROIC slightly underperforms WACC but remains better than U’s, and it holds a favorable rating with a B score.
For investors prioritizing quality and profitability, The Trade Desk may appear more favorable given its robust income growth and healthier financial ratios. Conversely, investors with a higher risk tolerance focused on turnaround potential might view Unity’s recent improvements and lower valuation metrics as interesting, though its overall financial health appears less stable.
Disclaimer: Investment carries a risk of loss of initial capital. The past performance is not a reliable indicator of future results. Be sure to understand risks before making an investment decision.
Go Further
I encourage you to read the complete analyses of Unity Software Inc. and The Trade Desk, Inc. to enhance your investment decisions: