In today’s fast-evolving tech landscape, Uber Technologies, Inc. and The Trade Desk, Inc. stand out as innovators in the software application industry. Uber revolutionizes mobility, delivery, and freight services worldwide, while The Trade Desk leads in data-driven digital advertising platforms. Both companies showcase strong growth potential through cutting-edge technology and market reach. This article will help you determine which company presents the most compelling investment opportunity for your portfolio.

Table of contents
Companies Overview
I will begin the comparison between Uber Technologies, Inc. and The Trade Desk, Inc. by providing an overview of these two companies and their main differences.
Uber Technologies, Inc. Overview
Uber Technologies, Inc. develops and operates proprietary technology applications globally, connecting consumers with independent providers for ridesharing, delivery, and freight services. The company operates through three segments: Mobility, Delivery, and Freight, offering a broad range of transportation and logistics solutions. Founded in 2009 and headquartered in San Francisco, Uber holds a leading position in the software application industry with a market cap of 176B USD.
The Trade Desk, Inc. Overview
The Trade Desk, Inc. is a technology company that offers a cloud-based platform for managing and optimizing data-driven digital advertising campaigns across multiple channels and devices. Serving advertising agencies and service providers, it enables buyers to create and control campaigns in formats like display, video, and connected TV. Founded in 2009 and based in Ventura, California, The Trade Desk has a market cap of approximately 17.3B USD.
Key similarities and differences
Both Uber and The Trade Desk operate in the technology sector within the software application industry and are headquartered in California. Uber focuses on connecting consumers with mobility and delivery services, while The Trade Desk specializes in digital advertising technology. Uber’s business model includes multiple service segments, whereas The Trade Desk offers a self-service platform primarily for ad campaign management. Their market caps differ significantly, reflecting the scale and scope of their operations.
Income Statement Comparison
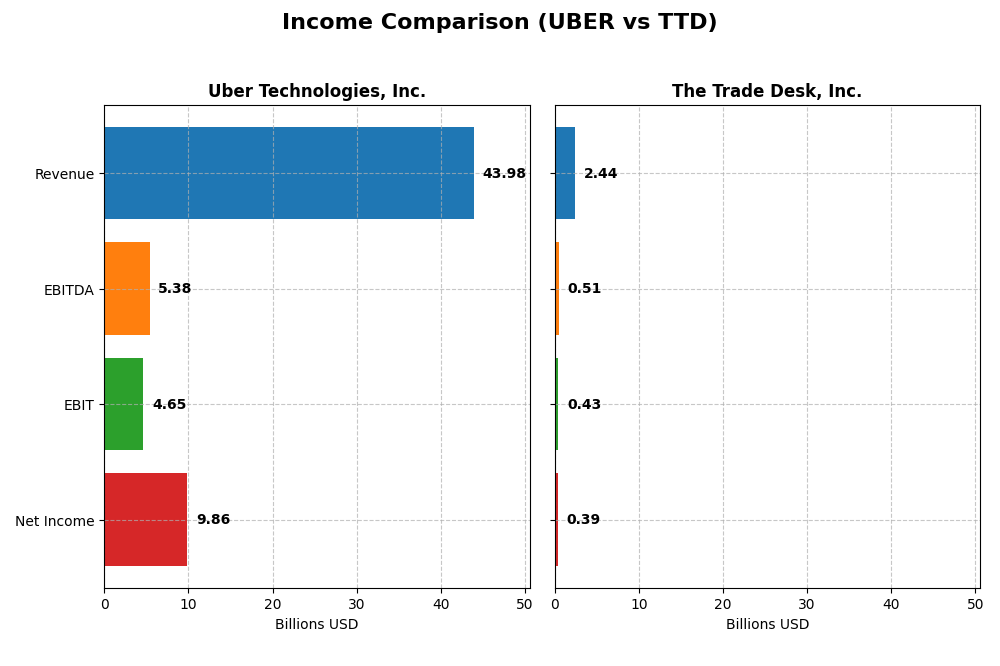
The following table presents the key income statement metrics for Uber Technologies, Inc. and The Trade Desk, Inc. for the fiscal year 2024, allowing a side-by-side financial performance comparison.
| Metric | Uber Technologies, Inc. | The Trade Desk, Inc. |
|---|---|---|
| Market Cap | 176.3B | 17.3B |
| Revenue | 43.98B | 2.44B |
| EBITDA | 5.39B | 515M |
| EBIT | 4.65B | 427M |
| Net Income | 9.86B | 393M |
| EPS | 4.71 | 0.80 |
| Fiscal Year | 2024 | 2024 |
Income Statement Interpretations
Uber Technologies, Inc.
Uber’s revenue and net income have shown strong growth from 2020 to 2024, with revenue nearly quadrupling from $11.1B to $43.9B and net income turning positive to $9.8B in 2024 from a loss of $6.8B in 2020. Margins improved significantly, with a 22.4% net margin and 10.6% EBIT margin in 2024. The latest year saw favorable growth in revenue (+18%) and substantial margin expansion, reflecting improved profitability.
The Trade Desk, Inc.
The Trade Desk experienced consistent revenue growth from $836M in 2020 to $2.44B in 2024, with net income increasing from $242M to $393M. Gross and EBIT margins remain healthy at 80.7% and 17.5%, respectively, though the net margin of 16.1% declined over the period. In 2024, revenue grew by 25.6% and net income by 75%, indicating strong operational performance despite a slight overall net margin contraction.
Which one has the stronger fundamentals?
Uber demonstrates more dramatic growth in revenue and net income, alongside significant margin improvements, resulting in a higher net margin and EPS growth over the period. The Trade Desk shows stable profitability with strong gross margins but faces a net margin decline overall. Both companies have favorable income statement evaluations, though Uber’s fundamentals exhibit more pronounced expansion and margin enhancement.
Financial Ratios Comparison
The table below presents a side-by-side comparison of key financial ratios for Uber Technologies, Inc. and The Trade Desk, Inc. based on the most recent fiscal year 2024 data.
| Ratios | Uber Technologies, Inc. (UBER) | The Trade Desk, Inc. (TTD) |
|---|---|---|
| ROE | 45.7% | 13.3% |
| ROIC | 6.8% | 10.0% |
| P/E | 12.8 | 146.8 |
| P/B | 5.9 | 19.6 |
| Current Ratio | 1.07 | 1.86 |
| Quick Ratio | 1.07 | 1.86 |
| D/E (Debt-to-Equity) | 0.53 | 0.11 |
| Debt-to-Assets | 22.3% | 5.1% |
| Interest Coverage | 5.35 | 0 (not reported) |
| Asset Turnover | 0.86 | 0.40 |
| Fixed Asset Turnover | 14.1 | 5.17 |
| Payout ratio | 0% | 0% |
| Dividend yield | 0% | 0% |
Interpretation of the Ratios
Uber Technologies, Inc.
Uber exhibits a balanced financial profile, with favorable net margin (22.41%) and return on equity (45.72%), indicating strong profitability and efficient equity use. However, its price-to-book ratio (5.86) is unfavorable, suggesting potential overvaluation. The company’s liquidity ratios are stable, and debt levels are manageable. Uber does not pay dividends, likely reflecting reinvestment in growth and operations.
The Trade Desk, Inc.
The Trade Desk shows favorable ratios in net margin (16.08%) and return on invested capital (10.02%), signaling efficient capital use and profitability. Its price-to-earnings (146.77) and price-to-book (19.56) ratios are high, raising valuation concerns. Liquidity and leverage ratios are strong, and interest coverage is excellent. The company also does not pay dividends, focusing on growth and reinvestment.
Which one has the best ratios?
The Trade Desk holds a slightly more favorable overall ratio profile at 57.14% favorable compared to Uber’s 50%, with stronger liquidity and leverage metrics. However, Uber presents superior profitability metrics and a lower valuation multiple. Both companies avoid dividends, emphasizing growth, but Trade Desk’s higher unfavorable valuations suggest caution despite its favorable financial health.
Strategic Positioning
This section compares the strategic positioning of Uber Technologies, Inc. and The Trade Desk, Inc. regarding market position, key segments, and exposure to technological disruption:
Uber Technologies, Inc.
- Large market cap of 176B, operating globally, facing competitive pressure in mobility and delivery markets.
- Diversified revenue streams from Mobility (25B), Delivery (13.75B), and Freight (5.14B) segments driving growth.
- Operates proprietary technology platforms with moderate exposure to disruption in mobility and delivery sectors.
The Trade Desk, Inc.
- Smaller market cap of 17B, focused on digital advertising technology with niche competitive pressures.
- Concentrated business in a cloud-based platform for data-driven digital advertising campaign management.
- Cloud-based platform reliant on evolving ad tech trends, facing significant technological disruption risks.
Uber Technologies vs The Trade Desk Positioning
Uber’s strategy is diversified across mobility, delivery, and freight, providing multiple growth drivers but facing broad competitive pressures. The Trade Desk focuses narrowly on digital advertising technology, which may limit scale but targets a specialized market segment.
Which has the best competitive advantage?
Both companies are slightly unfavorable in MOAT evaluation; Uber shows growing ROIC but still sheds value, while The Trade Desk has declining ROIC and also sheds value, indicating neither currently has a strong competitive advantage.
Stock Comparison
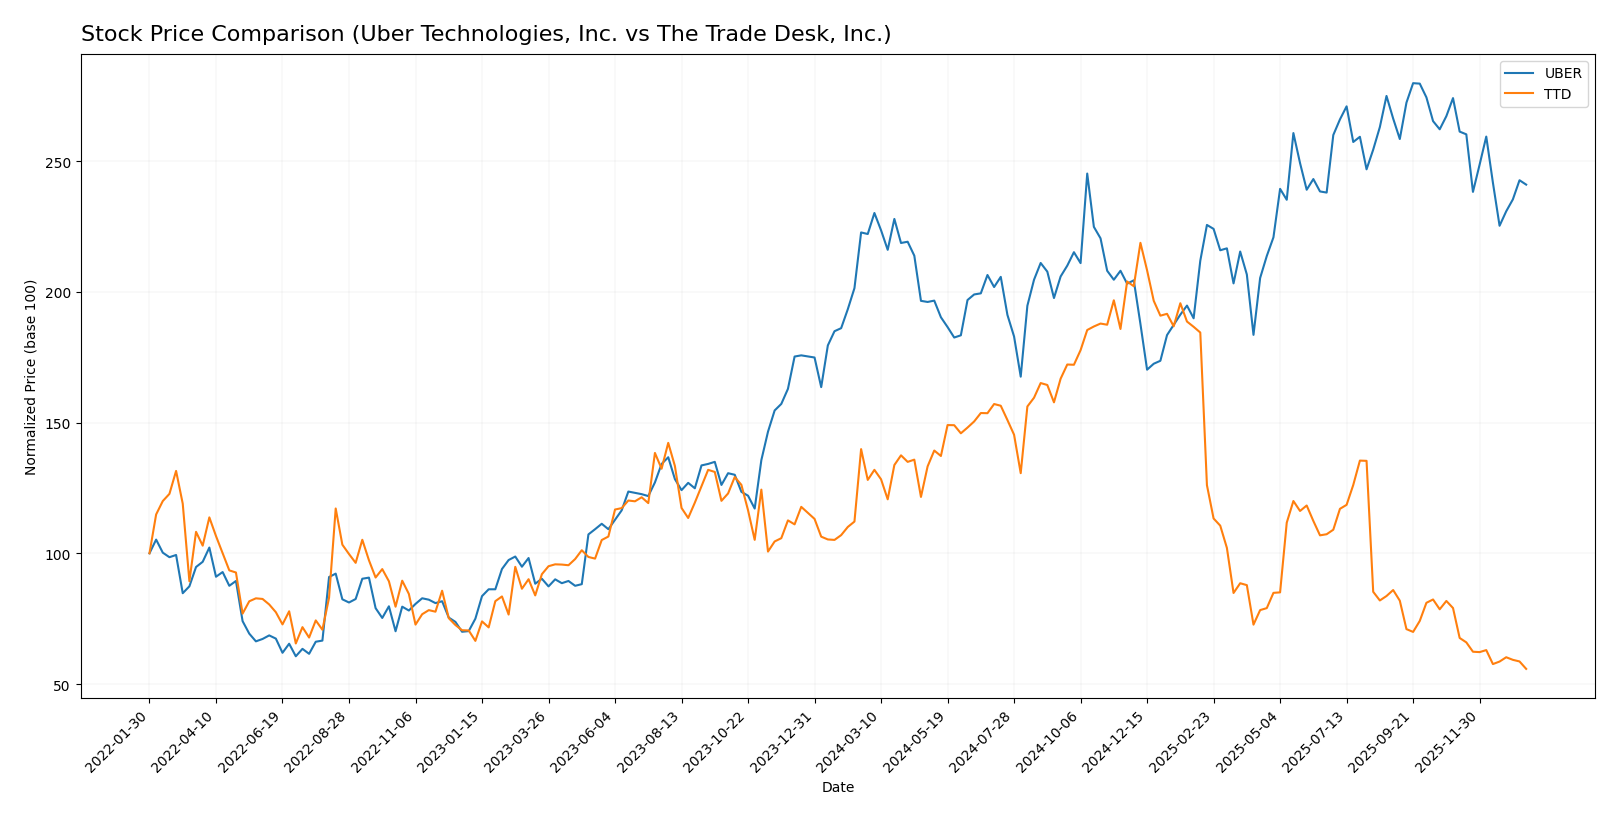
The stock price dynamics over the past 12 months reveal contrasting performances, with Uber Technologies, Inc. showing a moderate appreciation and The Trade Desk, Inc. experiencing a significant decline amid varying volume trends.
Trend Analysis
Uber Technologies, Inc. exhibited a bullish trend over the past year with an 8.5% price increase, though momentum decelerated. The stock ranged from a low of 58.99 to a high of 98.51, with volatility reflected by a 10.29 standard deviation.
The Trade Desk, Inc. faced a bearish trend over the same period, with a steep 56.43% price decline and decelerating downward momentum. The stock traded between 35.48 and 139.11, showing a higher volatility of 28.36 standard deviation.
Comparing trends, Uber delivered the highest market performance with an 8.5% gain, while The Trade Desk’s significant 56.43% loss marked a weaker market position over the past year.
Target Prices
Analysts present a mixed but generally optimistic target consensus for Uber Technologies, Inc. and The Trade Desk, Inc.
| Company | Target High | Target Low | Consensus |
|---|---|---|---|
| Uber Technologies, Inc. | 140 | 73 | 111.26 |
| The Trade Desk, Inc. | 98 | 39 | 56.73 |
Uber’s consensus target of 111.26 suggests upside potential from its current price of 84.85 USD, while The Trade Desk’s consensus at 56.73 also indicates a possible rebound above its current 35.48 USD market price.
Analyst Opinions Comparison
This section compares analysts’ ratings and grades for Uber Technologies, Inc. and The Trade Desk, Inc.:
Rating Comparison
Uber Rating
- Rating: Both companies have a “B” rating, indicating very favorable evaluations.
- Discounted Cash Flow Score: Uber scores 1, marked very unfavorable for valuation based on future cash flows.
- ROE Score: Uber’s 5 rating shows very favorable profit generation efficiency from equity.
- ROA Score: Uber’s 5 score indicates very favorable asset utilization to generate earnings.
- Debt To Equity Score: Uber’s score of 2 is moderate, indicating some financial risk.
- Overall Score: Both companies share an overall score of 3, reflecting a moderate financial standing.
The Trade Desk Rating
- Rating: Both companies have a “B” rating, indicating very favorable evaluations.
- Discounted Cash Flow Score: The Trade Desk scores 4, a favorable outlook on valuation from cash flow projections.
- ROE Score: The Trade Desk scores 4, favorable in generating profits from shareholders’ equity.
- ROA Score: The Trade Desk scores 4, favorable in effectively using its assets to produce earnings.
- Debt To Equity Score: The Trade Desk scores 3, also moderate, with slightly stronger balance sheet metrics.
- Overall Score: Both companies share an overall score of 3, reflecting a moderate financial standing.
Which one is the best rated?
Both Uber and The Trade Desk hold identical overall ratings and scores, but The Trade Desk has more favorable discounted cash flow and debt-to-equity scores. Uber excels in return on equity and assets, showing strengths in profitability and asset use.
Scores Comparison
Here is a comparison of the Altman Z-Score and Piotroski Score for Uber and The Trade Desk:
Uber Scores
- Altman Z-Score: 4.44, indicating a safe zone with low bankruptcy risk.
- Piotroski Score: 6, classified as average financial strength.
The Trade Desk Scores
- Altman Z-Score: 4.30, indicating a safe zone with low bankruptcy risk.
- Piotroski Score: 5, classified as average financial strength.
Which company has the best scores?
Uber has slightly higher Altman Z-Score and Piotroski Score values than The Trade Desk. Both are in the safe zone for bankruptcy risk, with Uber showing marginally stronger financial health based on the provided scores.
Grades Comparison
Here is a side-by-side comparison of the latest grades assigned by reputable grading companies for both companies:
Uber Technologies, Inc. Grades
The table below summarizes recent grades from notable financial institutions for Uber Technologies, Inc.:
| Grading Company | Action | New Grade | Date |
|---|---|---|---|
| BTIG | Maintain | Buy | 2026-01-15 |
| Wells Fargo | Maintain | Overweight | 2026-01-08 |
| Cantor Fitzgerald | Maintain | Overweight | 2026-01-08 |
| Wolfe Research | Maintain | Outperform | 2026-01-06 |
| Wedbush | Maintain | Neutral | 2025-12-19 |
| Morgan Stanley | Maintain | Overweight | 2025-12-08 |
| Arete Research | Upgrade | Buy | 2025-12-03 |
| Wells Fargo | Maintain | Overweight | 2025-11-05 |
| Guggenheim | Maintain | Buy | 2025-11-05 |
| DA Davidson | Maintain | Buy | 2025-11-05 |
Overall, Uber’s grades show a consistent pattern of positive ratings, predominantly Buy and Overweight, with rare Neutral assessments.
The Trade Desk, Inc. Grades
The table below details recent grades assigned to The Trade Desk, Inc. by recognized grading companies:
| Grading Company | Action | New Grade | Date |
|---|---|---|---|
| Morgan Stanley | Maintain | Equal Weight | 2026-01-13 |
| Wells Fargo | Maintain | Equal Weight | 2026-01-12 |
| Cantor Fitzgerald | Maintain | Neutral | 2026-01-08 |
| Wolfe Research | Maintain | Outperform | 2026-01-06 |
| Guggenheim | Maintain | Buy | 2026-01-05 |
| Jefferies | Maintain | Hold | 2025-12-11 |
| Wedbush | Maintain | Neutral | 2025-12-08 |
| DA Davidson | Maintain | Buy | 2025-11-10 |
| Truist Securities | Maintain | Buy | 2025-11-07 |
| Wells Fargo | Maintain | Equal Weight | 2025-11-07 |
The Trade Desk’s grades reveal a more mixed outlook, with ratings ranging from Hold and Neutral to Buy and Outperform, but with a notable presence of Equal Weight assessments.
Which company has the best grades?
Uber Technologies, Inc. has received stronger and more consistently favorable grades compared to The Trade Desk, Inc. This trend may suggest a more robust consensus of confidence among analysts for Uber, potentially influencing investor sentiment towards a relatively higher conviction in Uber’s growth or value prospects.
Strengths and Weaknesses
Below is a comparative overview of Uber Technologies, Inc. and The Trade Desk, Inc. highlighting key strengths and weaknesses based on recent financial and strategic data.
| Criterion | Uber Technologies, Inc. | The Trade Desk, Inc. |
|---|---|---|
| Diversification | High: Diverse revenue streams including Mobility ($25B), Delivery ($13.75B), and Freight ($5.14B) in 2024 | Moderate: Focused on digital advertising platforms without significant diversification |
| Profitability | Favorable net margin (22.41%) and ROE (45.72%), but ROIC (6.79%) below WACC (9.17%) indicates slight value destruction | Favorable ROIC (10.02%) above WACC (8.93%), net margin (16.08%) positive but high P/E (146.77) and P/B (19.56) ratios are concerns |
| Innovation | Strong technology investments in mobility and freight sectors; growing ROIC trend despite current value shedding | Innovative ad tech but declining ROIC trend suggests challenges in sustaining profitability |
| Global presence | Extensive global footprint with multi-segment operations worldwide | Strong presence in digital advertising but less diversified geographically |
| Market Share | Leading in ride-hailing and delivery markets with growing revenue streams | Significant player in programmatic advertising though facing intense competition |
Key takeaways: Uber’s diversified revenue and improving profitability underpin its resilience despite current value challenges. The Trade Desk shows strong profitability metrics but struggles with valuation and declining returns, suggesting a need for cautious consideration.
Risk Analysis
Below is a comparative table highlighting key risks for Uber Technologies, Inc. (UBER) and The Trade Desk, Inc. (TTD) based on the most recent 2024 data:
| Metric | Uber Technologies, Inc. (UBER) | The Trade Desk, Inc. (TTD) |
|---|---|---|
| Market Risk | Beta 1.203, moderate volatility | Beta 1.105, slightly lower volatility |
| Debt Level | Debt/Equity 0.53, moderate risk | Debt/Equity 0.11, low risk |
| Regulatory Risk | High, due to global ride-sharing regulations | Moderate, primarily digital ad regulations |
| Operational Risk | High, complex logistics & multiple segments | Moderate, platform reliance and client retention |
| Environmental Risk | Moderate, vehicle emissions and delivery logistics | Low, digital operations with minimal physical footprint |
| Geopolitical Risk | Moderate, global presence with exposure to multiple markets | Moderate, international ad market exposure |
The most impactful risks are Uber’s regulatory challenges across diverse geographic markets and operational complexity affecting profitability. The Trade Desk faces significant market risk from its high valuation and reliance on digital ad trends, with lower debt-related risk but caution needed on price metrics. Both firms maintain financial stability, but investors should monitor regulatory and market dynamics closely.
Which Stock to Choose?
Uber Technologies, Inc. exhibits a favorable income evolution with strong revenue and net income growth, supported by a very favorable rating and a slightly favorable global financial ratios evaluation. Its profitability is robust with a 22.41% net margin and a 45.72% return on equity, while debt levels remain moderate and manageable.
The Trade Desk, Inc. shows a favorable income trajectory marked by solid revenue growth, though net margin growth is unfavorable over the long term. It maintains a very favorable rating and a favorable global ratios evaluation, with lower debt levels and good liquidity, albeit at a higher valuation reflected in an elevated price-to-earnings ratio.
For investors, the choice might depend on their profile: those prioritizing growth could find The Trade Desk’s aggressive expansion and favorable ratios appealing despite high valuation, while risk-averse or quality-focused investors may view Uber’s consistent profitability and moderate debt as more favorable. Both companies have slightly unfavorable moats, indicating challenges in sustained value creation.
Disclaimer: Investment carries a risk of loss of initial capital. The past performance is not a reliable indicator of future results. Be sure to understand risks before making an investment decision.
Go Further
I encourage you to read the complete analyses of Uber Technologies, Inc. and The Trade Desk, Inc. to enhance your investment decisions: