In the dynamic world of software applications, Tyler Technologies, Inc. (TYL) and The Trade Desk, Inc. (TTD) stand out with distinct yet overlapping market footprints. Tyler focuses on integrated public sector solutions, while The Trade Desk leads in digital advertising technology. Both companies innovate within their niches, offering compelling growth narratives. This article will help you discern which of these tech players presents a more attractive investment opportunity in 2026.
Table of contents
Companies Overview
I will begin the comparison between Tyler Technologies and The Trade Desk by providing an overview of these two companies and their main differences.
Tyler Technologies Overview
Tyler Technologies, Inc. delivers integrated information management solutions and services tailored to the public sector. Its offerings include financial management, judicial, public safety, appraisal, and tax software systems to automate government operations. Founded in 1966 and based in Plano, Texas, Tyler Technologies is a key player in government software, with a market cap of approximately 18.9B and a workforce of 7,462 employees.
The Trade Desk Overview
The Trade Desk, Inc. operates a cloud-based platform enabling buyers to create and optimize data-driven digital advertising campaigns across multiple formats and devices globally. Founded in 2009 and headquartered in Ventura, California, it serves advertising agencies and related providers. The company holds a market cap near 17.3B and employs about 3,522 staff, focusing on technology for digital ad management.
Key similarities and differences
Both companies operate in the technology sector with a focus on software applications, yet they serve distinct markets: Tyler Technologies targets public sector clients with government-focused solutions, while The Trade Desk specializes in digital advertising technology for commercial clients. Tyler has a larger workforce and longer history, whereas The Trade Desk emphasizes cloud-based ad campaign management, reflecting different business models and customer bases.
Income Statement Comparison
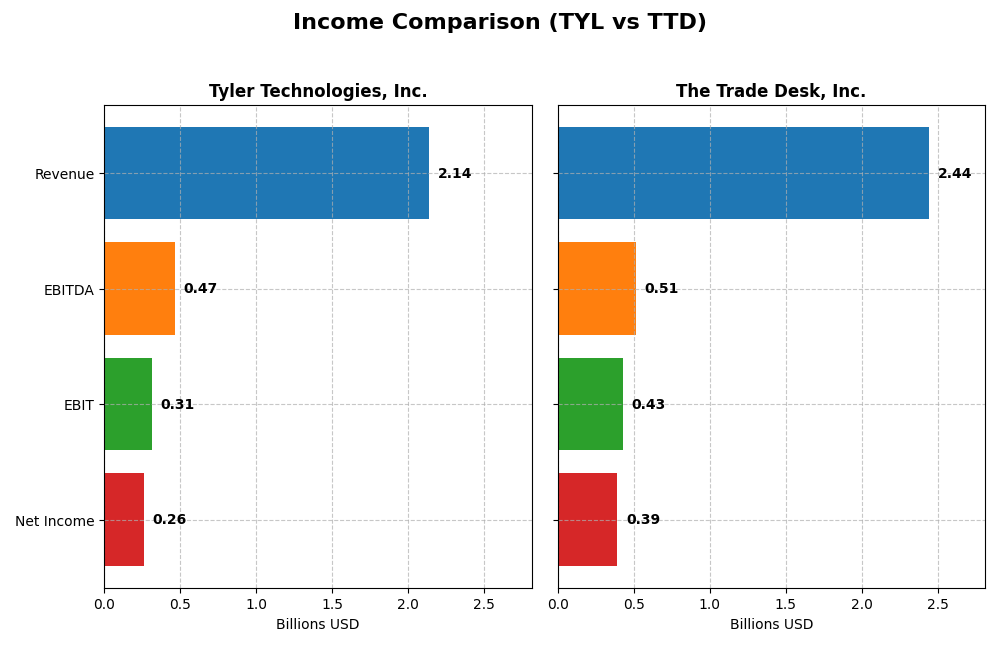
The table below presents a side-by-side comparison of key income statement metrics for Tyler Technologies, Inc. and The Trade Desk, Inc. for the fiscal year 2024, reflecting their financial performance.
| Metric | Tyler Technologies, Inc. (TYL) | The Trade Desk, Inc. (TTD) |
|---|---|---|
| Market Cap | 18.9B | 17.3B |
| Revenue | 2.14B | 2.44B |
| EBITDA | 466M | 515M |
| EBIT | 314M | 427M |
| Net Income | 263M | 393M |
| EPS | 6.17 | 0.80 |
| Fiscal Year | 2024 | 2024 |
Income Statement Interpretations
Tyler Technologies, Inc.
Tyler Technologies showed consistent revenue growth from $1.12B in 2020 to $2.14B in 2024, a 91.45% increase. Net income rose from $195M to $263M despite a slight decline in net margin overall. The 2024 results highlight improved profitability with a 9.53% revenue increase and a 44.73% net margin expansion, signaling efficient cost management and stronger earnings.
The Trade Desk, Inc.
The Trade Desk’s revenue surged from $836M in 2020 to $2.44B in 2024, a 192.43% rise, with net income growing from $242M to $393M. Gross and EBIT margins remain robust, exceeding 80% and 17% respectively. In 2024, revenue growth accelerated to 25.63%, net margin expanded by 74.86%, and EPS more than doubled, reflecting rapid scaling and margin enhancement.
Which one has the stronger fundamentals?
Both companies exhibit favorable income statement trends with strong revenue and net income growth. The Trade Desk leads in margin levels and growth rates, demonstrating high scalability and operational leverage. Tyler Technologies shows steadier margin stability and controlled interest expenses. Each displays strengths, with The Trade Desk excelling in growth and margins, while Tyler offers consistent profitability improvements.
Financial Ratios Comparison
Below is a comparative overview of key financial ratios for Tyler Technologies, Inc. (TYL) and The Trade Desk, Inc. (TTD) based on their most recent fiscal year 2024 data.
| Ratios | Tyler Technologies, Inc. (TYL) | The Trade Desk, Inc. (TTD) |
|---|---|---|
| ROE | 7.76% | 13.33% |
| ROIC | 6.20% | 10.02% |
| P/E | 93.42 | 146.77 |
| P/B | 7.25 | 19.56 |
| Current Ratio | 1.35 | 1.86 |
| Quick Ratio | 1.35 | 1.86 |
| D/E (Debt-to-Equity) | 0.19 | 0.11 |
| Debt-to-Assets | 12.32% | 5.11% |
| Interest Coverage | 50.50 | 0 (no data) |
| Asset Turnover | 0.41 | 0.40 |
| Fixed Asset Turnover | 10.95 | 5.17 |
| Payout Ratio | 0 | 0 |
| Dividend Yield | 0 | 0 |
Interpretation of the Ratios
Tyler Technologies, Inc.
Tyler Technologies shows a balanced financial profile with 50% favorable and 35.7% unfavorable ratios. Its net margin is strong at 12.3%, but return on equity (7.76%) and asset turnover are weak. The company maintains solid liquidity and low debt levels with favorable debt-to-assets and interest coverage ratios. Tyler does not pay dividends, likely focusing on reinvestment and growth strategies.
The Trade Desk, Inc.
The Trade Desk exhibits a mostly favorable ratio set, with 57.1% positive and 28.6% negative indicators. It has a higher net margin (16.08%) and return on invested capital (10.02%) than Tyler, though its price-to-earnings and price-to-book ratios are elevated. Liquidity and leverage metrics are favorable. Like Tyler, The Trade Desk does not distribute dividends, reflecting a growth-oriented approach.
Which one has the best ratios?
Overall, The Trade Desk holds a more favorable ratios profile, with stronger profitability and capital efficiency metrics, alongside solid liquidity and leverage. Tyler Technologies presents a slightly favorable stance but is weighed down by weaker returns and valuation multiples. Both companies abstain from dividends, emphasizing reinvestment over shareholder payouts.
Strategic Positioning
This section compares the strategic positioning of Tyler Technologies, Inc. and The Trade Desk, Inc., including market position, key segments, and exposure to technological disruption:
Tyler Technologies, Inc.
- Established public sector software provider with a $18.9B market cap, facing moderate competitive pressure.
- Focused on integrated public sector solutions including enterprise software, tax, and SaaS arrangements.
- Collaborates with Amazon Web Services for cloud hosting, showing adaptation to cloud technology disruptions.
The Trade Desk, Inc.
- Digital advertising technology firm with a $17.3B market cap, operating in a highly competitive ad tech market.
- Offers self-service cloud platform for data-driven digital advertising across multiple formats and devices.
- Operates on a cloud-based platform, indicating direct exposure and adaptation to digital and cloud disruptions.
Tyler Technologies, Inc. vs The Trade Desk, Inc. Positioning
Tyler Technologies has a diversified focus on public sector software solutions, offering multiple product lines and services, whereas The Trade Desk concentrates on digital advertising technology with a cloud-based platform. Tyler’s breadth covers government and educational segments; The Trade Desk targets advertising agencies and service providers, reflecting a more concentrated business model.
Which has the best competitive advantage?
Based on MOAT evaluation, neither company currently demonstrates a strong competitive advantage. Tyler Technologies shows a very unfavorable moat with declining profitability, while The Trade Desk’s moat is slightly unfavorable, indicating both face challenges in generating sustainable excess returns.
Stock Comparison
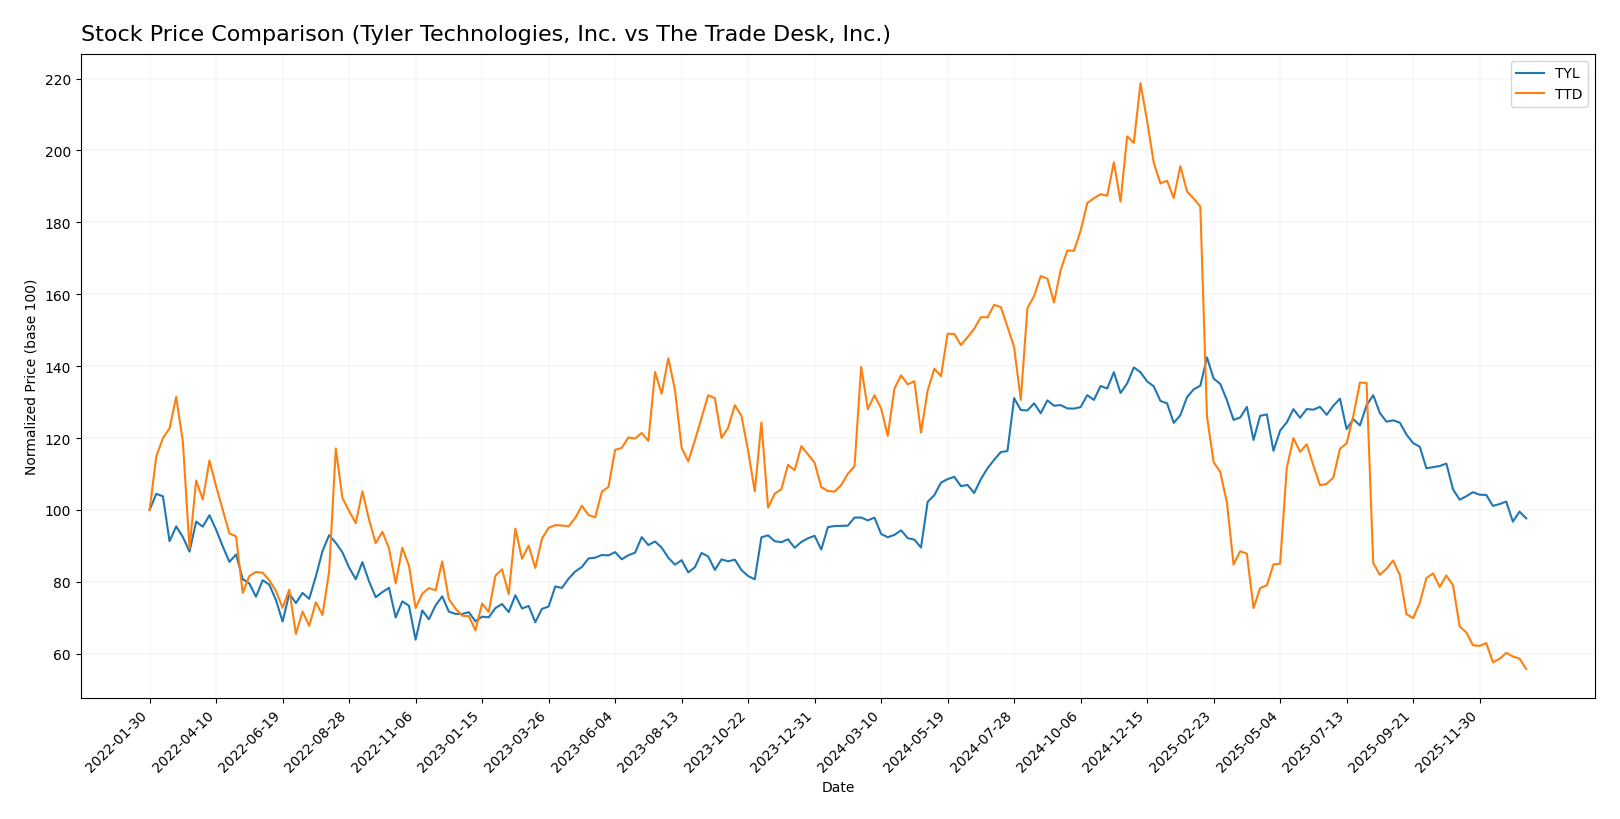
The stock price movements of Tyler Technologies, Inc. (TYL) and The Trade Desk, Inc. (TTD) over the past 12 months reveal contrasting trends, with TYL showing a slight overall increase despite recent declines, while TTD experiences a pronounced downward trajectory.
Trend Analysis
Tyler Technologies, Inc. (TYL) exhibited a bullish trend over the past year with a modest 0.58% price increase, although the trend showed deceleration. The stock reached a high of 641.7 and a low of 403.35, with recent weeks marked by a 7.61% decline and slight seller dominance.
The Trade Desk, Inc. (TTD) displayed a bearish trend over the same period, with a substantial 56.43% price decrease and decelerating decline. The stock’s high was 139.11 and low 35.48, with recent trading continuing down by 29.44% and strong seller dominance.
Comparatively, Tyler Technologies, Inc. outperformed The Trade Desk, Inc. in market performance over the past year, maintaining a near-neutral overall price change against TTD’s significant depreciation.
Target Prices
Analysts present a varied but optimistic consensus for Tyler Technologies, Inc. and The Trade Desk, Inc.
| Company | Target High | Target Low | Consensus |
|---|---|---|---|
| Tyler Technologies, Inc. | 675 | 470 | 584 |
| The Trade Desk, Inc. | 98 | 39 | 56.73 |
Tyler Technologies’s consensus target of 584 significantly exceeds its current price of 440.01, indicating strong upside potential. The Trade Desk’s consensus target of 56.73 also suggests notable growth above its current price of 35.48.
Analyst Opinions Comparison
This section compares analysts’ ratings and grades for Tyler Technologies, Inc. and The Trade Desk, Inc.:
Rating Comparison
TYL Rating
- Rating: B, considered very favorable by analysts.
- Discounted Cash Flow Score: 4, indicating favorable valuation based on cash flow.
- ROE Score: 3, showing moderate efficiency in generating profit from equity.
- ROA Score: 4, reflecting favorable asset utilization.
- Debt To Equity Score: 3, moderate financial risk with balanced debt levels.
- Overall Score: 3, a moderate overall financial standing.
TTD Rating
- Rating: B, also regarded as very favorable.
- Discounted Cash Flow Score: 4, similarly favorable valuation.
- ROE Score: 4, indicating favorable efficiency in profit generation.
- ROA Score: 4, also favorable asset utilization.
- Debt To Equity Score: 3, same moderate financial risk assessment.
- Overall Score: 3, also moderate overall financial standing.
Which one is the best rated?
Both companies share a “B” rating and identical overall scores of 3. However, The Trade Desk holds a higher ROE score, suggesting slightly better efficiency in generating profits from equity, while other scores remain comparable.
Scores Comparison
Here is the comparison of Tyler Technologies and The Trade Desk scores:
TYL Scores
- Altman Z-Score: 7.42, indicating a safe zone with low bankruptcy risk.
- Piotroski Score: 6, reflecting average financial strength.
TTD Scores
- Altman Z-Score: 4.30, indicating a safe zone with low bankruptcy risk.
- Piotroski Score: 5, indicating average financial strength.
Which company has the best scores?
Tyler Technologies has a higher Altman Z-Score and Piotroski Score compared to The Trade Desk. Both are in the safe zone for bankruptcy risk, but Tyler shows a marginally stronger financial health based on these scores.
Grades Comparison
Here is a comparison of the latest available grades for Tyler Technologies, Inc. and The Trade Desk, Inc.:
Tyler Technologies, Inc. Grades
This table shows recent grades from established grading companies for Tyler Technologies, Inc.
| Grading Company | Action | New Grade | Date |
|---|---|---|---|
| Piper Sandler | Maintain | Overweight | 2026-01-13 |
| Wells Fargo | Maintain | Equal Weight | 2026-01-08 |
| DA Davidson | Maintain | Neutral | 2025-12-09 |
| Evercore ISI Group | Maintain | In Line | 2025-10-31 |
| DA Davidson | Maintain | Neutral | 2025-10-31 |
| DA Davidson | Maintain | Neutral | 2025-10-10 |
| DA Davidson | Maintain | Neutral | 2025-08-05 |
| Barclays | Maintain | Overweight | 2025-07-31 |
| Needham | Maintain | Buy | 2025-05-13 |
| Barclays | Maintain | Overweight | 2025-04-25 |
Tyler Technologies shows a generally positive outlook with several Overweight and Buy ratings, complemented by Neutral and In Line grades.
The Trade Desk, Inc. Grades
This table presents recent grades from recognized grading companies for The Trade Desk, Inc.
| Grading Company | Action | New Grade | Date |
|---|---|---|---|
| Morgan Stanley | Maintain | Equal Weight | 2026-01-13 |
| Wells Fargo | Maintain | Equal Weight | 2026-01-12 |
| Cantor Fitzgerald | Maintain | Neutral | 2026-01-08 |
| Wolfe Research | Maintain | Outperform | 2026-01-06 |
| Guggenheim | Maintain | Buy | 2026-01-05 |
| Jefferies | Maintain | Hold | 2025-12-11 |
| Wedbush | Maintain | Neutral | 2025-12-08 |
| DA Davidson | Maintain | Buy | 2025-11-10 |
| Truist Securities | Maintain | Buy | 2025-11-07 |
| Wells Fargo | Maintain | Equal Weight | 2025-11-07 |
The Trade Desk features a mix of Buy, Hold, Neutral, and Equal Weight ratings, with notable Outperform and multiple Buy grades.
Which company has the best grades?
Both Tyler Technologies and The Trade Desk have a consensus rating of “Buy,” but Tyler exhibits a higher concentration of Overweight and Buy grades, indicating a slightly stronger positive sentiment. Investors might interpret Tyler’s grades as signaling more confidence from analysts, which could influence portfolio weighting decisions.
Strengths and Weaknesses
Below is a comparative table highlighting the key strengths and weaknesses of Tyler Technologies, Inc. (TYL) and The Trade Desk, Inc. (TTD) based on recent financial and operational data.
| Criterion | Tyler Technologies, Inc. (TYL) | The Trade Desk, Inc. (TTD) |
|---|---|---|
| Diversification | Moderate: Revenue spread across software, SaaS, services, and transaction fees. | Moderate: Focused on programmatic advertising platform, less diversified. |
| Profitability | Moderate profitability with 12.3% net margin; ROIC 6.2% below WACC (7.99%). | Higher profitability: 16.08% net margin; ROIC 10.02% above WACC (8.93%). |
| Innovation | Limited recent innovation indications; declining ROIC trend. | Strong technology focus but facing declining ROIC trend. |
| Global presence | Primarily US-focused with some expansion in platform technologies. | Global reach in digital advertising markets. |
| Market Share | Solid presence in public sector software market. | Leading position in programmatic ad buying platforms. |
Key takeaways: Tyler Technologies shows a balanced revenue base but is currently value destructive with declining profitability. The Trade Desk is more profitable and globally positioned but also experiences a slight decline in capital efficiency. Investors should weigh TYL’s stability against TTD’s innovation risks.
Risk Analysis
Below is a comparison of key risk factors for Tyler Technologies, Inc. (TYL) and The Trade Desk, Inc. (TTD) based on the most recent data from 2024:
| Metric | Tyler Technologies, Inc. (TYL) | The Trade Desk, Inc. (TTD) |
|---|---|---|
| Market Risk | Beta 0.916 (lower volatility) | Beta 1.105 (higher volatility) |
| Debt level | Low (Debt/Equity 0.19; Debt to Assets 12.32%) | Very low (Debt/Equity 0.11; Debt to Assets 5.11%) |
| Regulatory Risk | Moderate (public sector focus may invite scrutiny) | Moderate (digital advertising regulations evolving) |
| Operational Risk | Moderate (complex software integrations) | Moderate (platform reliability and tech innovation critical) |
| Environmental Risk | Low (software sector, limited physical footprint) | Low (software sector, limited physical footprint) |
| Geopolitical Risk | Low to moderate (U.S.-centric public sector exposure) | Moderate (global ad market exposure, supply chain dependencies) |
The most likely and impactful risks lie in market volatility and regulatory changes. TTD’s higher beta indicates greater sensitivity to market swings. Both firms face regulatory challenges: TYL due to government contracts and TTD from increasing digital ad regulations. Both maintain low debt, minimizing financial risk. Operationally, maintaining software reliability and innovation is crucial for sustained growth.
Which Stock to Choose?
Tyler Technologies, Inc. (TYL) shows a favorable income evolution with 9.53% revenue growth in 2024 and strong profitability metrics, including a 12.3% net margin. Financial ratios are slightly favorable overall, with low debt levels and solid interest coverage, though return on equity is relatively low. The company’s rating is very favorable, supported by a safe Altman Z-Score and average Piotroski Score, despite a declining ROIC indicating value destruction.
The Trade Desk, Inc. (TTD) experienced stronger income growth at 25.63% in 2024 and higher profitability with a 16.08% net margin. Its financial ratios are favorable overall, featuring low debt and strong liquidity, although valuation multiples remain high. The rating is very favorable, with a safe Altman Z-Score and average Piotroski Score, yet a slightly unfavorable moat rating due to a decline in ROIC and lack of value creation.
For investors prioritizing growth potential and stronger recent income expansion, The Trade Desk may appear more attractive, whereas those valuing stable financial health and a more conservative debt profile might find Tyler Technologies more aligned with their goals. The interpretation depends on the investor’s risk tolerance and investment strategy, considering both companies’ favorable income statements and solid ratings but differing value creation outlooks.
Disclaimer: Investment carries a risk of loss of initial capital. The past performance is not a reliable indicator of future results. Be sure to understand risks before making an investment decision.
Go Further
I encourage you to read the complete analyses of Tyler Technologies, Inc. and The Trade Desk, Inc. to enhance your investment decisions: