The Trade Desk, Inc. (TTD) and monday.com Ltd. (MNDY) are two dynamic players in the software application industry, each carving out distinct niches in digital advertising and work management platforms. Both companies leverage cloud-based innovations to address evolving business needs, making them compelling choices for investors interested in technology-driven growth. In this article, I will analyze their strengths and risks to help you decide which company could be the better addition to your investment portfolio.
Table of contents
Companies Overview
I will begin the comparison between The Trade Desk and monday.com by providing an overview of these two companies and their main differences.
The Trade Desk Overview
The Trade Desk, Inc. is a technology company headquartered in Ventura, California, operating a cloud-based platform that enables buyers to create and optimize data-driven digital advertising campaigns across multiple formats and devices. Founded in 2009, it serves advertising agencies and providers globally, positioning itself as a key player in the digital advertising industry with a market cap of approximately 17.3B USD.
monday.com Overview
monday.com Ltd. is an Israeli technology firm headquartered in Tel Aviv, specializing in developing Work OS, a cloud-based visual work management system composed of modular building blocks for creating software applications. Incorporated in 2012, it serves various sectors including education, government, and business units, offering solutions for marketing, CRM, and project management, with a market cap near 6.5B USD.
Key similarities and differences
Both companies operate in the software application industry and provide cloud-based platforms targeting business users, but their focus differs significantly. The Trade Desk concentrates on digital advertising campaign management, while monday.com centers on work management and operational software. Additionally, The Trade Desk has a larger market capitalization and employee base compared to monday.com, reflecting their differing scale and market focus.
Income Statement Comparison
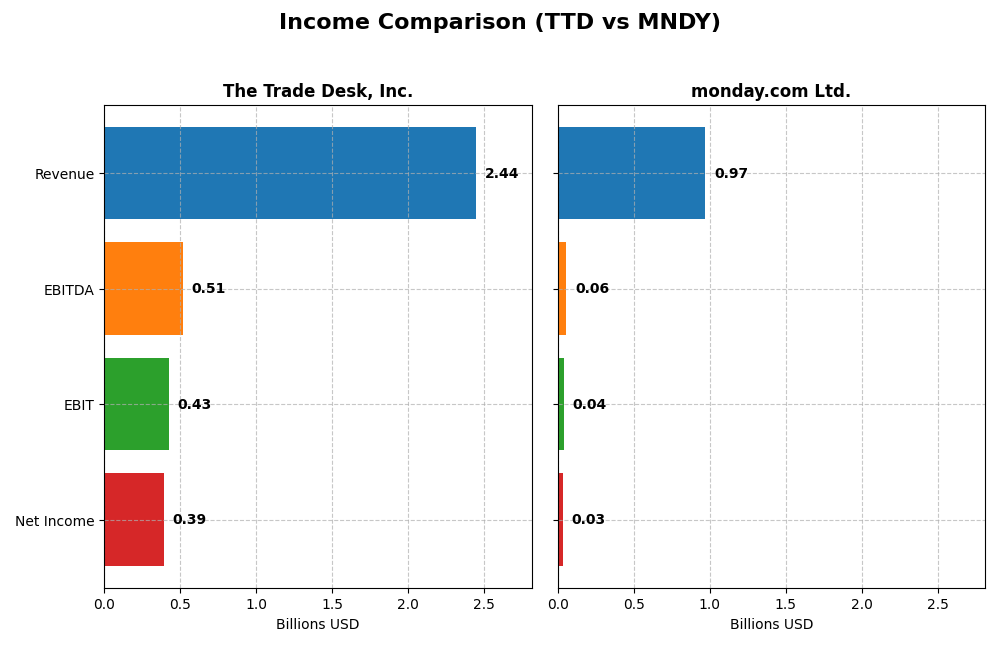
The table below presents a side-by-side comparison of key income statement metrics for The Trade Desk, Inc. and monday.com Ltd. for the fiscal year 2024.
| Metric | The Trade Desk, Inc. (TTD) | monday.com Ltd. (MNDY) |
|---|---|---|
| Market Cap | 17.3B | 6.5B |
| Revenue | 2.44B | 972M |
| EBITDA | 515M | 58M |
| EBIT | 427M | 40M |
| Net Income | 393M | 32M |
| EPS | 0.80 | 0.65 |
| Fiscal Year | 2024 | 2024 |
Income Statement Interpretations
The Trade Desk, Inc.
The Trade Desk, Inc. shows strong revenue growth, rising from $836M in 2020 to $2.44B in 2024, with net income increasing from $242M to $393M over the same period. Gross and net margins remain robust, albeit net margin declined slightly overall. In 2024, revenue grew by 25.63% and net margin improved significantly, indicating healthy profitability expansion.
monday.com Ltd.
monday.com Ltd. experienced rapid revenue growth from $161M in 2020 to $972M in 2024, with net income turning positive at $32M in 2024 after previous losses. The company maintains very high gross margins around 89%, but EBIT and net margins are much lower and more volatile. In 2024, revenue rose 33.21%, and net margin surged, reflecting strong operational improvement.
Which one has the stronger fundamentals?
The Trade Desk presents more consistent and favorable margin stability along with solid earnings growth, supporting stronger core profitability. monday.com shows impressive top-line expansion and turnaround from losses but lower and less stable profitability margins. Both demonstrate favorable income statement trends, with The Trade Desk leaning towards steadier fundamentals and monday.com towards high growth potential.
Financial Ratios Comparison
The table below presents a side-by-side comparison of key financial ratios for The Trade Desk, Inc. (TTD) and monday.com Ltd. (MNDY) based on their most recent fiscal year 2024 data.
| Ratios | The Trade Desk, Inc. (TTD) | monday.com Ltd. (MNDY) |
|---|---|---|
| ROE | 13.3% | 3.1% |
| ROIC | 10.0% | -1.7% |
| P/E | 147 | 363 |
| P/B | 19.6 | 11.4 |
| Current Ratio | 1.86 | 2.66 |
| Quick Ratio | 1.86 | 2.66 |
| D/E (Debt-to-Equity) | 0.11 | 0.10 |
| Debt-to-Assets | 5.1% | 6.3% |
| Interest Coverage | 0 | 0 |
| Asset Turnover | 0.40 | 0.58 |
| Fixed Asset Turnover | 5.17 | 7.13 |
| Payout Ratio | 0 | 0 |
| Dividend Yield | 0 | 0 |
Interpretation of the Ratios
The Trade Desk, Inc.
The Trade Desk shows mostly favorable ratios, including a strong net margin at 16.08% and a return on invested capital of 10.02%, signaling efficient capital use. However, high price-to-earnings (146.77) and price-to-book (19.56) ratios are unfavorable, indicating potential overvaluation. The company does not pay dividends, likely reinvesting in growth and technology, with no dividend yield or payout concerns.
monday.com Ltd.
monday.com exhibits mixed financial ratios, with unfavorable net margin (3.33%) and return on equity (3.14%), reflecting limited profitability. Its high P/E ratio of 362.98 suggests market optimism despite weak earnings. The company also does not distribute dividends, possibly focusing on reinvestment and expansion, supported by solid liquidity ratios and manageable debt, without shareholder payouts to evaluate.
Which one has the best ratios?
The Trade Desk presents a more favorable ratio profile overall, with stronger profitability and capital returns despite valuation concerns. monday.com’s ratios are more neutral, weighed down by weaker profitability and negative returns on capital. Thus, The Trade Desk currently demonstrates comparatively better financial health based on the available ratios.
Strategic Positioning
This section compares the strategic positioning of The Trade Desk, Inc. and monday.com Ltd. across Market position, Key segments, and Exposure to technological disruption:
The Trade Desk, Inc.
- Operates a cloud-based platform for digital advertising buyers, facing competitive pressure in ad tech.
- Focuses on digital advertising campaigns across multiple formats and devices, serving agencies and advertisers.
- Exposed to disruption through evolving digital ad formats and data-driven marketing technology advancements.
monday.com Ltd.
- Develops cloud-based Work OS software globally, competing in work management and CRM software.
- Offers modular work management tools for marketing, CRM, project management, and software development.
- Faces disruption risk from evolving cloud software trends and integration demands in diverse industries.
The Trade Desk, Inc. vs monday.com Ltd. Positioning
The Trade Desk concentrates on digital advertising technology with a specialized platform, while monday.com pursues a diversified approach in cloud-based work management software across various sectors. The Trade Desk has a focused niche, whereas monday.com serves broader business needs.
Which has the best competitive advantage?
Both companies are currently shedding value relative to their cost of capital, with The Trade Desk showing declining profitability and monday.com demonstrating improving profitability. Neither company currently exhibits a strong economic moat based on ROIC versus WACC metrics.
Stock Comparison
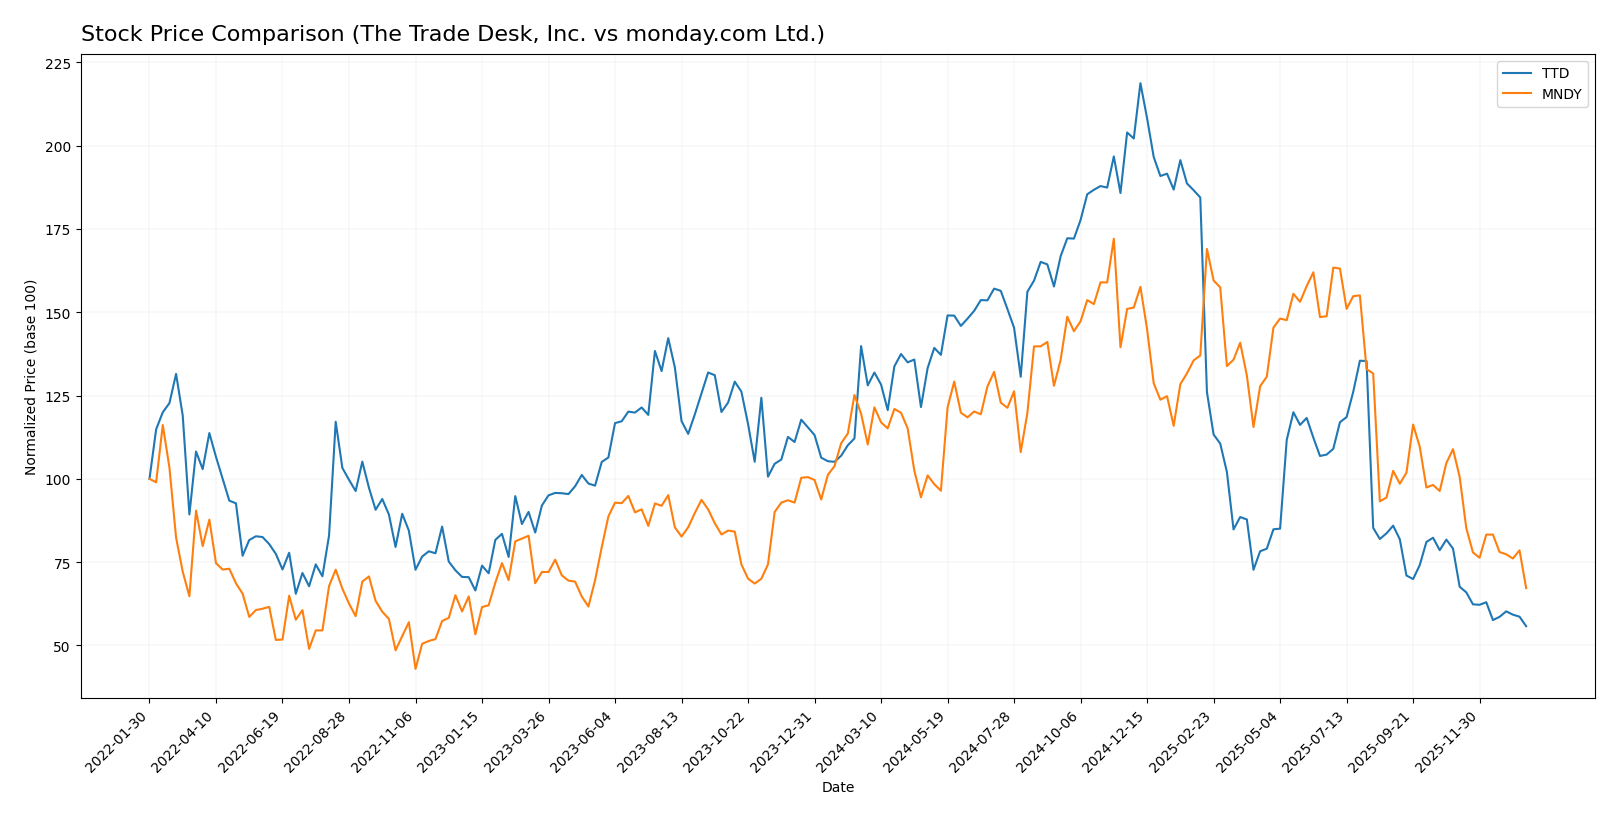
The stock prices of The Trade Desk, Inc. (TTD) and monday.com Ltd. (MNDY) have both exhibited significant declines over the past 12 months, reflecting bearish trends with marked price drops and decelerating momentum.
Trend Analysis
The Trade Desk, Inc. (TTD) experienced a bearish trend over the past year with a price decrease of 56.43%. The trend shows deceleration, with notable volatility (std deviation 28.36) and a high-low range from 139.11 to 35.48.
monday.com Ltd. (MNDY) also followed a bearish trend, declining by 39.06% in the last 12 months. This stock demonstrated higher volatility (std deviation 47.32) and decelerating trend momentum, with price extremes between 324.31 and 126.7.
Comparing both, TTD delivered the highest market decline with a 56.43% drop versus MNDY’s 39.06%, indicating a steeper negative performance over the analyzed period.
Target Prices
Here is the consensus target price outlook from verified analysts for the selected companies:
| Company | Target High | Target Low | Consensus |
|---|---|---|---|
| The Trade Desk, Inc. | 98 | 39 | 56.73 |
| monday.com Ltd. | 330 | 194 | 264.42 |
Analysts see significant upside potential for both The Trade Desk and monday.com compared to their current prices of $35.48 and $126.7, respectively. This suggests a generally bullish outlook.
Analyst Opinions Comparison
This section compares analysts’ ratings and grades for The Trade Desk, Inc. and monday.com Ltd.:
Rating Comparison
TTD Rating
- Rating: B, assessed as very favorable by analysts.
- Discounted Cash Flow Score: 4, indicating favorable valuation based on cash flow.
- ROE Score: 4, reflecting efficient profit generation from shareholders’ equity.
- ROA Score: 4, indicating strong asset utilization to generate earnings.
- Debt To Equity Score: 3, representing moderate financial risk.
- Overall Score: 3, a moderate overall financial standing.
MNDY Rating
- Rating: B-, also rated very favorable by analysts.
- Discounted Cash Flow Score: 4, showing similar favorable valuation.
- ROE Score: 3, a moderate level of profit generation efficiency.
- ROA Score: 3, showing moderate efficiency in asset use.
- Debt To Equity Score: 3, also moderate financial risk.
- Overall Score: 3, same moderate financial standing.
Which one is the best rated?
Based strictly on provided data, The Trade Desk, Inc. holds a slightly stronger position with higher ROE and ROA scores and a better overall rating of B versus monday.com Ltd.’s B-. Both have identical discounted cash flow and debt to equity scores.
Scores Comparison
Here is a comparison of the Altman Z-Score and Piotroski Score for both companies:
TTD Scores
- Altman Z-Score: 4.30, indicating a safe zone with low bankruptcy risk.
- Piotroski Score: 5, reflecting average financial strength and value.
MNDY Scores
- Altman Z-Score: 6.33, indicating a safe zone with very low bankruptcy risk.
- Piotroski Score: 5, reflecting average financial strength and value.
Which company has the best scores?
Both companies fall into the safe zone for bankruptcy risk, with MNDY having a higher Altman Z-Score than TTD. Their Piotroski Scores are equal at 5, indicating similar average financial strength.
Grades Comparison
Here is a comparison of the latest reliable grades for The Trade Desk, Inc. and monday.com Ltd.:
The Trade Desk, Inc. Grades
The following table summarizes recent grades assigned by reputable grading companies for The Trade Desk, Inc.:
| Grading Company | Action | New Grade | Date |
|---|---|---|---|
| Morgan Stanley | Hold | Equal Weight | 2026-01-13 |
| Wells Fargo | Hold | Equal Weight | 2026-01-12 |
| Cantor Fitzgerald | Hold | Neutral | 2026-01-08 |
| Wolfe Research | Buy | Outperform | 2026-01-06 |
| Guggenheim | Buy | Buy | 2026-01-05 |
| Jefferies | Hold | Hold | 2025-12-11 |
| Wedbush | Hold | Neutral | 2025-12-08 |
| DA Davidson | Buy | Buy | 2025-11-10 |
| Truist Securities | Buy | Buy | 2025-11-07 |
| Wells Fargo | Hold | Equal Weight | 2025-11-07 |
The Trade Desk shows a mix of Buy and Hold grades, with a consensus rating of Buy indicating moderate positive sentiment.
monday.com Ltd. Grades
The following table summarizes recent grades assigned by reputable grading companies for monday.com Ltd.:
| Grading Company | Action | New Grade | Date |
|---|---|---|---|
| BTIG | Buy | Buy | 2026-01-15 |
| Barclays | Buy | Overweight | 2026-01-12 |
| Jefferies | Buy | Buy | 2026-01-05 |
| Citigroup | Buy | Buy | 2025-12-23 |
| Tigress Financial | Buy | Buy | 2025-12-11 |
| Baird | Buy | Outperform | 2025-11-11 |
| Wells Fargo | Buy | Overweight | 2025-11-11 |
| DA Davidson | Buy | Buy | 2025-11-11 |
| Morgan Stanley | Buy | Overweight | 2025-11-11 |
| Piper Sandler | Buy | Overweight | 2025-11-11 |
monday.com Ltd. consistently receives Buy and Overweight grades, with a consensus rating of Buy reflecting strong positive analyst confidence.
Which company has the best grades?
monday.com Ltd. has received more consistently positive grades, predominantly Buy and Overweight, compared to The Trade Desk’s mix of Buy and Hold ratings. This pattern may indicate stronger analyst conviction in monday.com Ltd.’s growth prospects, potentially influencing investor sentiment and portfolio positioning.
Strengths and Weaknesses
Below is a comparative overview of The Trade Desk, Inc. (TTD) and monday.com Ltd. (MNDY) based on key financial and strategic criteria as of 2024.
| Criterion | The Trade Desk, Inc. (TTD) | monday.com Ltd. (MNDY) |
|---|---|---|
| Diversification | Moderate; focused on programmatic advertising tech | Moderate; SaaS platform with broad application but niche in project management |
| Profitability | Favorable net margin (16.08%) and ROIC (10.02%) | Low net margin (3.33%) and negative ROIC (-1.73%) indicating value destruction |
| Innovation | Strong in fixed asset turnover (5.17) indicating efficient use of assets | Higher fixed asset turnover (7.13); improving profitability trend |
| Global presence | Well-established in digital advertising markets globally | Growing international footprint, expanding user base |
| Market Share | Leading position in programmatic ad tech | Rising market share in collaborative work management |
Key Takeaways: TTD demonstrates stronger profitability and efficient capital use, though its ROIC is declining and valuation metrics are high. MNDY struggles with profitability but shows promising growth in ROIC and asset turnover. Both companies warrant cautious consideration, balancing growth potential with current financial challenges.
Risk Analysis
Below is a comparative table highlighting key risks for The Trade Desk, Inc. (TTD) and monday.com Ltd. (MNDY) based on the latest 2024 data:
| Metric | The Trade Desk, Inc. (TTD) | monday.com Ltd. (MNDY) |
|---|---|---|
| Market Risk | Moderate beta 1.105; high P/E 146.77 signals valuation sensitivity | Higher beta 1.255; very high P/E 362.98 implies elevated market volatility risk |
| Debt level | Low debt-to-equity 0.11; strong interest coverage | Low debt-to-equity 0.10; strong interest coverage |
| Regulatory Risk | Moderate, US tech regulations impacting ad data usage | Moderate, Israel-based with international exposure and evolving data privacy laws |
| Operational Risk | Platform reliance on ad spend trends; moderate asset turnover | Moderate asset turnover; growth pressures on expanding Work OS ecosystem |
| Environmental Risk | Low direct exposure; tech sector energy use under scrutiny | Similar low direct exposure; cloud infrastructure energy consumption relevant |
| Geopolitical Risk | US-based, some exposure to global ad markets | Higher due to Israel headquarters and broad international presence |
Synthesis: The most impactful risks for both are market valuation and geopolitical exposure, with monday.com facing greater volatility and geopolitical uncertainties. The Trade Desk’s valuation is high but less volatile, supported by solid financials and low leverage. Recent market sell-offs have amplified these risks, recommending cautious position sizing.
Which Stock to Choose?
The Trade Desk, Inc. (TTD) shows a favorable income evolution with strong revenue growth and profitability improvements, supported by solid financial ratios. It maintains low debt levels, a very favorable rating, and a safe-zone Altman Z-Score, despite a slightly unfavorable MOAT indication due to declining ROIC.
monday.com Ltd. (MNDY) presents robust revenue and net income growth with a mixed income statement profile. Financial ratios are neutral overall, with manageable debt and a safe Altman Z-Score. Its MOAT is slightly unfavorable, indicating value destruction but an improving profitability trend.
For investors prioritizing growth and strong income statement performance, TTD might appear more favorable given its higher profitability and financial stability. Conversely, those valuing improving profitability and a neutral ratio profile could find MNDY more aligned with their risk tolerance and strategy. Both stocks show bearish price trends with recent deceleration.
Disclaimer: Investment carries a risk of loss of initial capital. The past performance is not a reliable indicator of future results. Be sure to understand risks before making an investment decision.
Go Further
I encourage you to read the complete analyses of The Trade Desk, Inc. and monday.com Ltd. to enhance your investment decisions: