Home > Comparison > Technology > TXN vs ADI
The strategic rivalry between Texas Instruments Incorporated and Analog Devices, Inc. shapes the semiconductor industry’s evolution. Texas Instruments operates as a diversified analog and embedded processing powerhouse. Analog Devices focuses on high-performance mixed-signal and digital signal processing solutions. This juxtaposition highlights a contest between broad market reach and specialized innovation. This analysis aims to determine which company’s strategy offers superior risk-adjusted returns for a diversified portfolio in today’s dynamic technology sector.
Table of contents
Companies Overview
Texas Instruments and Analog Devices dominate the semiconductor landscape with distinct market approaches and technological focuses.
Texas Instruments Incorporated: Powering Analog and Embedded Innovation
Texas Instruments leads in analog and embedded processing semiconductors, generating revenue through power management and signal chain products. Its products serve industrial, automotive, and communications sectors. In 2026, Texas Instruments emphasizes expanding its embedded processing capabilities and optimizing power-efficient solutions, reinforcing its competitive edge in core analog markets.
Analog Devices, Inc.: Mastering Signal Conversion and Processing
Analog Devices specializes in integrated circuits and mixed-signal technologies, focusing on data converters, amplifiers, and power management ICs. It targets automotive, industrial, and aerospace sectors. In 2026, Analog Devices prioritizes innovation in high-performance analog and digital signal processing, enhancing product integration and expanding applications in wireless infrastructure and sensing technologies.
Strategic Collision: Similarities & Divergences
Both firms excel in analog semiconductor innovation but diverge in strategy: Texas Instruments champions a broad embedded systems approach, while Analog Devices focuses on high-precision signal processing and integration. Their primary battleground is industrial and automotive markets where power efficiency and signal fidelity compete fiercely. Investors will find Texas Instruments offers stability through scale, whereas Analog Devices presents growth potential via cutting-edge niche technologies.
Income Statement Comparison
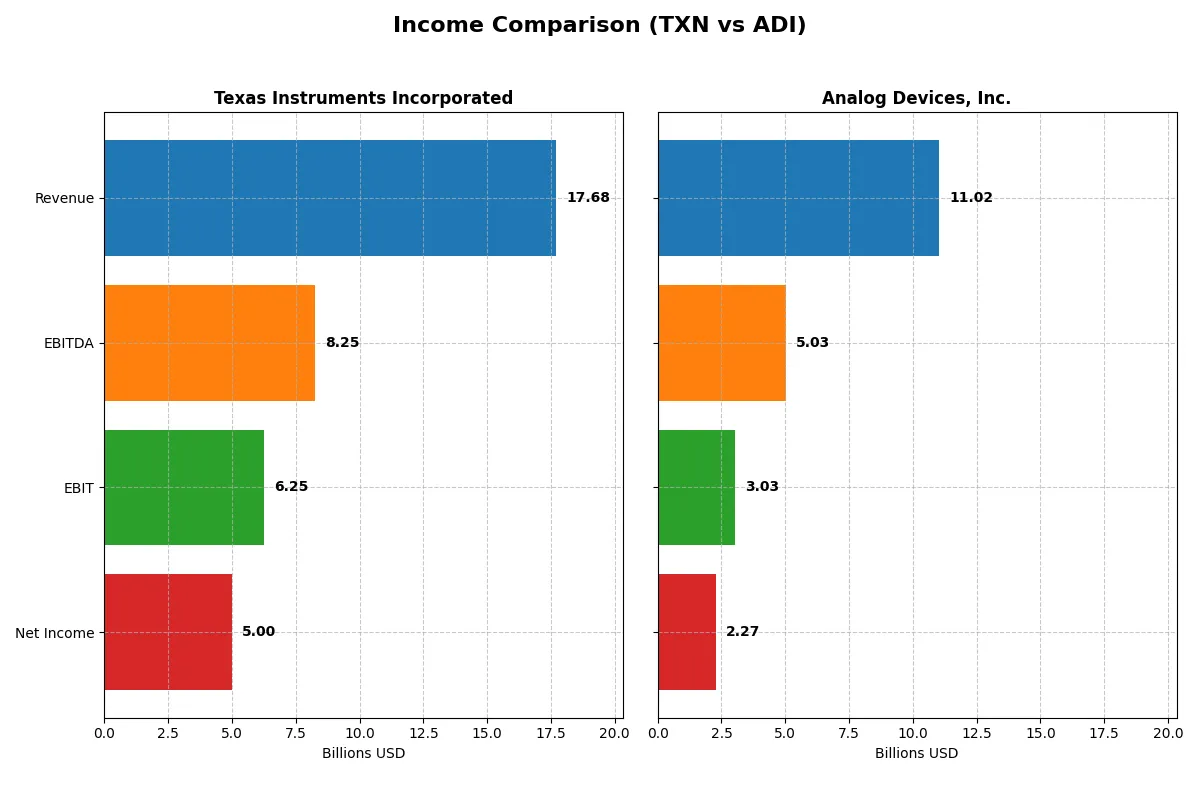
This data dissects the core profitability and scalability of both corporate engines to reveal who dominates the bottom line:
| Metric | Texas Instruments Incorporated (TXN) | Analog Devices, Inc. (ADI) |
|---|---|---|
| Revenue | 17.7B | 11.0B |
| Cost of Revenue | 7.6B | 5.0B |
| Operating Expenses | 4.1B | 3.0B |
| Gross Profit | 10.1B | 6.0B |
| EBITDA | 8.3B | 5.0B |
| EBIT | 6.3B | 3.0B |
| Interest Expense | 543M | 318M |
| Net Income | 5.0B | 2.3B |
| EPS | 5.45 | 4.59 |
| Fiscal Year | 2025 | 2025 |
Income Statement Analysis: The Bottom-Line Duel
This income statement comparison reveals which company runs a more efficient and profitable corporate engine in the current market environment.
Texas Instruments Incorporated Analysis
Texas Instruments’ revenue shows volatility, falling from 20B in 2022 to 17.7B in 2025, with net income declining even more sharply. Its gross margin remains strong above 57%, while net margin hovers near 28%, indicating solid profitability despite shrinking top-line. The 2025 year reveals efficiency in managing costs, yet net income growth is negative overall, signaling margin pressure.
Analog Devices, Inc. Analysis
Analog Devices posts steady revenue growth, rising from 7.3B in 2021 to 11B in 2025. Gross margin holds favorable at about 54.7%, with net margin at 20.6%, slightly below Texas Instruments but improving. The company demonstrates strong momentum in 2025 with double-digit revenue and net income growth, reflecting effective operational leverage and expanding profitability.
Sustained Scale vs. Accelerated Growth
Texas Instruments commands higher margins and a larger scale but struggles with declining net income over recent years. Analog Devices, while smaller, delivers robust revenue and bottom-line growth, improving margins steadily. Investors seeking stable profitability may favor Texas Instruments; those prioritizing growth and momentum might find Analog Devices more appealing.
Financial Ratios Comparison
These vital ratios act as a diagnostic tool to expose the underlying fiscal health, valuation premiums, and capital efficiency of each company:
| Ratios | Texas Instruments (TXN) | Analog Devices (ADI) |
|---|---|---|
| ROE | 30.7% | 6.7% |
| ROIC | 16.5% | 5.5% |
| P/E | 31.5 | 51.1 |
| P/B | 9.7 | 3.4 |
| Current Ratio | 4.35 | 2.19 |
| Quick Ratio | 2.83 | 1.68 |
| D/E | 0.86 | 0.26 |
| Debt-to-Assets | 40.6% | 18.1% |
| Interest Coverage | 11.1 | 9.5 |
| Asset Turnover | 0.51 | 0.23 |
| Fixed Asset Turnover | 1.44 | 3.32 |
| Payout Ratio | 100% | 85% |
| Dividend Yield | 3.17% | 1.66% |
| Fiscal Year | 2025 | 2025 |
Efficiency & Valuation Duel: The Vital Signs
Financial ratios act as a company’s DNA, revealing hidden risks and operational excellence critical for investment insights.
Texas Instruments Incorporated
Texas Instruments delivers strong profitability with a 30.7% ROE and a healthy 28.3% net margin. However, its valuation appears stretched, with a P/E of 31.5 and a P/B near 9.7. The company supports shareholders via a solid 3.2% dividend yield, balancing payout with ongoing R&D reinvestment at 11.8% of revenue.
Analog Devices, Inc.
Analog Devices shows moderate profitability, with a low 6.7% ROE and a 20.6% net margin. Its valuation is expensive, marked by a P/E of 51.1 despite a lower P/B of 3.4. ADI maintains shareholder value through modest dividends at 1.7%, while prioritizing higher R&D spending near 16% of revenue for growth.
Premium Valuation vs. Operational Safety
Texas Instruments offers superior profitability and a balanced dividend, though at a stretched valuation. Analog Devices trades at a higher premium with weaker returns but invests heavily in innovation. Investors seeking operational strength might favor Texas Instruments; those chasing growth may lean toward Analog Devices.
Which one offers the Superior Shareholder Reward?
I see Texas Instruments (TXN) offers a more balanced and sustainable shareholder reward than Analog Devices (ADI). TXN yields 3.17% with a near-100% dividend payout but maintains free cash flow coverage at 75%. Its buyback program complements dividends, enhancing total returns. ADI yields only 1.66%, pays nearly 85% of earnings in dividends, but supports a stronger buyback effort with 89% free cash flow coverage. TXN’s higher yield and robust cash flow coverage make its distribution model more sustainable. ADI’s lower yield and high payout ratio raise concerns about long-term dividend security. Historically, TXN’s disciplined capital allocation and steady buybacks align better with total return investors. I conclude TXN offers the superior total return profile for 2026 investors.
Comparative Score Analysis: The Strategic Profile
The radar chart reveals the fundamental DNA and trade-offs of Texas Instruments and Analog Devices, highlighting their financial strengths and valuation nuances:
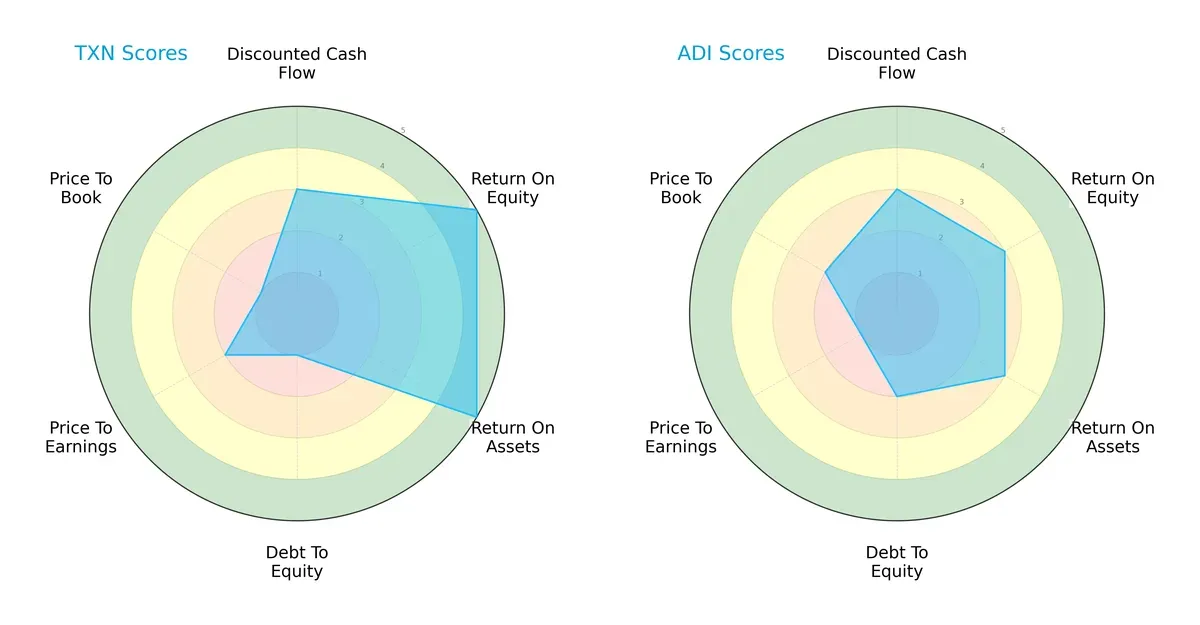
Texas Instruments leads with superior ROE and ROA scores (5 vs. 3), demonstrating exceptional profitability and asset efficiency. However, its debt-to-equity score is very unfavorable (1), signaling higher leverage risk. Analog Devices presents a more cautious capital structure with a better debt-to-equity score (2) but lags in profitability and valuation metrics. Overall, Texas Instruments exhibits a more unbalanced profile relying on operational excellence, while Analog Devices shows a more conservative but less efficient financial stance.
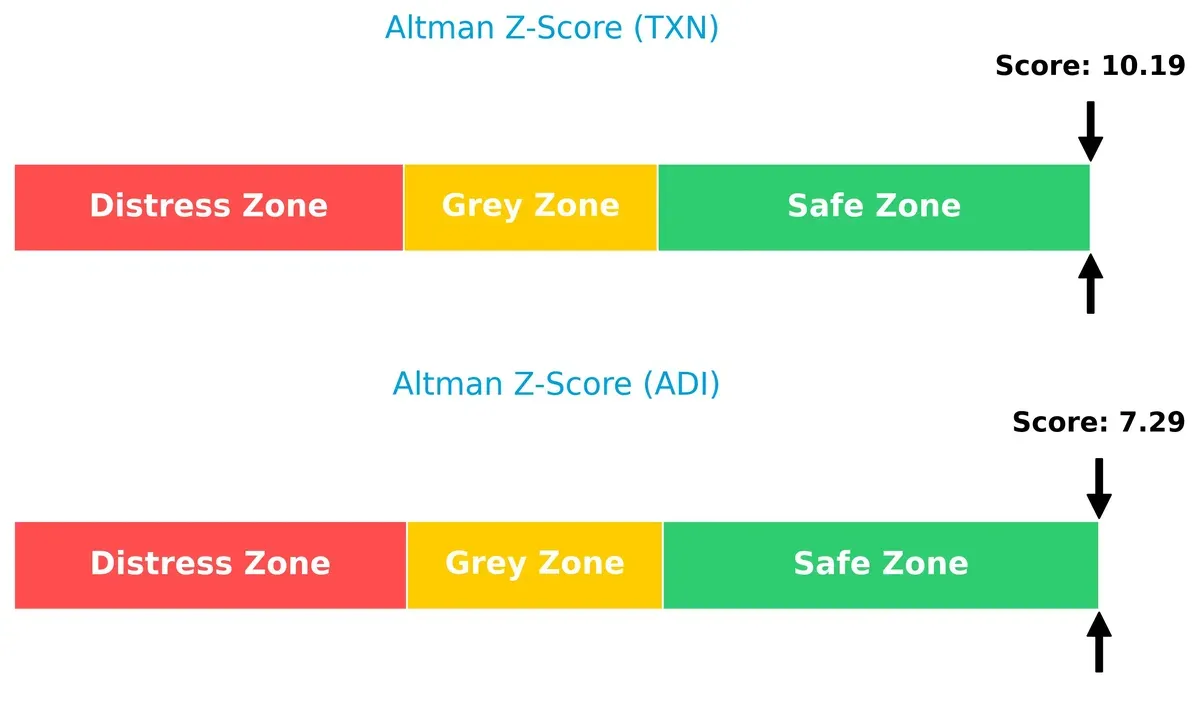
Bankruptcy Risk: Solvency Showdown
Texas Instruments’ Altman Z-Score of 10.19 far exceeds Analog Devices’ 7.29, indicating a stronger buffer against bankruptcy risks in this late-cycle environment:
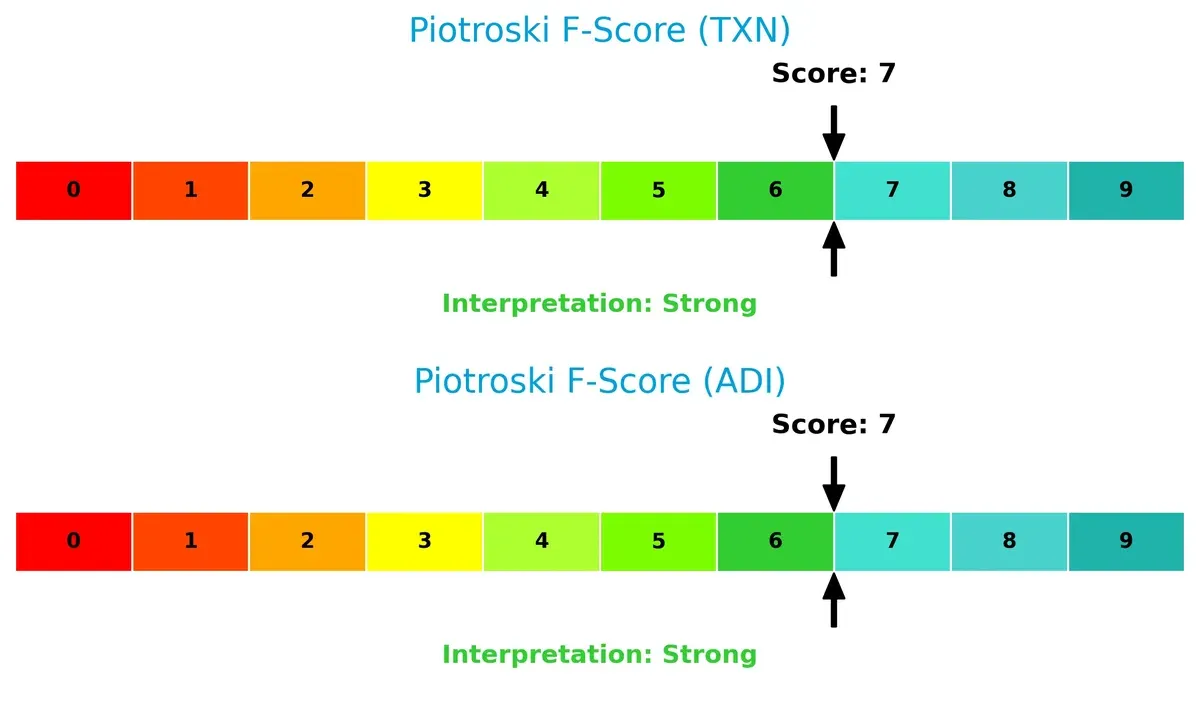
Financial Health: Quality of Operations
Both companies share a strong Piotroski F-Score of 7, reflecting solid internal financial health and operational quality with no glaring red flags:
How are the two companies positioned?
This section dissects TXN and ADI’s operational DNA by comparing revenue distribution across segments and analyzing their internal strengths and weaknesses. The aim is to confront their economic moats and identify which model offers the most resilient, sustainable competitive advantage today.
Revenue Segmentation: The Strategic Mix
This visual comparison dissects how Texas Instruments and Analog Devices diversify their income streams and where their primary sector bets lie:
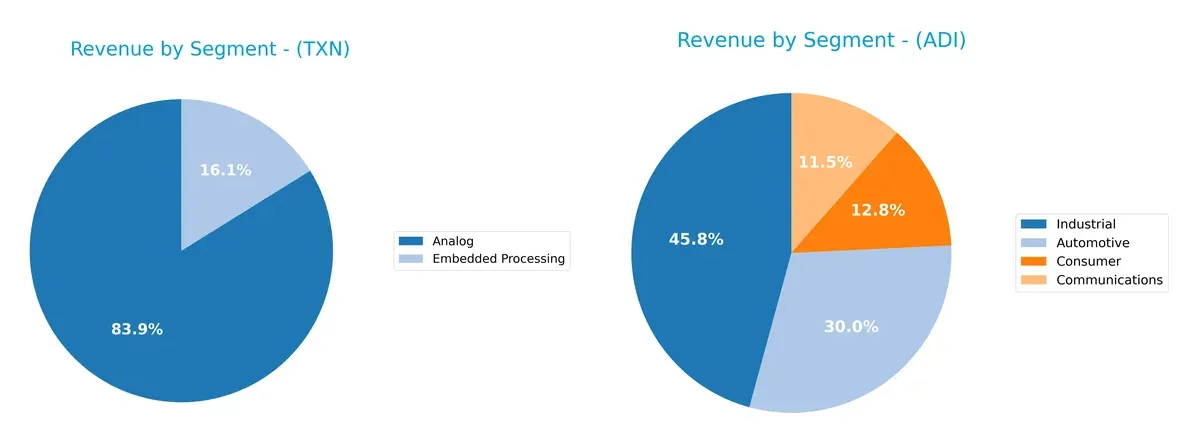
Texas Instruments anchors its revenue on Analog at $14B in 2025, with Embedded Processing contributing $2.7B. Analog Devices shows a more diversified mix, with Industrial at $4.3B, Automotive $2.8B, Consumer $1.2B, and Communications $1.1B. TXN’s concentration in Analog signals infrastructure dominance but poses concentration risk. ADI’s spread reduces dependence on any single segment, enhancing resilience amid sector shifts.
Strengths and Weaknesses Comparison
This table compares the Strengths and Weaknesses of Texas Instruments and Analog Devices based on key financial and operational metrics:
Texas Instruments Strengths
- High net margin at 28.28%
- Strong ROE of 30.73%
- Robust quick ratio at 2.83
- Solid interest coverage at 11.52x
- Diverse revenue streams with Analog and Embedded Processing
- Significant US and China market exposure
Analog Devices Strengths
- Favorable net margin at 20.58%
- Strong current ratio at 2.19
- Low debt-to-equity at 0.26 indicating conservative leverage
- High fixed asset turnover at 3.32
- Diversified end markets including Automotive and Industrial
- Balanced geographic exposure with strong US presence
Texas Instruments Weaknesses
- Unfavorable P/E at 31.53 and P/B at 9.69, indicating expensive valuation
- High current ratio at 4.35 may suggest inefficient asset use
- Moderate debt-to-assets at 40.62%
- Neutral asset turnover at 0.51
- P/E ratio unfavorable compared to sector benchmarks
Analog Devices Weaknesses
- Low ROE at 6.7%, significantly below sector average
- Unfavorable P/E at 51.05 and P/B at 3.42
- Low asset turnover at 0.23 points to less efficient asset use
- Dividend yield neutral at 1.66%
- Higher proportion of unfavorable ratios at 28.57%
Both companies exhibit slightly favorable overall ratio profiles but differ in capital efficiency and profitability metrics. Texas Instruments excels in profitability and balance sheet strength but faces valuation and asset use concerns. Analog Devices shows prudent leverage and asset turnover strengths but lags in return on equity and valuation metrics. These contrasts highlight distinct strategic and financial positioning challenges each must address.
The Moat Duel: Analyzing Competitive Defensibility
A structural moat is the only barrier protecting long-term profits from relentless competition erosion. Let’s examine two semiconductor giants’ moats:
Texas Instruments Incorporated: Cost Advantage Fortress
Texas Instruments leverages a strong cost advantage moat, maintaining a high ROIC above WACC. Its margin stability supports value creation, though ROIC is declining. New analog product expansions could deepen this moat in 2026.
Analog Devices, Inc.: Innovation-Driven Growth Moat
Analog Devices relies on innovation and product integration, reflected in a growing ROIC trend despite current value destruction. Its expanding market footprint and technology upgrades signal potential to strengthen its moat in 2026.
Cost Leadership vs. Innovation Momentum
Texas Instruments holds a wider moat with consistent value creation and superior margins. However, Analog Devices’ rising ROIC trend suggests increasing competitive strength. TI is currently better positioned to defend market share long term.
Which stock offers better returns?
Both Texas Instruments Incorporated and Analog Devices, Inc. show strong upward price momentum over the past year, with significant gains and notable acceleration in their stock trends.
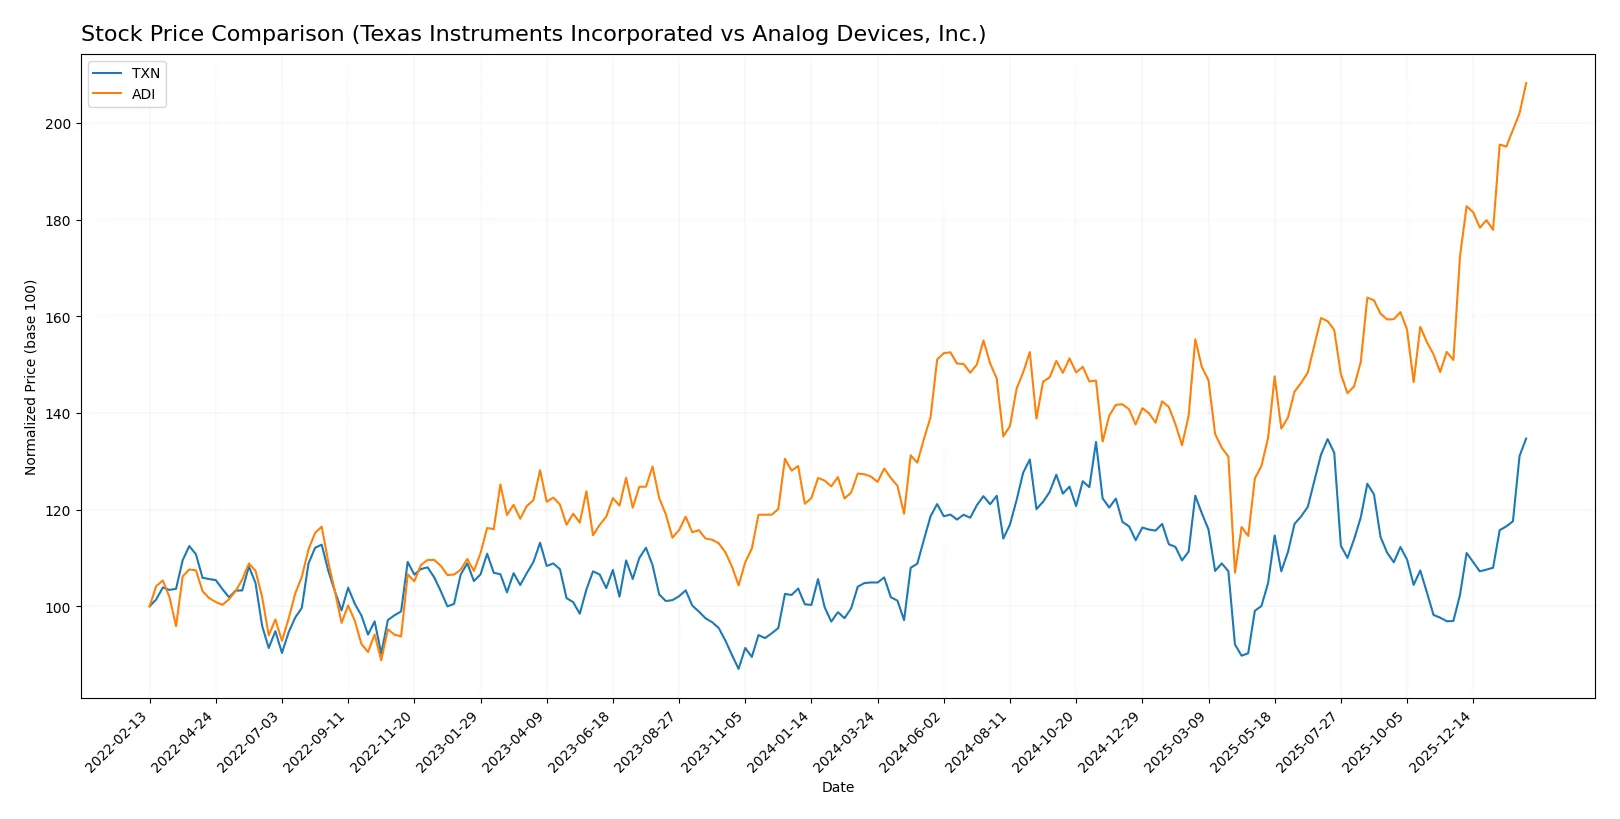
Trend Comparison
Texas Instruments’ stock price rose 28.36% over the past 12 months, showing a bullish trend with accelerating momentum and a high of 221.44. Volatility is moderate with a standard deviation of 16.2.
Analog Devices gained 64.16% in the same period, also bullish with accelerating momentum and a peak price of 320.45. It exhibits higher volatility, reflected in a standard deviation of 27.77.
Analog Devices’ trend outperforms Texas Instruments’, delivering higher market returns despite greater volatility. Both show acceleration, but ADI leads in total price appreciation.
Target Prices
Analysts present a balanced target consensus for Texas Instruments Incorporated and Analog Devices, Inc.
| Company | Target Low | Target High | Consensus |
|---|---|---|---|
| Texas Instruments Incorporated | 160 | 260 | 204.64 |
| Analog Devices, Inc. | 270 | 375 | 316 |
The consensus for Texas Instruments sits below its current price of 221.44, signaling cautious optimism. Analog Devices’ target consensus of 316 slightly exceeds its current price of 320.45, suggesting a stable valuation near market levels.

Don’t Let Luck Decide Your Entry Point
Optimize your entry points with our advanced ProRealTime indicators. You’ll get efficient buy signals with precise price targets for maximum performance. Start outperforming now!
How do institutions grade them?
Texas Instruments Incorporated Grades
Here are the most recent grades assigned by reputable analysts for Texas Instruments Incorporated:
| Grading Company | Action | New Grade | Date |
|---|---|---|---|
| Rosenblatt | Maintain | Buy | 2026-02-05 |
| Rosenblatt | Maintain | Buy | 2026-01-28 |
| Goldman Sachs | Maintain | Sell | 2026-01-28 |
| Deutsche Bank | Maintain | Hold | 2026-01-28 |
| Keybanc | Maintain | Overweight | 2026-01-28 |
| Stifel | Maintain | Hold | 2026-01-28 |
| Benchmark | Maintain | Buy | 2026-01-28 |
| Jefferies | Maintain | Hold | 2026-01-28 |
| B of A Securities | Upgrade | Neutral | 2026-01-28 |
| Wells Fargo | Maintain | Equal Weight | 2026-01-28 |
Analog Devices, Inc. Grades
The following table shows the latest institutional grades for Analog Devices, Inc.:
| Grading Company | Action | New Grade | Date |
|---|---|---|---|
| Susquehanna | Maintain | Positive | 2026-01-22 |
| B of A Securities | Maintain | Buy | 2026-01-21 |
| Stifel | Maintain | Buy | 2026-01-16 |
| Oppenheimer | Maintain | Outperform | 2026-01-16 |
| Wells Fargo | Upgrade | Overweight | 2026-01-15 |
| Citigroup | Maintain | Buy | 2026-01-15 |
| Keybanc | Maintain | Overweight | 2026-01-13 |
| Truist Securities | Maintain | Hold | 2025-12-19 |
| UBS | Maintain | Buy | 2025-12-08 |
| Wells Fargo | Maintain | Equal Weight | 2025-11-26 |
Which company has the best grades?
Analog Devices holds generally stronger grades, including multiple Buy and Outperform ratings. Texas Instruments shows mixed ratings with some Sell and Neutral grades. This disparity could influence investor sentiment and portfolio weighting decisions.
Risks specific to each company
The following categories identify the critical pressure points and systemic threats facing both firms in the 2026 market environment:
1. Market & Competition
Texas Instruments Incorporated
- Dominates analog and embedded processing markets with strong brand and scale advantages.
Analog Devices, Inc.
- Operates in mixed-signal and digital signal processing with high-performance niche focus but faces intense competition.
2. Capital Structure & Debt
Texas Instruments Incorporated
- Debt-to-equity ratio at 0.86 signals moderate leverage but raises some financial risk concerns.
Analog Devices, Inc.
- Low debt-to-equity at 0.26 indicates conservative financial structure and stronger balance sheet resilience.
3. Stock Volatility
Texas Instruments Incorporated
- Beta near 1.0 suggests stock moves in line with the market, reflecting stable volatility.
Analog Devices, Inc.
- Slightly higher beta at 1.03 implies marginally greater sensitivity to market swings.
4. Regulatory & Legal
Texas Instruments Incorporated
- Faces standard semiconductor industry regulatory scrutiny in US and global markets.
Analog Devices, Inc.
- Operates in multiple jurisdictions with increasing compliance demands in technology export controls.
5. Supply Chain & Operations
Texas Instruments Incorporated
- Benefits from established, diversified supply chain but exposed to global semiconductor shortages.
Analog Devices, Inc.
- More reliant on specialized components, heightening vulnerability to supply disruptions.
6. ESG & Climate Transition
Texas Instruments Incorporated
- Investing in sustainable manufacturing but must navigate evolving environmental regulations.
Analog Devices, Inc.
- ESG initiatives progressing but lagging peers in emission reduction targets and reporting transparency.
7. Geopolitical Exposure
Texas Instruments Incorporated
- Significant exposure to US-China tensions impacting supply and sales in Asian markets.
Analog Devices, Inc.
- Also exposed but with a slightly more diversified global footprint reducing concentrated geopolitical risk.
Which company shows a better risk-adjusted profile?
Texas Instruments faces its largest risk in capital structure with moderate leverage raising financial risk. Analog Devices’ most impactful risk lies in market competition and pricing pressures amid a niche focus. Overall, Analog Devices shows a better risk-adjusted profile with a stronger balance sheet and lower debt. However, TI’s stable market position and safer Altman Z-score offer some risk mitigation. Recent data confirms Analog Devices’ lower debt-to-assets ratio (18%) versus TI’s 41%, justifying concern over TI’s leverage.
Final Verdict: Which stock to choose?
Texas Instruments’ superpower lies in its robust cash generation and high capital efficiency. Its strong ROIC well above WACC signals value creation, but a declining profitability trend is a point of vigilance. TXN suits portfolios seeking steady income with moderate growth—think Dividend Growth or Core Holdings.
Analog Devices benefits from a strategic moat grounded in accelerating profitability and aggressive R&D spend. Its improving ROIC trajectory contrasts with current value destruction, reflecting growth investments. ADI offers a safer liquidity profile and fits Growth-at-a-Reasonable-Price (GARP) portfolios aiming for capital appreciation with controlled risk.
If you prioritize reliable cash flow and proven capital efficiency, Texas Instruments is the compelling choice due to its established value creation despite profitability pressures. However, if you seek growth backed by improving returns and innovation, Analog Devices offers superior momentum and growth potential, albeit with a higher valuation premium. Each scenario demands cautious risk assessment aligned with your investment horizon.
Disclaimer: Investment carries a risk of loss of initial capital. The past performance is not a reliable indicator of future results. Be sure to understand risks before making an investment decision.
Go Further
I encourage you to read the complete analyses of Texas Instruments Incorporated and Analog Devices, Inc. to enhance your investment decisions: