Teradata Corporation and Domo, Inc. are two prominent players in the technology sector, specializing in data-driven software solutions. Teradata focuses on multi-cloud data platforms for enterprise analytics, while Domo offers a cloud-based business intelligence platform connecting all organizational levels. Their overlapping markets and innovation strategies make them ideal candidates for comparison. In this article, I will help you determine which company presents a more compelling investment opportunity.
Table of contents
Companies Overview
I will begin the comparison between Teradata Corporation and Domo, Inc. by providing an overview of these two companies and their main differences.
Teradata Corporation Overview
Teradata Corporation provides a connected multi-cloud data platform designed for enterprise analytics. Its flagship product, Teradata Vantage, enables companies to leverage and integrate data across various sources, simplifying ecosystems and supporting cloud migration. Serving sectors like financial services, healthcare, and telecommunications, Teradata operates globally with a focus on delivering data and analytic infrastructure value.
Domo, Inc. Overview
Domo, Inc. operates a cloud-based business intelligence platform that connects people, data, and systems within organizations to provide real-time insights accessible even via smartphones. Headquartered in Utah, Domo targets users across different levels of an organization, aiming to enhance decision-making through digital connectivity. The company serves both the U.S. and international markets with a focus on application software.
Key similarities and differences
Both companies operate in the technology sector, focusing on data and analytics solutions delivered through cloud platforms. Teradata specializes in infrastructure software supporting enterprise-scale multi-cloud environments, while Domo emphasizes application software that facilitates real-time business intelligence and user connectivity. Teradata’s client base is broader and more diverse across industries, whereas Domo targets organizational decision-makers with mobile-accessible insights.
Income Statement Comparison
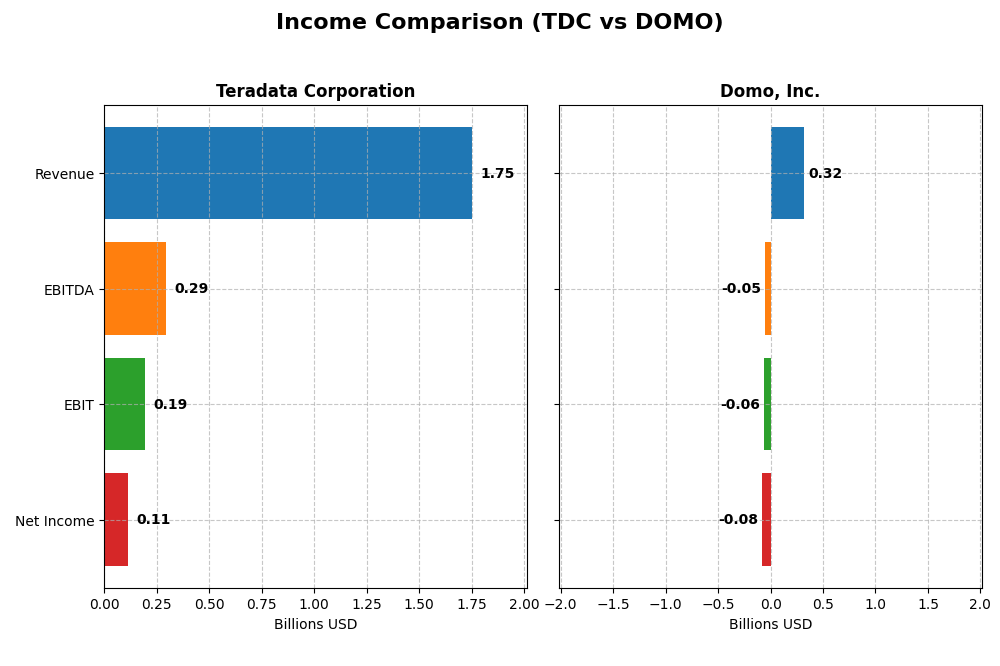
The table below presents a side-by-side comparison of the most recent fiscal year income statement figures for Teradata Corporation and Domo, Inc., highlighting key financial metrics.
| Metric | Teradata Corporation (TDC) | Domo, Inc. (DOMO) |
|---|---|---|
| Market Cap | 2.82B | 334M |
| Revenue | 1.75B | 318M |
| EBITDA | 293M | -50M |
| EBIT | 193M | -59M |
| Net Income | 114M | -82M |
| EPS | 1.18 | -2.13 |
| Fiscal Year | 2024 | 2025 |
Income Statement Interpretations
Teradata Corporation
Teradata’s revenue experienced a slight decline over 2020-2024, falling by 4.68%, while net income decreased by 11.63%. Despite this, the company maintained favorable gross margin at 60.46% and improved EBIT margin to 11.03% in 2024. The latest year showed a 31.29% rise in EBIT and a 92.59% jump in net margin, reflecting improved profitability despite revenue softness.
Domo, Inc.
Domo posted a 50.84% revenue increase over 2021-2025 but continued to report negative net income, with a slight 3.19% net income growth overall. The gross margin remained favorable at 74.45%, yet EBIT and net margins stayed deeply negative at -18.7% and -25.84%, respectively. The most recent year saw small declines in revenue and profitability, with EBIT down 9.52% and net margin shrinking by 9.09%.
Which one has the stronger fundamentals?
Teradata exhibits stronger fundamentals with positive EBIT and net margins, supported by margin improvements and earnings growth in its latest fiscal year despite revenue decline. Domo’s higher revenue growth contrasts with sustained losses and negative margins, indicating ongoing profitability challenges. Teradata’s financials reflect more consistent profitability and margin stability, suggesting a comparatively firmer income statement foundation.
Financial Ratios Comparison
Below is a comparison of key financial ratios for Teradata Corporation and Domo, Inc. based on the most recent fiscal year data available.
| Ratios | Teradata Corporation (2024) | Domo, Inc. (2025) |
|---|---|---|
| ROE | 85.7% | 46.2% |
| ROIC | 16.9% | 197.6% |
| P/E | 26.3 | -3.98 |
| P/B | 22.6 | -1.84 |
| Current Ratio | 0.81 | 0.56 |
| Quick Ratio | 0.79 | 0.56 |
| D/E | 4.33 | -0.76 |
| Debt-to-Assets | 33.8% | 63.2% |
| Interest Coverage | 7.21 | -2.99 |
| Asset Turnover | 1.03 | 1.48 |
| Fixed Asset Turnover | 9.07 | 8.17 |
| Payout ratio | 0% | 0% |
| Dividend yield | 0% | 0% |
Interpretation of the Ratios
Teradata Corporation
Teradata shows a mixed ratio profile with strong return on equity (85.71%) and return on invested capital (16.89%), indicating efficient capital use. However, concerns arise from its weak liquidity ratios (current ratio 0.81) and high price multiples (PE 26.34, PB 22.58). The company does not pay dividends, likely focusing on reinvestment and growth, as indicated by zero dividend yield and payout.
Domo, Inc.
Domo presents a challenging ratio set, with a negative net margin (-25.84%) and poor liquidity (current ratio 0.56). Favorable metrics include a high return on invested capital (197.65%) and positive equity returns (46.23%). The firm does not distribute dividends, reflecting a high-growth or reinvestment phase, supported by negative earnings yield and dividend yield at zero.
Which one has the best ratios?
Both companies receive a neutral overall rating, balancing favorable and unfavorable metrics. Teradata demonstrates steadier profitability and capital efficiency but weaker liquidity and valuation. Domo shows strong capital returns despite losses and liquidity concerns. Neither company offers dividends, reflecting their current strategic priorities.
Strategic Positioning
This section compares the strategic positioning of Teradata Corporation and Domo, Inc., including market position, key segments, and exposure to technological disruption:
Teradata Corporation
- Established player in software infrastructure with NYSE listing and $2.8B market cap, facing moderate competitive pressure.
- Diverse revenue streams: consulting, recurring products/services, subscription software, plus broad sector coverage including financial, government, healthcare.
- Operates in multi-cloud data analytics, supporting cloud migration and ecosystem integration, indicating moderate exposure to cloud disruption.
Domo, Inc.
- Smaller NASDAQ-listed software application firm with $334M market cap, facing higher competitive volatility.
- Primarily subscription-based cloud BI platform focused on real-time data access and mobile management, with professional services.
- Cloud-native business intelligence platform leveraging mobile and real-time data, highly exposed to evolving cloud and app technologies.
Teradata Corporation vs Domo, Inc. Positioning
Teradata adopts a diversified approach with multiple revenue streams and broad sector exposure, offering stability but potential complexity. Domo focuses on a concentrated cloud BI subscription model, enabling agility but higher reliance on a single segment. Both address cloud trends differently.
Which has the best competitive advantage?
Both companies show very favorable MOAT evaluations with growing ROIC exceeding WACC, indicating durable competitive advantages. Teradata’s larger scale offers scale benefits, while Domo’s rapid ROIC growth suggests strong value creation in a niche market.
Stock Comparison
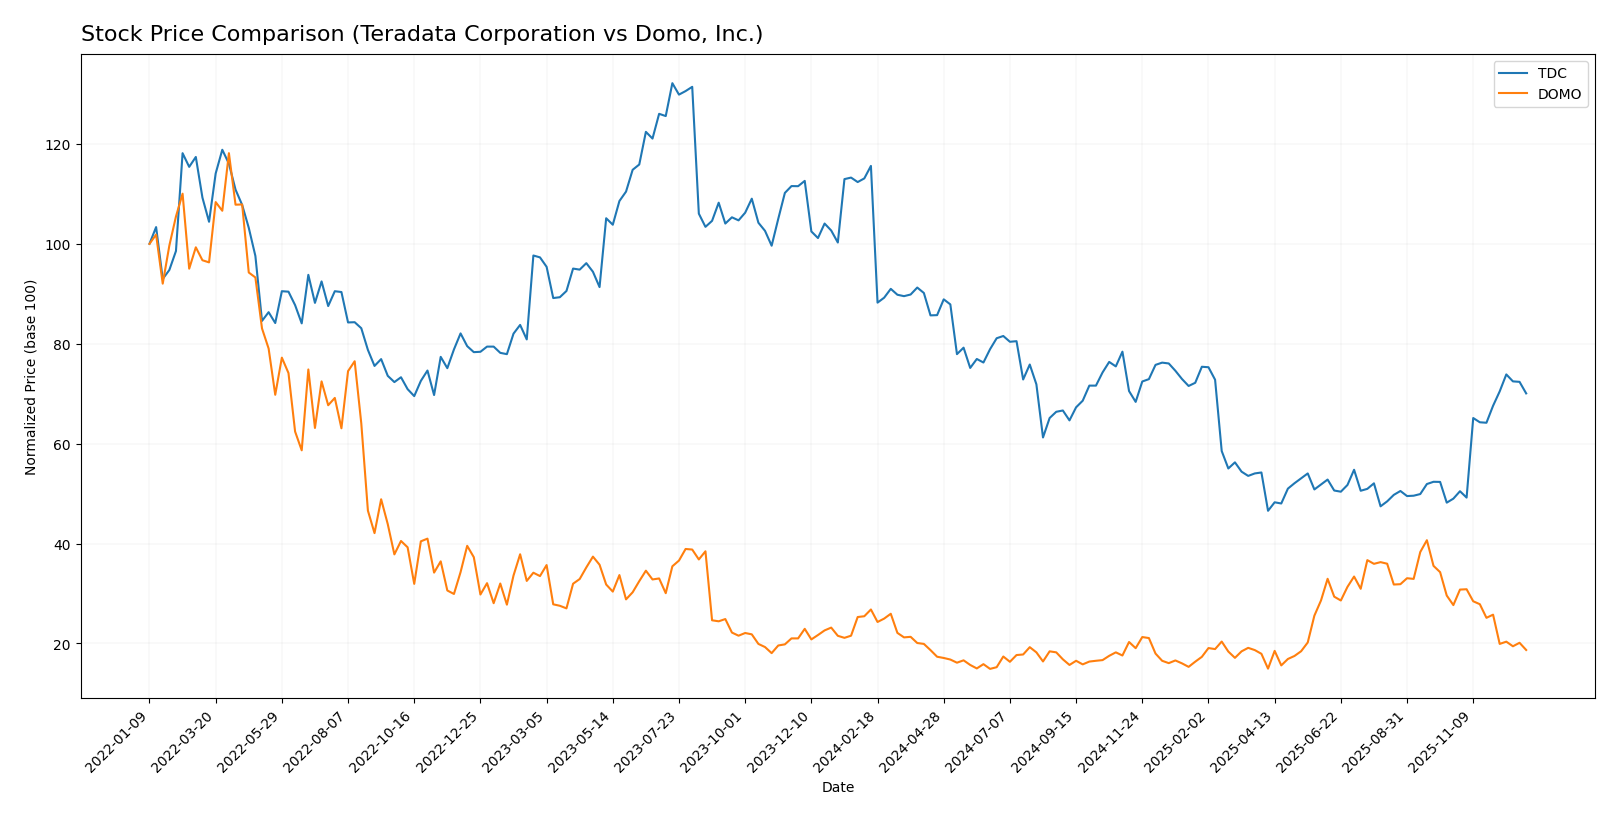
The past year’s trading dynamics reveal significant declines for both Teradata Corporation and Domo, Inc., with Teradata showing recent strong recovery while Domo continues to weaken.
Trend Analysis
Teradata Corporation’s stock experienced a bearish trend over the past 12 months, declining by 39.4% with accelerating downward momentum and notable volatility (std deviation 6.06). The recent quarter shows a sharp rebound of 43.02%, indicating a strong positive shift.
Domo, Inc. also faced a bearish trend over the same 12-month span, falling 30.25% with decelerating losses and lower volatility (std deviation 2.99). Its recent trend remains negative, dropping an additional 32.47%, reflecting ongoing weakness.
Comparing the two, Teradata’s stock delivered the highest market performance recently due to its strong recovery, despite a larger overall decline than Domo over the full year.
Target Prices
The target price consensus for Teradata Corporation and Domo, Inc. indicates moderate upside potential.
| Company | Target High | Target Low | Consensus |
|---|---|---|---|
| Teradata Corporation | 35 | 24 | 29.5 |
| Domo, Inc. | 13 | 10 | 11.5 |
Analysts expect Teradata’s stock price to hold near current levels with some upside, as the consensus target of 29.5 closely matches its current price of 29.69 USD. Domo’s consensus target of 11.5 suggests a significant potential gain from its current 8.3 USD price, indicating more optimistic growth expectations.
Analyst Opinions Comparison
This section compares analysts’ ratings and grades for Teradata Corporation and Domo, Inc.:
Rating Comparison
Teradata Corporation Rating
- Rating: B+, considered very favorable by analysts.
- Discounted Cash Flow Score: 4, indicating a favorable valuation based on future cash flows.
- ROE Score: 5, showing very favorable efficiency in generating profit from equity.
- ROA Score: 4, reflecting favorable asset utilization for earnings.
- Debt To Equity Score: 1, marked as very unfavorable, indicating higher financial risk.
- Overall Score: 3, rated as moderate overall financial standing.
Domo, Inc. Rating
- Rating: C, also noted as very favorable by analysts.
- Discounted Cash Flow Score: 1, signaling a very unfavorable valuation.
- ROE Score: 5, equally very favorable at generating profit from equity.
- ROA Score: 1, indicating very unfavorable asset utilization.
- Debt To Equity Score: 1, also very unfavorable, showing financial risk.
- Overall Score: 2, rated moderate but lower than Teradata’s score.
Which one is the best rated?
Teradata holds a higher overall rating (B+ vs. C) and better scores in discounted cash flow and return on assets, despite both having poor debt to equity scores. Based strictly on provided data, Teradata is better rated overall.
Scores Comparison
Here is a comparison of the Altman Z-Score and Piotroski Score for the two companies:
TDC Scores
- Altman Z-Score: 0.65, in distress zone indicating high bankruptcy risk.
- Piotroski Score: 8, classified as very strong financial health.
DOMO Scores
- Altman Z-Score: -10.04, also in distress zone with very high bankruptcy risk.
- Piotroski Score: 3, classified as very weak financial health.
Which company has the best scores?
TDC shows a better Piotroski Score of 8, indicating stronger financial health, while both companies are in the Altman Z-Score distress zone. DOMO’s scores suggest higher financial risk and weaker fundamentals.
Grades Comparison
The following tables present recent grades from recognized financial institutions for Teradata Corporation and Domo, Inc.:
Teradata Corporation Grades
This table summarizes recent actionable grades from reputable grading companies for Teradata Corporation.
| Grading Company | Action | New Grade | Date |
|---|---|---|---|
| Morgan Stanley | Maintain | Overweight | 2025-12-17 |
| Citizens | Upgrade | Market Outperform | 2025-11-10 |
| Barclays | Maintain | Underweight | 2025-11-05 |
| Evercore ISI Group | Maintain | Outperform | 2025-11-05 |
| TD Cowen | Maintain | Hold | 2025-11-05 |
| UBS | Maintain | Neutral | 2025-08-06 |
| Guggenheim | Maintain | Buy | 2025-05-07 |
| Barclays | Maintain | Underweight | 2025-04-21 |
| Citizens Capital Markets | Maintain | Market Perform | 2025-03-18 |
| JMP Securities | Maintain | Market Perform | 2025-02-13 |
Overall, Teradata’s grades show a mix of overweight, outperform, buy, and market perform ratings with some underweight assessments, indicating varied analyst sentiment.
Domo, Inc. Grades
This table shows recent grades from established grading firms for Domo, Inc.
| Grading Company | Action | New Grade | Date |
|---|---|---|---|
| DA Davidson | Maintain | Neutral | 2025-12-05 |
| TD Cowen | Maintain | Buy | 2025-12-05 |
| Lake Street | Maintain | Hold | 2025-12-05 |
| DA Davidson | Maintain | Neutral | 2025-12-01 |
| JMP Securities | Maintain | Market Outperform | 2025-09-10 |
| DA Davidson | Maintain | Neutral | 2025-08-28 |
| Cantor Fitzgerald | Maintain | Overweight | 2025-08-28 |
| TD Cowen | Upgrade | Buy | 2025-08-26 |
| JMP Securities | Maintain | Market Outperform | 2025-06-25 |
| Cantor Fitzgerald | Maintain | Overweight | 2025-06-25 |
Domo’s grades predominantly range from buy and market outperform to overweight and neutral, showing generally positive analyst views with consistent maintenance of these ratings.
Which company has the best grades?
Domo, Inc. has received generally more positive and consistent grades, including multiple buy and market outperform ratings, whereas Teradata Corporation shows more mixed ratings with some underweight grades. This suggests investors might perceive Domo as having stronger growth prospects or stability based on current analyst sentiment.
Strengths and Weaknesses
Below is a comparative overview of the key strengths and weaknesses of Teradata Corporation (TDC) and Domo, Inc. (DOMO) based on their recent financial and operational data.
| Criterion | Teradata Corporation (TDC) | Domo, Inc. (DOMO) |
|---|---|---|
| Diversification | Broad revenue streams across consulting, recurring services, and subscription software; strong product-service mix totaling over 3B USD in recurring revenues | Revenue mainly from subscription and professional services, less diversified with total around 315M USD subscription revenue |
| Profitability | Moderate net margin (6.51%), very favorable ROE (85.7%) and ROIC (16.9%); overall neutral financial ratios due to some liquidity and valuation concerns | Negative net margin (-25.8%) but extremely high ROE (46.2%) and ROIC (197.7%); mixed financial health with liquidity and debt challenges |
| Innovation | Consistent investment in subscription software licenses and consulting services; growing ROIC indicates effective capital use | High ROIC growth suggests strong innovation, but negative interest coverage and debt ratios signal financial stress |
| Global presence | Significant international operations with stable revenue over years; diversified geographic footprint | Primarily US-focused with smaller scale and less international revenue |
| Market Share | Established player with durable competitive advantage in data analytics and consulting | Smaller market share but rapid growth in subscription services with strong competitive positioning |
Teradata shows a well-diversified business model with steady profitability and strong capital efficiency, although liquidity and valuation metrics require caution. Domo demonstrates excellent capital returns and innovation but struggles with profitability and financial stability, indicating higher risk despite growth potential. Investors should weigh stability versus growth prospects carefully.
Risk Analysis
Below is a comparative table summarizing key risks for Teradata Corporation (TDC) and Domo, Inc. (DOMO) based on the most recent financial and market data from 2025-2026.
| Metric | Teradata Corporation (TDC) | Domo, Inc. (DOMO) |
|---|---|---|
| Market Risk | Beta 0.58, moderate volatility | Beta 1.77, high volatility |
| Debt Level | Debt-to-assets 33.8%, moderate | Debt-to-assets 63.2%, high |
| Regulatory Risk | Moderate, tech industry compliance | Moderate, cloud SaaS regulations |
| Operational Risk | Stable with 5,700 employees | Smaller scale, 888 employees |
| Environmental Risk | Moderate, no major exposures | Moderate, cloud infrastructure |
| Geopolitical Risk | Global operations, some exposure | Primarily US, less global risk |
The most impactful and likely risks are market volatility for Domo due to its high beta and elevated debt levels, which increase financial vulnerability. Teradata shows more stability but carries moderate leverage and some valuation concerns reflected in its elevated P/E and P/B ratios. Both companies face typical regulatory and operational risks inherent to the software sector. Investors should weigh Domo’s financial distress signals more cautiously despite its growth potential.
Which Stock to Choose?
Teradata Corporation (TDC) shows a mixed income evolution with recent revenue declines but improvements in EBIT and net margin growth, supported by favorable profitability ratios such as a high ROE of 85.7% and strong ROIC. However, it carries a moderate debt level and some liquidity concerns, reflected in an overall neutral financial ratios rating but a very favorable moat and a solid B+ rating.
Domo, Inc. (DOMO) presents an unfavorable income statement trend with negative net margins and EBIT margins despite strong revenue growth over the period. Its financial ratios reveal a split profile with favorable ROE and ROIC but challenges in liquidity and debt management. The company maintains a very favorable moat but a lower overall rating of C and signs of financial distress in its scores.
Investors prioritizing consistent profitability and financial health might find Teradata’s stable moat and favorable income statement more aligned with risk-averse or quality investing profiles, while those focused on high growth potential despite volatility could interpret Domo’s strong moat and revenue expansion as attractive for a risk-tolerant approach. Both stocks show neutral global ratio opinions, suggesting careful consideration of individual investment goals.
Disclaimer: Investment carries a risk of loss of initial capital. The past performance is not a reliable indicator of future results. Be sure to understand risks before making an investment decision.
Go Further
I encourage you to read the complete analyses of Teradata Corporation and Domo, Inc. to enhance your investment decisions: