Nordson Corporation (NDSN) and Hillenbrand, Inc. (HI) are prominent players in the industrial machinery sector, each with a diverse portfolio and a strong market presence. Nordson focuses on precision dispensing and coating technologies, while Hillenbrand offers advanced process solutions and molding technologies. Their shared industry and innovation-driven strategies make them compelling candidates for comparison. In this article, I will help you identify which company presents the most attractive investment opportunity.
Table of contents
Companies Overview
I will begin the comparison between Nordson Corporation and Hillenbrand, Inc. by providing an overview of these two companies and their main differences.
Nordson Corporation Overview
Nordson Corporation specializes in engineering, manufacturing, and marketing systems that dispense, apply, and control adhesives, coatings, polymers, and other fluids worldwide. Operating through Industrial Precision Solutions and Advanced Technology Solutions segments, it serves diverse industries including packaged goods, semiconductor, and medical markets. Founded in 1935, Nordson is headquartered in Westlake, Ohio, and trades on NASDAQ with a market cap of 13.4B USD.
Hillenbrand, Inc. Overview
Hillenbrand, Inc. is a diversified industrial company operating in three segments: Advanced Process Solutions, Molding Technology Solutions, and Batesville funeral services. It serves industries such as plastics, pharmaceuticals, automotive, and consumer goods, offering equipment and personalized memorial products. Founded in 1906 and based in Batesville, Indiana, Hillenbrand is listed on the NYSE with a market cap of 2.2B USD.
Key similarities and differences
Both companies operate in the industrial machinery sector and provide specialized equipment for processing and manufacturing applications. Nordson focuses more on fluid dispensing and precision systems, while Hillenbrand offers a broader industrial portfolio including molding technologies and funeral services. Nordson’s market capitalization is significantly larger, reflecting its global product reach and technological specialization.
Income Statement Comparison
The table below presents a side-by-side comparison of key income statement metrics for Nordson Corporation and Hillenbrand, Inc. for the most recent fiscal year 2025.
| Metric | Nordson Corporation (NDSN) | Hillenbrand, Inc. (HI) |
|---|---|---|
| Market Cap | 13.4B | 2.23B |
| Revenue | 2.79B | 2.67B |
| EBITDA | 712M | 231M |
| EBIT | 561M | 92M |
| Net Income | 484M | 43M |
| EPS | 8.56 | 0.74 |
| Fiscal Year | 2025 | 2025 |
Income Statement Interpretations
Nordson Corporation’s revenue showed a steady increase from $2.36B in 2021 to $2.79B in 2025, with net income rising from $454M to $484M in the same period. Gross margins remained strong around 55%, while EBIT margins hovered near 20%, reflecting operational efficiency. The 2025 fiscal year saw moderate revenue growth but a slight decline in EBIT, signaling some margin pressures.
Hillenbrand, Inc. experienced more volatile revenue, peaking at $3.18B in 2024 before falling to $2.67B in 2025. Net income swung significantly, with a loss of $211M in 2024 turning to a positive $43M in 2025. Gross margins were lower than Nordson’s at about 34%, and EBIT margins remained modest, despite a sharp EBIT improvement in 2025. Earnings per share also showed strong recovery.
Which one has the stronger fundamentals?
Nordson demonstrates more consistent revenue and profit growth with stable margins, reflecting solid operational control. Hillenbrand shows greater volatility but notable recent profitability improvement and margin recovery. Nordson’s higher profitability and margin stability favor stronger fundamentals, while Hillenbrand’s turnaround potential introduces a risk-reward dynamic worth monitoring. Both companies hold a favorable overall income statement evaluation.
Financial Ratios Comparison
Below is a comparison of key financial ratios for Nordson Corporation and Hillenbrand, Inc. based on their most recent fiscal year data.
| Ratios | Nordson Corporation (2025) | Hillenbrand, Inc. (2025) |
|---|---|---|
| ROE | 15.9% | 3.7% |
| ROIC | 10.5% | -32.6% |
| P/E | 27.1 | 36.7 |
| P/B | 4.31 | 1.34 |
| Current Ratio | 1.64 | 1.22 |
| Quick Ratio | 1.05 | 0.88 |
| D/E (Debt-to-Equity) | 0.69 | 1.12 |
| Debt-to-Assets | 35.4% | 35.9% |
| Interest Coverage | 7.04 | 0.55 |
| Asset Turnover | 0.47 | 0.60 |
| Fixed Asset Turnover | 4.70 | 7.80 |
| Payout Ratio | 37.0% | 121.7% |
| Dividend Yield | 1.36% | 3.32% |
Interpretation of the Ratios
Nordson Corporation exhibits predominantly favorable financial ratios, including strong net margin at 17.35% and ROE at 15.92%, supported by a healthy current ratio of 1.64 and solid interest coverage of 5.55. However, valuation metrics like PE at 27.1 and PB at 4.31 are less attractive. The company pays dividends with a neutral yield of 1.36%, indicating moderate shareholder returns without excessive payout risks.
Hillenbrand, Inc. shows weaker profitability ratios, with net margin at 1.95% and ROE at 3.66%, alongside a negative ROIC of -32.6%. The company’s leverage is concerning, with a debt-to-equity ratio of 1.12 and low interest coverage near 1. Dividend yield is favorable at 3.32%, reflecting some shareholder return despite underlying operational challenges and a mixed liquidity position.
Which one has the best ratios?
Nordson Corporation clearly outperforms Hillenbrand, Inc. in profitability, liquidity, and coverage ratios, despite some valuation concerns. Hillenbrand’s unfavorable profit margins, high leverage, and weak coverage diminish its financial strength. Overall, Nordson’s broader base of favorable ratios presents a more robust financial profile compared to Hillenbrand’s more mixed and unfavorable metrics.
Strategic Positioning
I will now compare Nordson and Hillenbrand’s positioning to understand their respective business strategies better.
Nordson Positioning
Nordson leads in industrial machinery with strong market shares in adhesive dispensing and advanced technology systems, facing moderate competitive pressure. Its revenue is driven mainly by Industrial Precision Solutions, Medical and Fluid Solutions, and Advanced Technology Systems, showing steady growth with a slight deceleration in advanced technology revenue in 2024.
Hillenbrand Positioning
Hillenbrand operates as a diversified industrial company with key segments including Process Equipment Group, Milacron, and Batesville. Its revenue mix shows shifts with Process Equipment Group dominating, while Milacron declined in 2025, reflecting competitive and technological pressures. The company exhibits fluctuating segment contributions but maintains a broad industrial base.
Nordson vs Hillenbrand Positioning
Nordson focuses on a concentrated product portfolio centered on precision dispensing and coating technologies, offering specialization benefits but with some concentration risks. Hillenbrand’s diversified portfolio across industrial processes and funeral services reduces dependency risks but may dilute focus and complicate operational efficiency.
Stock Comparison
The past 12 months have shown contrasting price dynamics for Nordson Corporation and Hillenbrand, Inc., with both stocks experiencing overall declines but recent periods revealing bullish momentum and notable shifts in buyer dominance.
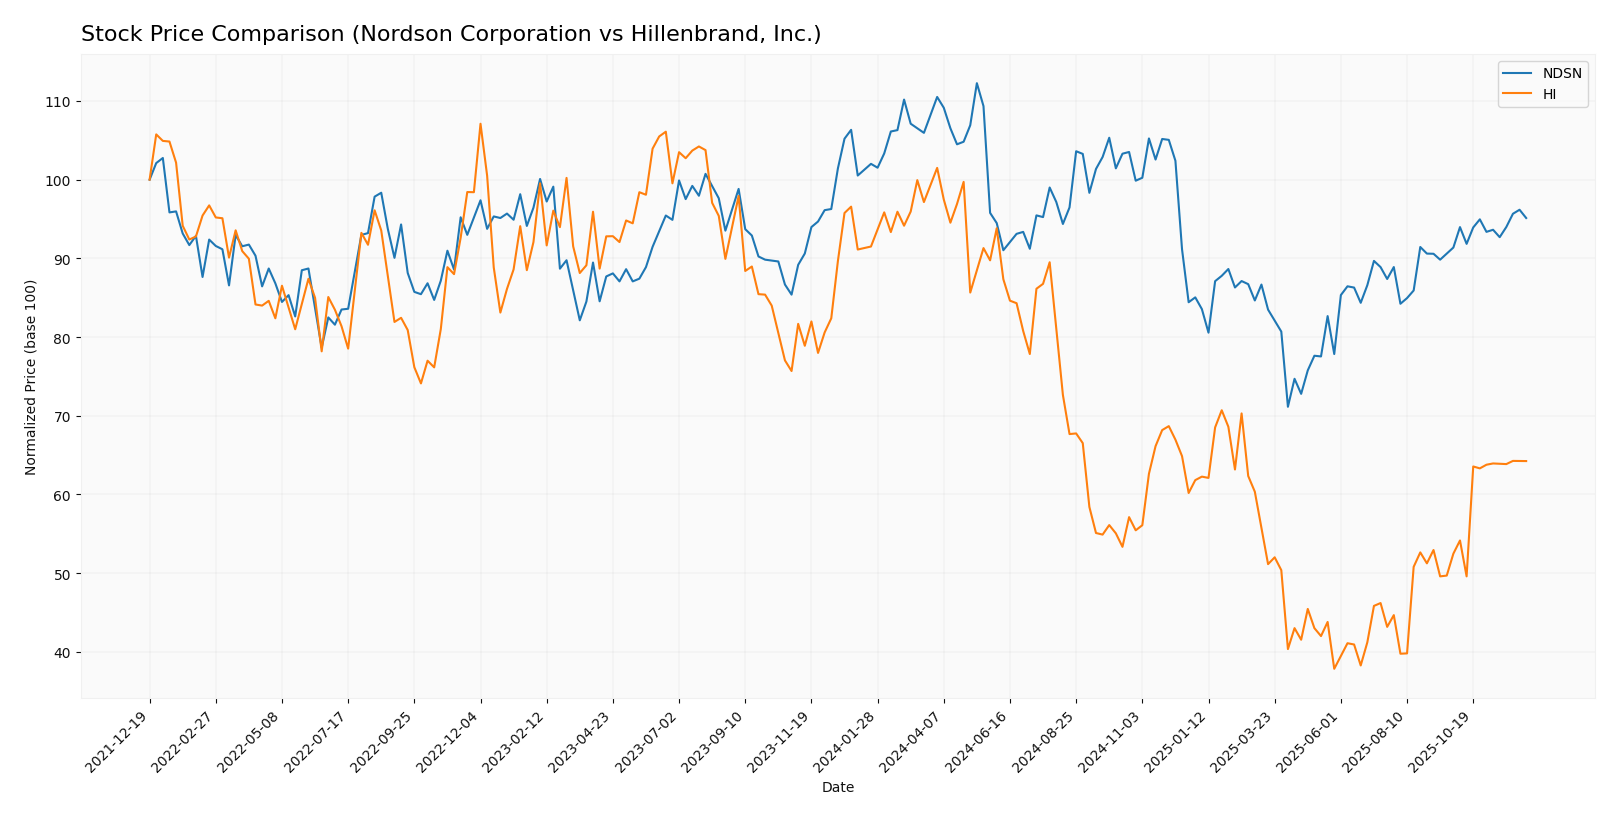
Trend Analysis
Nordson Corporation’s stock declined by 4.69% over the past year, marking a bearish trend with accelerating downward movement and high volatility (std deviation 23.64). It reached a high of 278.89 and a low of 176.73, but recent weeks show a bullish reversal with a 2.97% gain.
Hillenbrand, Inc. experienced a sharper bearish trend with a 31.81% drop over the same period, also accelerating, but with lower volatility (std deviation 9.19). The stock ranged between 50.29 and 18.75, and recent activity shows a strong bullish rebound of 18.0%.
Comparing both, Hillenbrand’s stock delivered the highest market performance recently, with a stronger recovery and buyer dominance, despite a more pronounced overall yearly decline.
Analyst Opinions Comparison
I will now compare Nordson and Hillenbrand’s ratings, grades, and price targets to gauge analysts’ opinions.
Nordson Rating
Nordson holds a B+ rating with a solid overall score of 3. It excels in return on assets (5) and return on equity (4), while debt-to-equity and valuation metrics score lower.
Hillenbrand Rating
Hillenbrand also has a B+ rating and an overall score of 3. It matches Nordson’s return on assets (5) but has weaker return on equity (2) and debt-to-equity (1) scores, balanced by a higher price-to-book score (4).
Which one is the best rated?
Both companies share the same B+ rating and overall score of 3. Nordson scores better in return on equity and debt management, while Hillenbrand is stronger in price-to-book valuation, making their ratings effectively comparable.
Nordson Corporation Grades
The following table summarizes the recent grades assigned to Nordson Corporation by various reputable grading companies.
| Grading Company | Action | New Grade | Date |
|---|---|---|---|
| DA Davidson | Maintain | Buy | 2025-12-12 |
| Baird | Maintain | Neutral | 2025-12-12 |
| Keybanc | Maintain | Overweight | 2025-12-11 |
| DA Davidson | Maintain | Buy | 2025-12-11 |
| Oppenheimer | Maintain | Outperform | 2025-08-25 |
| Baird | Maintain | Neutral | 2025-08-22 |
| Keybanc | Maintain | Overweight | 2025-07-15 |
| Baird | Maintain | Neutral | 2025-05-30 |
| Oppenheimer | Upgrade | Outperform | 2025-05-30 |
| Keybanc | Maintain | Overweight | 2025-04-08 |
Nordson Corporation’s grades generally indicate a positive outlook, with consistent buy, overweight, and outperform ratings from established firms.
Hillenbrand, Inc. Grades
The following table presents recent grades for Hillenbrand, Inc. from credible grading firms.
| Grading Company | Action | New Grade | Date |
|---|---|---|---|
| DA Davidson | Maintain | Neutral | 2025-11-20 |
| DA Davidson | Maintain | Neutral | 2025-10-16 |
| CJS Securities | Downgrade | Market Perform | 2025-10-16 |
| Keybanc | Downgrade | Sector Weight | 2025-05-08 |
| DA Davidson | Maintain | Neutral | 2025-05-01 |
| DA Davidson | Maintain | Neutral | 2024-11-15 |
| Keybanc | Maintain | Overweight | 2024-11-14 |
| DA Davidson | Downgrade | Neutral | 2024-08-12 |
| DA Davidson | Maintain | Buy | 2021-02-08 |
| DA Davidson | Maintain | Buy | 2021-02-07 |
Hillenbrand, Inc. has experienced several downgrades recently, with grades mostly at neutral or lower, indicating a more cautious market stance.
Grades Comparison of Nordson Corporation and Hillenbrand, Inc.
Nordson Corporation has consistently received stronger grades such as Buy, Overweight, and Outperform, compared to Hillenbrand’s mostly Neutral and downgraded ratings. This difference may impact investor perception, with Nordson viewed as a more favorable investment based on current analyst sentiment.
Target Prices
The current analyst consensus presents a moderate upside potential for Nordson Corporation and a stable outlook for Hillenbrand, Inc.
| Company | Target High | Target Low | Consensus |
|---|---|---|---|
| Nordson Corporation | 295 | 240 | 274.17 |
| Hillenbrand, Inc. | 32 | 32 | 32 |
Nordson’s target consensus of 274.17 suggests approximately 14% upside from the current price of 240.38, indicating moderate growth expectations. Hillenbrand’s consensus target is close to its current price of 31.66, reflecting a steady valuation outlook.
Strengths and Weaknesses
Below is a comparison of key strengths and weaknesses of Nordson Corporation and Hillenbrand, Inc. based on their recent financial and operational data.
| Criterion | Nordson Corporation (NDSN) | Hillenbrand, Inc. (HI) |
|---|---|---|
| Diversification | Moderate: Operates in two segments focusing on precision dispensing and advanced technology solutions. | High: Operates in three distinct segments including process solutions, molding technology, and funeral products. |
| Profitability | Strong: Net profit margin around 17.3% (2025), EBIT margin ~20%, consistent positive margins. | Weak: Net profit margin about 1.95% (2025), negative or near zero EBIT margin, showing profitability challenges. |
| Innovation | High: Focus on advanced dispensing systems and automated inspection technologies. | Moderate: More traditional industrial equipment with less emphasis on cutting-edge innovation. |
| Global presence | Strong: Markets products worldwide with multiple sales channels. | Moderate: Operates internationally but less global scale compared to Nordson. |
| Market Share | Significant in industrial machinery niche with a market cap of $13.4B. | Smaller market cap of $2.2B indicates more limited market influence. |
| Debt level | Moderate: Debt to assets ~35%, debt to equity ~0.69, manageable leverage with Altman Z-Score ~4.9. | High: Debt to assets ~36%, debt to equity ~1.12, financial leverage over 3, but very strong Altman Z-Score ~21.7 due to lower assets. |
Nordson Corporation demonstrates strong profitability, moderate diversification, and solid innovation, making it a resilient industrial player. Hillenbrand shows higher diversification but struggles with profitability and high leverage, posing greater risk despite its niche presence. Investors should weigh Nordson’s financial stability against Hillenbrand’s growth potential and risk profile.
Risk Analysis
Below is a comparative table outlining key risks for Nordson Corporation (NDSN) and Hillenbrand, Inc. (HI) based on their current financial and operational profiles in 2025.
| Metric | Nordson Corporation (NDSN) | Hillenbrand, Inc. (HI) |
|---|---|---|
| Market Risk | Moderate; beta near 1.02, stable industrial machinery demand but high valuation multiples increase sensitivity to market shifts. | Higher; beta 1.40, more volatile with lower margins and earnings fluctuations affecting stock price stability. |
| Regulatory Risk | Moderate; operates globally with compliance in industrial and medical sectors, potential exposure to evolving environmental and safety standards. | Moderate to High; diverse segments including funeral services may face stricter regulations and reputational risks. |
| Operational Risk | Low to Moderate; strong margins (~17% net), solid cash flow, and effective debt management reduce operational disruptions. | Moderate to High; negative or low profitability margins recently, high leverage (debt-to-equity >1), and working capital deficits increase operational vulnerability. |
| Environmental Risk | Moderate; industrial manufacturing processes with potential environmental impact and requirements for sustainability improvements. | Moderate; industrial operations and service segments may face environmental scrutiny, especially in waste handling and emissions. |
| Geopolitical Risk | Moderate; global operations expose Nordson to trade tensions and supply chain disruptions but diversified markets mitigate impact. | Moderate; exposure to international markets but smaller scale and higher debt increase sensitivity to geopolitical shifts. |
In synthesis, Hillenbrand faces more significant operational and financial risks due to weaker profitability, higher leverage, and working capital challenges. Nordson’s more robust financial health and steadier market position reduce its exposure, though both companies must manage regulatory and environmental changes carefully. Geopolitical tensions remain a shared external risk affecting supply chains and market access.
Which Stock to Choose?
Nordson Corporation (NDSN) shows a generally favorable income evolution with stable revenue growth and profitability, supported by strong net margin (17.35%) and return on equity (15.92%). Its debt level is moderate with a net debt to EBITDA of 2.79, and its overall rating is B+ with solid return and cash flow metrics.
Hillenbrand, Inc. (HI) presents a mixed income picture marked by declining revenue but a recent turnaround in EBIT growth. Profitability ratios are weaker, with a low net margin (1.95%) and negative return on invested capital. The company carries high debt (net debt to EBITDA 27.58) and holds a B+ rating, though with less favorable leverage and profitability scores.
For investors, NDSN’s favorable income and ratio evaluations with moderate debt could appear more attractive for those prioritizing quality and stability. Conversely, HI might appeal to risk-tolerant investors seeking potential growth from a turnaround, despite its higher leverage and weaker profitability. The choice could thus depend on individual risk appetite and investment strategy.
Disclaimer: Investment carries a risk of loss of initial capital. The past performance is not a reliable indicator of future results. Be sure to understand risks before making an investment decision.
Go Further
I encourage you to read the complete analyses of Nordson Corporation and Hillenbrand, Inc. to enhance your investment decisions: