In today’s fast-evolving tech landscape, Strategy Inc (MSTR) and The Trade Desk, Inc. (TTD) stand out as innovative players within the software application sector. Strategy Inc combines AI-driven analytics with bitcoin treasury management, while The Trade Desk focuses on data-driven digital advertising platforms. Both companies serve global markets with cutting-edge solutions, making their comparison essential for investors seeking growth and innovation. This article will help you identify which company deserves a place in your portfolio.

Table of contents
Companies Overview
I will begin the comparison between Strategy Inc and The Trade Desk, Inc. by providing an overview of these two companies and their main differences.
Strategy Inc Overview
Strategy Inc, formerly MicroStrategy Incorporated, operates as a bitcoin treasury company and provider of AI-powered enterprise analytics software. It offers investors exposure to Bitcoin through various securities and delivers tools like Strategy One and Strategy Mosaic for data insights and governance. Founded in 1989, the company is headquartered in Tysons Corner, Virginia, and is positioned in the software application industry.
The Trade Desk, Inc. Overview
The Trade Desk, Inc. is a technology company focused on digital advertising solutions. It operates a cloud-based platform enabling buyers to create, manage, and optimize data-driven campaigns across multiple channels and devices. Founded in 2009 and headquartered in Ventura, California, it serves advertising agencies and providers, operating within the software application sector.
Key similarities and differences
Both companies operate in the technology sector within the software application industry and serve global markets. Strategy Inc emphasizes bitcoin investment exposure and AI-driven analytics, while The Trade Desk specializes in digital advertising technology and campaign management. Strategy Inc has a smaller workforce of 1.5K employees compared to The Trade Desk’s 3.5K, with differing business models focused on financial instruments versus advertising platforms.
Income Statement Comparison
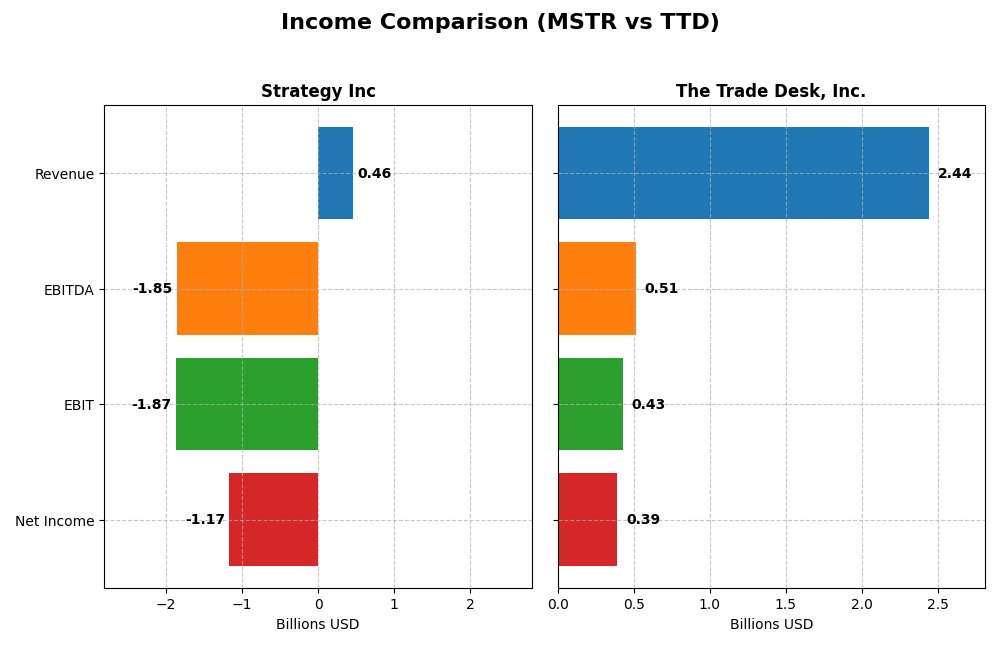
This table presents a side-by-side comparison of key income statement metrics for Strategy Inc and The Trade Desk, Inc. for the fiscal year 2024.
| Metric | Strategy Inc (MSTR) | The Trade Desk, Inc. (TTD) |
|---|---|---|
| Market Cap | 50B | 17.3B |
| Revenue | 463M | 2.44B |
| EBITDA | -1.85B | 515M |
| EBIT | -1.87B | 427M |
| Net Income | -1.17B | 393M |
| EPS | -6.06 | 0.80 |
| Fiscal Year | 2024 | 2024 |
Income Statement Interpretations
Strategy Inc
Strategy Inc experienced a declining revenue trend from $510M in 2021 to $463M in 2024, with net income fluctuating sharply, culminating in a -$1.17B loss in 2024. Despite a strong gross margin near 72%, operating and net margins deteriorated significantly. The latest year saw a 6.6% revenue drop, worsening profitability, and expanding negative margins, reflecting operational challenges.
The Trade Desk, Inc.
The Trade Desk, Inc. showed robust revenue growth from $837M in 2020 to $2.44B in 2024, with net income rising from $242M to $393M. Margins improved consistently, with a favorable gross margin over 80% and positive EBIT and net margins. In 2024, revenue grew 25.6% year-over-year, alongside strong EBIT and EPS growth, indicating solid operational performance.
Which one has the stronger fundamentals?
Based on the income statement evaluation, The Trade Desk, Inc. exhibits stronger fundamentals with consistent revenue growth, favorable margins, and improving profitability. Conversely, Strategy Inc faces declining revenues and significant net losses with unfavorable margin trends. The Trade Desk’s financials suggest a healthier income statement profile relative to Strategy Inc over the assessed period.
Financial Ratios Comparison
The table below presents the latest available key financial ratios for Strategy Inc (MSTR) and The Trade Desk, Inc. (TTD) for fiscal year 2024, facilitating a straightforward comparison of their financial metrics.
| Ratios | Strategy Inc (MSTR) | The Trade Desk, Inc. (TTD) |
|---|---|---|
| ROE | -6.4% | 13.3% |
| ROIC | -4.4% | 10.0% |
| P/E | -47.8 | 146.8 |
| P/B | 3.06 | 19.56 |
| Current Ratio | 0.71 | 1.86 |
| Quick Ratio | 0.71 | 1.86 |
| D/E | 0.40 | 0.11 |
| Debt-to-Assets | 28.1% | 5.1% |
| Interest Coverage | -29.9 | 0 |
| Asset Turnover | 0.018 | 0.40 |
| Fixed Asset Turnover | 5.73 | 5.17 |
| Payout Ratio | 0 | 0 |
| Dividend Yield | 0 | 0 |
Interpretation of the Ratios
Strategy Inc
Strategy Inc exhibits mostly unfavorable financial ratios, including a negative net margin of -251.73% and return on equity at -6.4%, signaling profitability and efficiency concerns. The company has a low current ratio of 0.71, indicating liquidity risk, but favorable debt metrics with a debt-to-assets ratio of 28.09%. Strategy Inc does not pay dividends, likely reflecting its current financial challenges and possible reinvestment priorities.
The Trade Desk, Inc.
The Trade Desk shows a more balanced profile with favorable net margin at 16.08% and return on invested capital of 10.02%, suggesting operational strength. Liquidity ratios are strong, with a current ratio of 1.86. However, valuation measures like P/E of 146.77 and P/B of 19.56 are unfavorable, indicating high market expectations. This company also does not pay dividends, which may align with growth and reinvestment strategies.
Which one has the best ratios?
The Trade Desk holds more favorable ratios overall, with 57.14% positive metrics compared to Strategy Inc’s 28.57%. While Strategy Inc has some strengths in debt management, its weak profitability and liquidity contrast with The Trade Desk’s stronger earnings and financial stability. Both companies do not pay dividends, reflecting different stages or strategies in capital allocation.
Strategic Positioning
This section compares the strategic positioning of Strategy Inc and The Trade Desk, Inc., including market position, key segments, and exposure to disruption:
Strategy Inc
- Operates globally as a bitcoin treasury and software company facing high beta volatility.
- Key segments include License, Maintenance, Subscription, and Technology Services in analytics software and bitcoin exposure.
- Exposure to disruption through AI-powered analytics and bitcoin market participation, with inherent crypto volatility.
The Trade Desk, Inc.
- Operates internationally with a lower beta, focusing on cloud-based advertising technology.
- Focuses on self-service cloud platform for data-driven digital advertising across multiple channels.
- Faces technological disruption in digital advertising but benefits from cloud-based platform scalability.
Strategy Inc vs The Trade Desk, Inc. Positioning
Strategy Inc has a diversified business model combining bitcoin treasury activities and AI analytics, while The Trade Desk concentrates on digital advertising technology. Strategy Inc’s approach carries crypto market risks, whereas The Trade Desk leverages a scalable ad platform with broader device coverage.
Which has the best competitive advantage?
Based on MOAT evaluation, neither company shows a strong economic moat. Strategy Inc has a very unfavorable rating with declining ROIC and value destruction. The Trade Desk is slightly unfavorable, also with declining profitability but less severe value erosion.
Stock Comparison
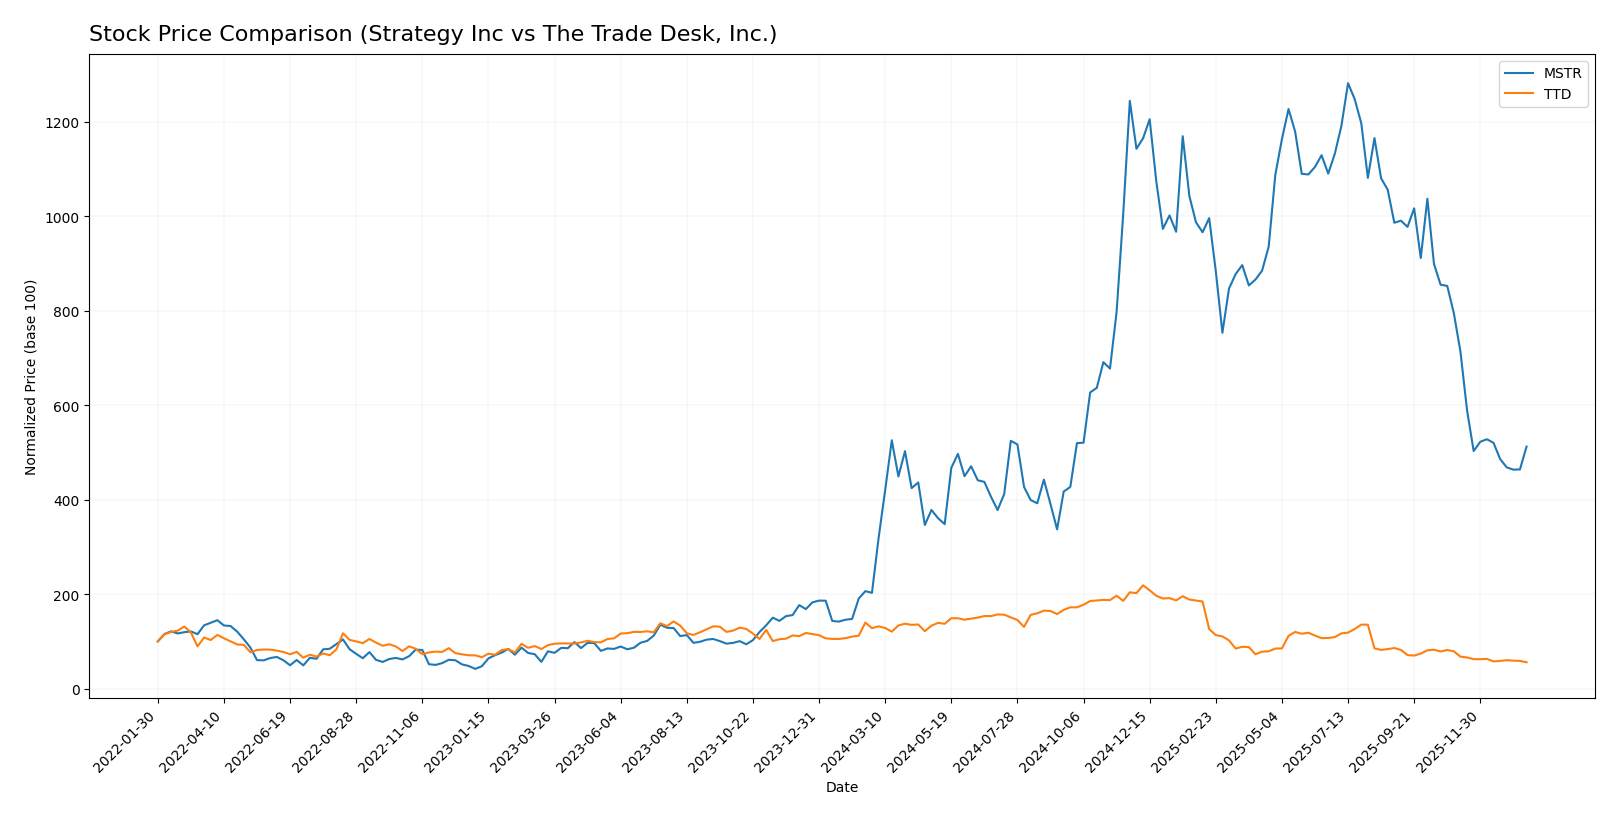
The stock price movements over the past 12 months reveal contrasting dynamics, with Strategy Inc showing a strong bullish trend despite recent deceleration, while The Trade Desk, Inc. experiences a sustained bearish trend marked by notable price declines.
Trend Analysis
Strategy Inc’s stock posted a significant 152.71% gain over the past year, reflecting a bullish trend with deceleration. The price fluctuated between 68.74 and 434.58, with high volatility indicated by a 103.09 standard deviation.
The Trade Desk, Inc. recorded a 56.43% loss over the same period, confirming a bearish trend with deceleration. Its price ranged from 35.48 to 139.11, showing moderate volatility with a 28.36 standard deviation.
Comparing both, Strategy Inc delivered the highest market performance with a strong positive price change, contrasting sharply with The Trade Desk’s substantial decline.
Target Prices
The current target price consensus from verified analysts shows a broad range of expectations for both companies.
| Company | Target High | Target Low | Consensus |
|---|---|---|---|
| Strategy Inc | 705 | 175 | 433.57 |
| The Trade Desk, Inc. | 98 | 39 | 56.73 |
Analysts foresee significant upside potential for Strategy Inc, with a consensus target well above its current price of 173.71 USD. The Trade Desk’s consensus target also suggests upside from the current 35.48 USD, though with a more moderate range.
Analyst Opinions Comparison
This section compares analysts’ ratings and grades for Strategy Inc and The Trade Desk, Inc.:
Rating Comparison
Strategy Inc Rating
- Rating: A- indicating a very favorable overall assessment.
- Discounted Cash Flow Score: 1, very unfavorable for valuation.
- ROE Score: 4, favorable efficiency in profit generation.
- ROA Score: 5, very favorable asset utilization.
- Debt To Equity Score: 3, moderate financial risk.
- Overall Score: 4, favorable financial standing.
The Trade Desk, Inc. Rating
- Rating: B also indicating a very favorable overall assessment.
- Discounted Cash Flow Score: 4, favorable for valuation.
- ROE Score: 4, favorable efficiency in profit generation.
- ROA Score: 4, favorable asset utilization.
- Debt To Equity Score: 3, moderate financial risk.
- Overall Score: 3, moderate financial standing.
Which one is the best rated?
Based strictly on the provided data, Strategy Inc holds a higher overall score (4) and a superior ROA score (5) compared to The Trade Desk’s overall score (3) and ROA (4). However, The Trade Desk has a more favorable discounted cash flow score (4 vs. 1).
Scores Comparison
Here is a comparison of the Altman Z-Score and Piotroski Score for the two companies:
Strategy Inc Scores
- Altman Z-Score: 2.78, in the grey zone indicating moderate bankruptcy risk.
- Piotroski Score: 4, classified as average financial strength.
The Trade Desk, Inc. Scores
- Altman Z-Score: 4.30, in the safe zone indicating low bankruptcy risk.
- Piotroski Score: 5, classified as average financial strength.
Which company has the best scores?
The Trade Desk, Inc. has a higher Altman Z-Score, placing it in the safe zone, while Strategy Inc remains in the grey zone. Both companies have average Piotroski Scores, but The Trade Desk’s scores indicate stronger financial stability overall.
Grades Comparison
The grades assigned by reputable grading companies for Strategy Inc and The Trade Desk, Inc. are as follows:
Strategy Inc Grades
Here are the recent grades and ratings given by established financial firms for Strategy Inc:
| Grading Company | Action | New Grade | Date |
|---|---|---|---|
| Mizuho | Maintain | Outperform | 2026-01-16 |
| TD Cowen | Maintain | Buy | 2026-01-15 |
| Citigroup | Maintain | Buy | 2025-12-22 |
| Bernstein | Maintain | Outperform | 2025-12-08 |
| Monness, Crespi, Hardt | Upgrade | Neutral | 2025-11-10 |
| HC Wainwright & Co. | Maintain | Buy | 2025-11-03 |
| Canaccord Genuity | Maintain | Buy | 2025-11-03 |
| BTIG | Maintain | Buy | 2025-10-31 |
| Cantor Fitzgerald | Maintain | Overweight | 2025-10-31 |
| TD Cowen | Maintain | Buy | 2025-10-31 |
Overall, Strategy Inc shows consistently positive grades, predominantly Buy and Outperform, with a recent upgrade from Sell to Neutral by Monness, Crespi, Hardt.
The Trade Desk, Inc. Grades
Below are the latest grades and ratings from recognized analysts for The Trade Desk, Inc.:
| Grading Company | Action | New Grade | Date |
|---|---|---|---|
| Morgan Stanley | Maintain | Equal Weight | 2026-01-13 |
| Wells Fargo | Maintain | Equal Weight | 2026-01-12 |
| Cantor Fitzgerald | Maintain | Neutral | 2026-01-08 |
| Wolfe Research | Maintain | Outperform | 2026-01-06 |
| Guggenheim | Maintain | Buy | 2026-01-05 |
| Jefferies | Maintain | Hold | 2025-12-11 |
| Wedbush | Maintain | Neutral | 2025-12-08 |
| DA Davidson | Maintain | Buy | 2025-11-10 |
| Truist Securities | Maintain | Buy | 2025-11-07 |
| Wells Fargo | Maintain | Equal Weight | 2025-11-07 |
The Trade Desk, Inc. displays a mix of Buy, Hold, Neutral, and Equal Weight grades, with some positive Outperform ratings but generally more moderate analyst sentiment.
Which company has the best grades?
Strategy Inc has received stronger and more consistent Buy and Outperform grades compared to The Trade Desk, Inc., which shows more varied, moderate ratings. For investors, this may indicate a higher level of confidence from analysts in Strategy Inc’s prospects relative to The Trade Desk, Inc.
Strengths and Weaknesses
Below is a comparison table highlighting the key strengths and weaknesses of Strategy Inc (MSTR) and The Trade Desk, Inc. (TTD) based on the most recent financial and market data.
| Criterion | Strategy Inc (MSTR) | The Trade Desk, Inc. (TTD) |
|---|---|---|
| Diversification | Moderate: Revenue split with strong Maintenance (≈244M) and Subscription (≈107M) segments but declining License and Technology Service | Focused on digital advertising technology, less diversified but specialized |
| Profitability | Weak: Negative net margin (-252%), ROIC -4.38%, value destroying | Moderate: Positive net margin (16.1%), ROIC 10%, but declining trend, slightly unfavorable moat |
| Innovation | Limited: Declining ROIC and value destruction indicate challenges in innovation and capital efficiency | Strong innovation in ad tech but facing pressure as ROIC declines slightly |
| Global presence | Established but no clear data on expansion; moderate debt levels (28% debt/assets) | Strong global footprint with low debt (5% debt/assets) and robust liquidity ratios |
| Market Share | Declining profitability suggests shrinking or stagnant market share | Competitive position with strong margins but high valuation multiples (PE 147, PB 20) |
Key takeaways: Strategy Inc struggles with profitability and capital efficiency, showing a very unfavorable economic moat. In contrast, The Trade Desk maintains favorable profitability metrics and financial health, though its declining ROIC and high valuation warrant cautious monitoring.
Risk Analysis
Below is a comparative table of key risks for Strategy Inc (MSTR) and The Trade Desk, Inc. (TTD) based on the most recent data from 2024–2026:
| Metric | Strategy Inc (MSTR) | The Trade Desk, Inc. (TTD) |
|---|---|---|
| Market Risk | High beta 3.43, volatile price range (149.75-457.22) | Moderate beta 1.11, price range (35.23-126.2) |
| Debt level | Moderate debt-to-assets 28.1%, interest coverage negative (-30.23) | Low debt-to-assets 5.11%, strong interest coverage (∞) |
| Regulatory Risk | Exposure to crypto markets could face evolving regulations | Digital advertising sector faces privacy and data regulations |
| Operational Risk | Business model combines bitcoin treasury & AI analytics, complexity risk | Reliant on cloud ad platform, risk from tech disruptions |
| Environmental Risk | Limited direct exposure, but tech industry energy use concerns | Similar tech sector exposure, moderate environmental impact |
| Geopolitical Risk | International bitcoin exposure; risks from global crypto policy changes | Global ad market exposure; geopolitical tensions could impact ad spend |
In summary, Strategy Inc faces the most impactful risks from market volatility and negative interest coverage, accentuated by regulatory uncertainty in the crypto space. The Trade Desk shows moderate market risk but benefits from low debt and stable operations. Investors should weigh Strategy Inc’s higher volatility against The Trade Desk’s steadier profile.
Which Stock to Choose?
Strategy Inc (MSTR) shows a declining income trend with unfavorable profitability and financial ratios, including negative returns on equity and assets. Its debt metrics are favorable, and it holds a very favorable A- rating despite a very unfavorable global income statement and moat evaluation.
The Trade Desk, Inc. (TTD) presents strong income growth and mostly favorable financial ratios, with positive net and operating margins. It maintains low debt levels and a very favorable B rating, supported by a favorable global income statement but a slightly unfavorable moat status due to declining ROIC.
For investors prioritizing financial stability and favorable income growth, The Trade Desk may appear more attractive, while Strategy Inc might be more relevant to those focusing on companies with strong ratings despite current profitability challenges. The choice could depend on the tolerance for risk and investment focus.
Disclaimer: Investment carries a risk of loss of initial capital. The past performance is not a reliable indicator of future results. Be sure to understand risks before making an investment decision.
Go Further
I encourage you to read the complete analyses of Strategy Inc and The Trade Desk, Inc. to enhance your investment decisions: