Snowflake Inc. and The Trade Desk, Inc. are two prominent players in the technology sector, both specializing in cloud-based software solutions. Snowflake focuses on data platform services that enable organizations to unify and analyze data, while The Trade Desk excels in digital advertising technology. Their overlapping emphasis on innovation and data-driven strategies makes this comparison compelling. In this article, I will help you determine which company stands out as the most attractive investment opportunity.

Table of contents
Companies Overview
I will begin the comparison between Snowflake Inc. and The Trade Desk, Inc. by providing an overview of these two companies and their main differences.
Snowflake Inc. Overview
Snowflake Inc. provides a cloud-based data platform designed to consolidate data into a single source of truth. Its Data Cloud platform helps organizations derive meaningful business insights, build data-driven applications, and share data across various industries. Founded in 2012 and based in Bozeman, Montana, Snowflake holds a significant position in the software application sector with a market cap of $70.4B.
The Trade Desk, Inc. Overview
The Trade Desk, Inc. operates a self-service cloud platform that enables buyers to create, manage, and optimize digital advertising campaigns across multiple formats and devices. Serving advertising agencies and other service providers, the company focuses on data-driven advertising solutions. Incorporated in 2009 and headquartered in Ventura, California, The Trade Desk has a market cap of $17.3B in the software application industry.
Key similarities and differences
Both Snowflake and The Trade Desk operate in the technology sector with cloud-based software platforms, serving business clients internationally. Snowflake focuses on data consolidation and analytics, while The Trade Desk specializes in digital advertising campaign management. The two companies differ in market capitalization and employee count, with Snowflake being larger and more centered on data platforms, whereas The Trade Desk targets advertising technology solutions.
Income Statement Comparison
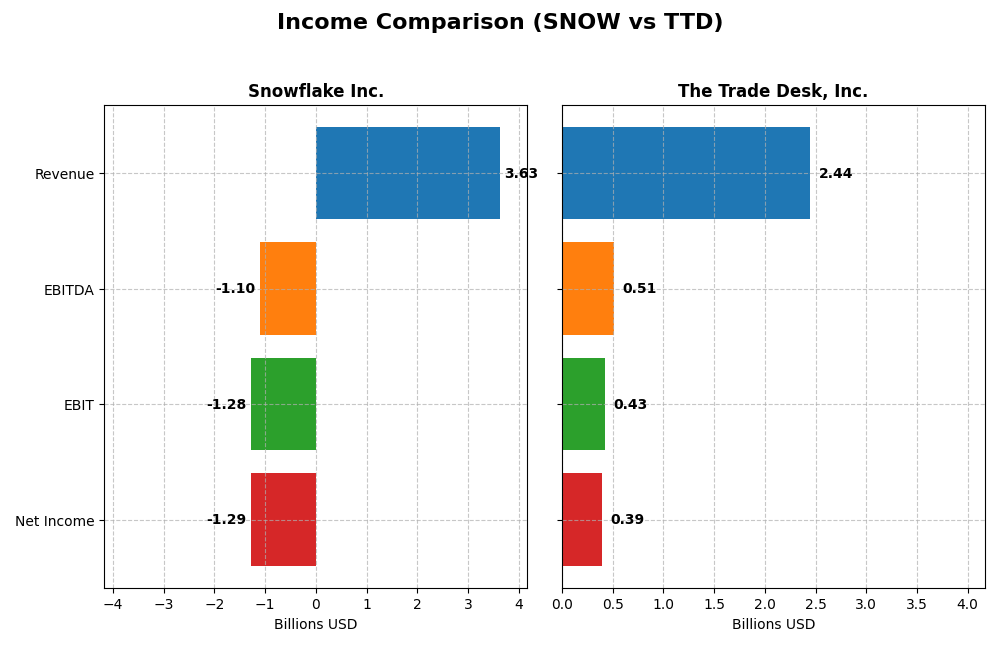
Below is a comparison of the most recent fiscal year income statement metrics for Snowflake Inc. and The Trade Desk, Inc.
| Metric | Snowflake Inc. (SNOW) | The Trade Desk, Inc. (TTD) |
|---|---|---|
| Market Cap | 70.4B | 17.3B |
| Revenue | 3.63B | 2.44B |
| EBITDA | -1.10B | 515M |
| EBIT | -1.28B | 427M |
| Net Income | -1.29B | 393M |
| EPS | -3.86 | 0.80 |
| Fiscal Year | 2025 | 2024 |
Income Statement Interpretations
Snowflake Inc.
Snowflake Inc. has shown strong revenue growth of 512.52% from 2021 to 2025, with a favorable gross margin of 66.5%. However, net income remains negative and declined by 138.48% over the same period, leading to an unfavorable net margin of -35.45%. The most recent year saw revenue grow by 29.21%, but EBIT and net margin deteriorated, reflecting continued profitability challenges.
The Trade Desk, Inc.
The Trade Desk experienced consistent revenue growth of 192.43% between 2020 and 2024, with an excellent gross margin of 80.69%. Net income also improved by 62.22%, supporting a favorable net margin of 16.08%. In the latest year, revenue rose by 25.63%, accompanied by strong EBIT and net margin growth, indicating enhanced operational efficiency and profitability.
Which one has the stronger fundamentals?
The Trade Desk demonstrates stronger fundamentals with predominantly favorable margin metrics and consistent net income growth, achieving profitability and improving earnings per share. Snowflake’s revenue growth is impressive but is offset by persistent net losses and negative margins. Overall, The Trade Desk’s financials display more favorable income statement stability and growth.
Financial Ratios Comparison
The table below presents the most recent financial ratios for Snowflake Inc. and The Trade Desk, Inc., based on their fiscal year 2025 and 2024 data respectively.
| Ratios | Snowflake Inc. (2025) | The Trade Desk, Inc. (2024) |
|---|---|---|
| ROE | -42.9% | 13.3% |
| ROIC | -25.2% | 10.0% |
| P/E | -47.0 | 146.8 |
| P/B | 20.1 | 19.6 |
| Current Ratio | 1.75 | 1.86 |
| Quick Ratio | 1.75 | 1.86 |
| D/E (Debt-to-Equity) | 0.90 | 0.11 |
| Debt-to-Assets | 29.7% | 5.1% |
| Interest Coverage | -528 | 0 |
| Asset Turnover | 0.40 | 0.40 |
| Fixed Asset Turnover | 5.53 | 5.17 |
| Payout ratio | 0 | 0 |
| Dividend yield | 0 | 0 |
Interpretation of the Ratios
Snowflake Inc.
Snowflake Inc. displays a mix of strong and weak financial ratios, with 35.7% favorable and 50% unfavorable metrics, leading to a slightly unfavorable overall view. Key concerns include negative returns on equity (-42.86%) and invested capital (-25.24%), alongside a poor interest coverage ratio (-464.78). The company does not pay dividends, reflecting its reinvestment strategy in R&D and growth.
The Trade Desk, Inc.
The Trade Desk shows a more favorable ratio profile, with 57.1% favorable and 28.6% unfavorable ratios. It posts a positive net margin (16.08%) and return on invested capital (10.02%), but suffers from a high price-to-earnings ratio (146.77) and price-to-book of 19.56. Like Snowflake, it pays no dividends, focusing on growth and shareholder value through reinvestment.
Which one has the best ratios?
The Trade Desk holds the better ratio profile, characterized by stronger profitability, solid liquidity, and lower leverage. Its fewer unfavorable ratios and favorable interest coverage contrast with Snowflake’s significant profitability challenges and negative returns. Both companies do not distribute dividends, prioritizing reinvestment strategies instead.
Strategic Positioning
This section compares the strategic positioning of Snowflake Inc. and The Trade Desk, Inc., including market position, key segments, and exposure to technological disruption:
Snowflake Inc.
- Large market cap of 70B with moderate competitive pressure in cloud data platforms.
- Key segment is cloud-based data platform products driving most revenue; professional services minor.
- Operates in cloud data industry; no explicit mention of disruption risk in data platform space.
The Trade Desk, Inc.
- Smaller market cap of 17B facing competition in digital advertising technology.
- Focused on self-service cloud platform for digital advertising campaigns across multiple media.
- Operates in ad tech with exposure to rapid changes in digital advertising formats and channels.
Snowflake Inc. vs The Trade Desk, Inc. Positioning
Snowflake shows a concentrated focus on cloud data platforms with high product revenue, while The Trade Desk concentrates on digital ad tech services. Snowflake’s larger scale contrasts The Trade Desk’s narrower but multi-channel advertising focus, each with different competitive dynamics.
Which has the best competitive advantage?
Based on MOAT evaluation, both companies show declining profitability and are shedding value, but Snowflake’s position is very unfavorable compared to The Trade Desk’s slightly unfavorable status, indicating neither currently demonstrates a strong competitive advantage.
Stock Comparison
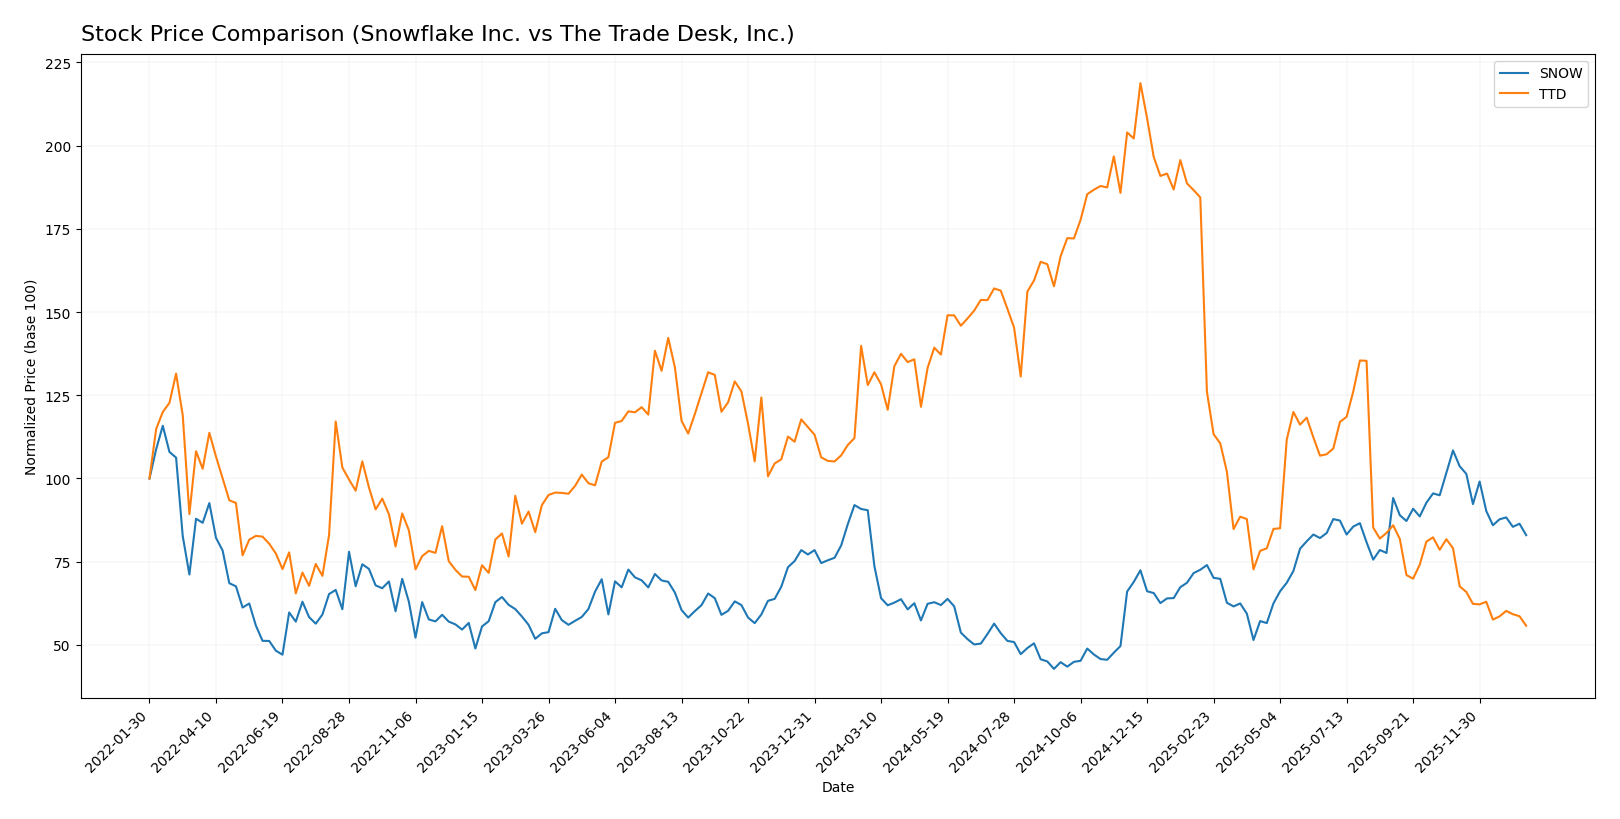
The stock price movements of Snowflake Inc. and The Trade Desk, Inc. over the past year reveal significant bearish trends with pronounced declines and decelerating momentum, reflecting distinct trading dynamics and volume shifts.
Trend Analysis
Snowflake Inc. experienced an 8.27% price decline over the past 12 months, indicating a bearish trend with decelerating price movement. The stock showed high volatility, with a standard deviation of 42.6, peaking at 274.88 and bottoming at 108.56.
The Trade Desk, Inc. recorded a more pronounced 56.43% price drop over the same period, also bearish with deceleration. Volatility was lower than Snowflake’s at 28.36, with a highest price of 139.11 and a lowest of 35.48, reflecting a steep downward trajectory.
Comparing both, The Trade Desk posted the larger negative return, thus delivering the weaker market performance relative to Snowflake during the last year.
Target Prices
Analysts present a mixed but generally optimistic target consensus for these technology firms.
| Company | Target High | Target Low | Consensus |
|---|---|---|---|
| Snowflake Inc. | 325 | 237 | 281.86 |
| The Trade Desk, Inc. | 98 | 39 | 56.73 |
Snowflake’s consensus target is about 34% above its current price of 210.38 USD, indicating strong upside potential. The Trade Desk’s target consensus is roughly 60% above its current 35.48 USD price, suggesting significant expected growth.
Analyst Opinions Comparison
This section compares analysts’ ratings and grades for Snowflake Inc. and The Trade Desk, Inc.:
Rating Comparison
Snowflake Inc. Rating
- Rating: C-, classified as Very Favorable
- Discounted Cash Flow Score: 3, Moderate
- ROE Score: 1, Very Unfavorable
- ROA Score: 1, Very Unfavorable
- Debt To Equity Score: 1, Very Unfavorable
- Overall Score: 1, Very Unfavorable
The Trade Desk, Inc. Rating
- Rating: B, classified as Very Favorable
- Discounted Cash Flow Score: 4, Favorable
- ROE Score: 4, Favorable
- ROA Score: 4, Favorable
- Debt To Equity Score: 3, Moderate
- Overall Score: 3, Moderate
Which one is the best rated?
The Trade Desk, Inc. holds a higher overall rating (B) with favorable scores in key financial metrics compared to Snowflake Inc.’s lower rating (C-) and mostly very unfavorable scores. Therefore, The Trade Desk, Inc. is better rated based on the provided data.
Scores Comparison
The comparison of Snowflake Inc. and The Trade Desk, Inc. scores is as follows:
SNOW Scores
- Altman Z-Score: 5.36, indicating a safe zone with low bankruptcy risk.
- Piotroski Score: 4, classified as average financial strength.
TTD Scores
- Altman Z-Score: 4.30, indicating a safe zone with low bankruptcy risk.
- Piotroski Score: 5, classified as average financial strength.
Which company has the best scores?
Both companies are in the safe zone for Altman Z-Score, indicating low bankruptcy risk. The Trade Desk has a slightly higher Piotroski Score (5 vs. 4), suggesting marginally stronger financial health based on provided data.
Grades Comparison
Here is a comparison of the latest grades assigned to Snowflake Inc. and The Trade Desk, Inc.:
Snowflake Inc. Grades
The following table summarizes recent analyst grades for Snowflake Inc.:
| Grading Company | Action | New Grade | Date |
|---|---|---|---|
| Barclays | Downgrade | Equal Weight | 2026-01-12 |
| Argus Research | Upgrade | Buy | 2026-01-08 |
| Citigroup | Maintain | Buy | 2025-12-08 |
| Wells Fargo | Maintain | Overweight | 2025-12-04 |
| Keybanc | Maintain | Overweight | 2025-12-04 |
| Piper Sandler | Maintain | Overweight | 2025-12-04 |
| Morgan Stanley | Maintain | Overweight | 2025-12-04 |
| Wedbush | Maintain | Outperform | 2025-12-04 |
| Deutsche Bank | Maintain | Buy | 2025-12-04 |
| Cantor Fitzgerald | Maintain | Overweight | 2025-12-04 |
Snowflake’s grades show a strong buy consensus with mostly overweight and buy ratings, and only one recent downgrade to equal weight.
The Trade Desk, Inc. Grades
The following table summarizes recent analyst grades for The Trade Desk, Inc.:
| Grading Company | Action | New Grade | Date |
|---|---|---|---|
| Morgan Stanley | Maintain | Equal Weight | 2026-01-13 |
| Wells Fargo | Maintain | Equal Weight | 2026-01-12 |
| Cantor Fitzgerald | Maintain | Neutral | 2026-01-08 |
| Wolfe Research | Maintain | Outperform | 2026-01-06 |
| Guggenheim | Maintain | Buy | 2026-01-05 |
| Jefferies | Maintain | Hold | 2025-12-11 |
| Wedbush | Maintain | Neutral | 2025-12-08 |
| DA Davidson | Maintain | Buy | 2025-11-10 |
| Truist Securities | Maintain | Buy | 2025-11-07 |
| Wells Fargo | Maintain | Equal Weight | 2025-11-07 |
The Trade Desk’s analyst ratings generally cluster around equal weight and neutral, with some buy and outperform ratings, indicating a more cautious stance.
Which company has the best grades?
Snowflake Inc. has received more favorable grades overall, with a higher number of buy and overweight ratings compared to The Trade Desk, which has mostly equal weight and neutral grades. This difference suggests that investors may view Snowflake as having stronger growth potential or lower risk.
Strengths and Weaknesses
Below is a comparison of key strengths and weaknesses for Snowflake Inc. (SNOW) and The Trade Desk, Inc. (TTD) based on their most recent financial and operational data.
| Criterion | Snowflake Inc. (SNOW) | The Trade Desk, Inc. (TTD) |
|---|---|---|
| Diversification | Moderate product diversification with growing product revenues, limited services segment | Focused primarily on advertising technology, less diversified product-wise |
| Profitability | Negative net margin (-35.45%), ROIC negative (-25.24%), value destroying | Positive net margin (16.08%), ROIC favorable (10.02%), value creating but with declining trend |
| Innovation | Strong product innovation driving revenue growth | Innovative in programmatic advertising, maintaining competitive edge |
| Global presence | Expanding global footprint but profitability challenges | Established global presence with efficient capital use |
| Market Share | Growing market share in cloud data warehousing | Solid market share in digital advertising, though facing competitive pressures |
Key takeaways: Snowflake shows strong revenue growth and innovation but struggles with profitability and efficient capital use, indicating higher risk. The Trade Desk maintains profitability and a favorable capital return profile, though its ROIC trend is slightly declining, warranting caution. Investors should weigh growth potential against profitability and capital efficiency.
Risk Analysis
Below is a summary table of key risks for Snowflake Inc. and The Trade Desk, Inc. based on the most recent financial and market data (2025 for Snowflake and 2024 for The Trade Desk).
| Metric | Snowflake Inc. (SNOW) | The Trade Desk, Inc. (TTD) |
|---|---|---|
| Market Risk | Beta 1.144, moderate volatility | Beta 1.105, moderate volatility |
| Debt level | Debt-to-Equity 0.9 (neutral) | Debt-to-Equity 0.11 (favorable) |
| Regulatory Risk | Moderate due to cloud data and privacy regulations | Moderate; advertising data privacy evolving |
| Operational Risk | High; negative net margin (-35.45%) and ROE (-42.86%) | Moderate; positive margins (16.08%) and ROE (13.33%) |
| Environmental Risk | Low; primarily software business | Low; primarily digital advertising platform |
| Geopolitical Risk | Exposure to US and international markets | Exposure to US and international markets |
The most impactful risks for Snowflake include operational challenges, reflected in negative profitability and returns, which could affect sustainability despite a strong Altman Z-score indicating low bankruptcy risk. The Trade Desk shows better operational performance but faces valuation risks with high P/E ratios, suggesting caution on price. Both companies have moderate market and regulatory risks typical of their tech sectors.
Which Stock to Choose?
Snowflake Inc. (SNOW) shows strong revenue growth of 29.2% in 2025 with a favorable gross margin of 66.5%, yet it struggles with negative profitability indicators including a -35.45% net margin, -42.86% ROE, and declining returns on invested capital. Its debt situation is moderate, and the overall rating is very favorable despite mixed financial ratios, resulting in a slightly unfavorable global ratio opinion and a very unfavorable MOAT status.
The Trade Desk, Inc. (TTD) presents a favorable income statement with a 25.6% revenue growth in 2024, a strong 16.08% net margin, and positive returns including 13.33% ROE and 10.02% ROIC. It maintains low debt levels and a solid liquidity position, reflected in a very favorable rating and a globally favorable ratio evaluation, though its MOAT remains slightly unfavorable due to declining ROIC trends.
For investors prioritizing growth and high revenue expansion, Snowflake’s rapid top-line increase might appear attractive despite profitability challenges. Conversely, those seeking a more balanced profile with positive earnings and stronger financial ratios may find The Trade Desk’s fundamentals more reassuring, though both face concerns over sustainability of returns and competitive moats.
Disclaimer: Investment carries a risk of loss of initial capital. The past performance is not a reliable indicator of future results. Be sure to understand risks before making an investment decision.
Go Further
I encourage you to read the complete analyses of Snowflake Inc. and The Trade Desk, Inc. to enhance your investment decisions: