In the fast-evolving technology sector, Shopify Inc. (SHOP) and The Trade Desk, Inc. (TTD) stand out as leaders in software applications with significant market presence. Shopify empowers merchants with a comprehensive commerce platform, while The Trade Desk specializes in data-driven digital advertising solutions. Both companies innovate at the intersection of e-commerce and marketing technology. This article will help you decide which company offers the most compelling investment opportunity in 2026.

Table of contents
Companies Overview
I will begin the comparison between Shopify Inc. and The Trade Desk, Inc. by providing an overview of these two companies and their main differences.
Shopify Inc. Overview
Shopify Inc. is a Canadian commerce company offering a platform that enables merchants to display, manage, market, and sell products across multiple sales channels worldwide. Its services include product and inventory management, order processing, payments, fulfillment, and customer relationship building. Shopify also provides merchant solutions such as payment acceptance, shipping, and working capital access, positioning itself as a comprehensive commerce platform.
The Trade Desk, Inc. Overview
The Trade Desk, Inc. is a US-based technology company operating a self-service cloud platform for data-driven digital advertising campaigns across formats like display, video, audio, and social media. It serves advertising agencies and service providers by enabling campaign creation, management, and optimization on various devices, including connected TV. The company emphasizes data and value-added services within the advertising ecosystem.
Key similarities and differences
Both Shopify and The Trade Desk operate in the technology sector within software applications, focusing on platform-based services to support client business processes. Shopify centers on commerce and merchant operations globally, while The Trade Desk specializes in digital advertising technology primarily for agencies. Their business models share cloud-based platform delivery but differ in target markets and service offerings, with Shopify emphasizing e-commerce infrastructure and The Trade Desk focusing on advertising campaign management.
Income Statement Comparison
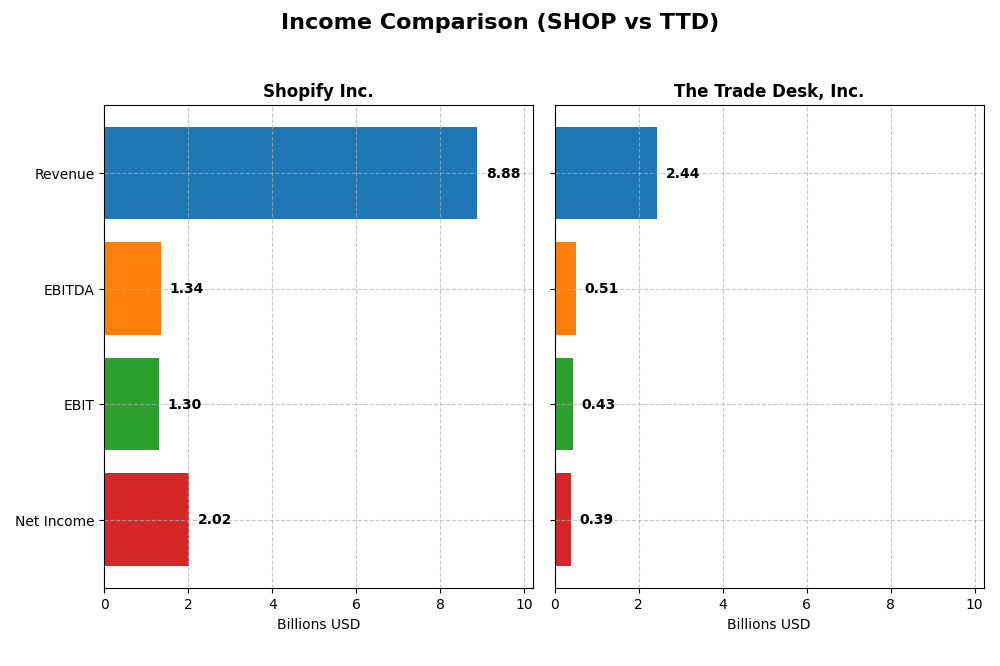
The table below compares key income statement metrics for Shopify Inc. and The Trade Desk, Inc. for the fiscal year 2024, providing a snapshot of their financial performance.
| Metric | Shopify Inc. (SHOP) | The Trade Desk, Inc. (TTD) |
|---|---|---|
| Market Cap | 204.5B | 17.5B |
| Revenue | 8.88B | 2.44B |
| EBITDA | 1.34B | 515M |
| EBIT | 1.30B | 427M |
| Net Income | 2.02B | 393M |
| EPS | 1.56 | 0.80 |
| Fiscal Year | 2024 | 2024 |
Income Statement Interpretations
Shopify Inc.
Shopify’s revenue and net income have shown strong growth from 2020 to 2024, with revenue more than tripling to 8.88B and net income surging to 2.02B. Margins improved significantly, with a gross margin over 50% and net margin reaching 22.74% in 2024. The company’s 2024 performance reflects accelerated growth and marked margin expansion, signaling robust profitability.
The Trade Desk, Inc.
The Trade Desk’s revenue rose steadily from 836M in 2020 to 2.44B in 2024, while net income increased to 393M. Gross margin remained high at 80.69%, and the EBIT margin improved to 17.47%. The 2024 year showed solid revenue and net income growth, although net margin growth over the entire period was negative, indicating some margin pressure despite overall favorable trends.
Which one has the stronger fundamentals?
Both companies exhibit favorable income statement evaluations, with Shopify showing more pronounced revenue and net income growth and significant margin improvements. The Trade Desk maintains a higher gross margin but experienced unfavorable net margin growth overall. Shopify’s comprehensive margin expansion and higher growth rates suggest stronger fundamentals based on income statement metrics.
Financial Ratios Comparison
The table below presents key financial ratios for Shopify Inc. and The Trade Desk, Inc. for the fiscal year ending 2024, allowing a side-by-side comparison of their recent operational and financial performance.
| Ratios | Shopify Inc. (SHOP) | The Trade Desk, Inc. (TTD) |
|---|---|---|
| ROE | 17.5% | 13.3% |
| ROIC | 7.5% | 10.0% |
| P/E | 68.2 | 146.8 |
| P/B | 11.9 | 19.6 |
| Current Ratio | 3.71 | 1.86 |
| Quick Ratio | 3.70 | 1.86 |
| D/E (Debt-to-Equity) | 0.097 | 0.106 |
| Debt-to-Assets | 8.1% | 5.1% |
| Interest Coverage | 0 | 0 |
| Asset Turnover | 0.64 | 0.40 |
| Fixed Asset Turnover | 63.4 | 5.17 |
| Payout ratio | 0 | 0 |
| Dividend yield | 0 | 0 |
Interpretation of the Ratios
Shopify Inc.
Shopify shows a mix of strong and weak ratios with favorable net margin (22.74%) and ROE (17.47%), but unfavorable high P/E (68.18) and price-to-book (11.91) ratios, indicating overvaluation concerns. Its very high current ratio (3.71) is seen as unfavorable, suggesting excess liquidity. Shopify pays no dividends, likely focusing on reinvestment to sustain growth.
The Trade Desk, Inc.
The Trade Desk presents generally favorable ratios, including a solid net margin of 16.08% and attractive ROIC (10.02%), with a reasonable current ratio (1.86) reflecting good liquidity management. However, its P/E ratio is high at 146.77, signaling valuation risk. The company does not pay dividends, prioritizing growth investments and R&D instead.
Which one has the best ratios?
The Trade Desk holds a more favorable overall ratios profile, with a higher percentage of favorable metrics (57.14%) compared to Shopify’s 50%. Despite Shopify’s stronger profitability ratios, its higher valuation multiples and liquidity concerns weigh down its appeal. Both companies refrain from dividend payments, focusing on growth strategies.
Strategic Positioning
This section compares the strategic positioning of Shopify Inc. and The Trade Desk, Inc. in terms of market position, key segments, and exposure to technological disruption:
Shopify Inc.
- Large market cap of 204B with high beta, facing tech sector competition
- Focuses on commerce platform with merchant and subscription solutions driving revenue
- Exposure to ecommerce platform innovation and payments technology disruption
The Trade Desk, Inc.
- Smaller market cap of 17B with moderate beta, competing in digital ad tech
- Operates cloud-based platform for managing data-driven digital advertising campaigns
- Exposure to digital advertising technology and cross-channel campaign optimization disruption
Shopify Inc. vs The Trade Desk, Inc. Positioning
Shopify shows a diversified business model with multiple revenue streams from merchant and subscription services, leveraging global commerce. The Trade Desk concentrates on digital advertising technology with specialized platform services. Shopify’s scale offers broad market reach, whereas The Trade Desk’s niche focus targets advertising agencies.
Which has the best competitive advantage?
Both companies have a slightly unfavorable moat status. Shopify is shedding value but with growing profitability, while The Trade Desk is also shedding value with declining profitability, indicating Shopify’s competitive advantage may be more resilient currently.
Stock Comparison
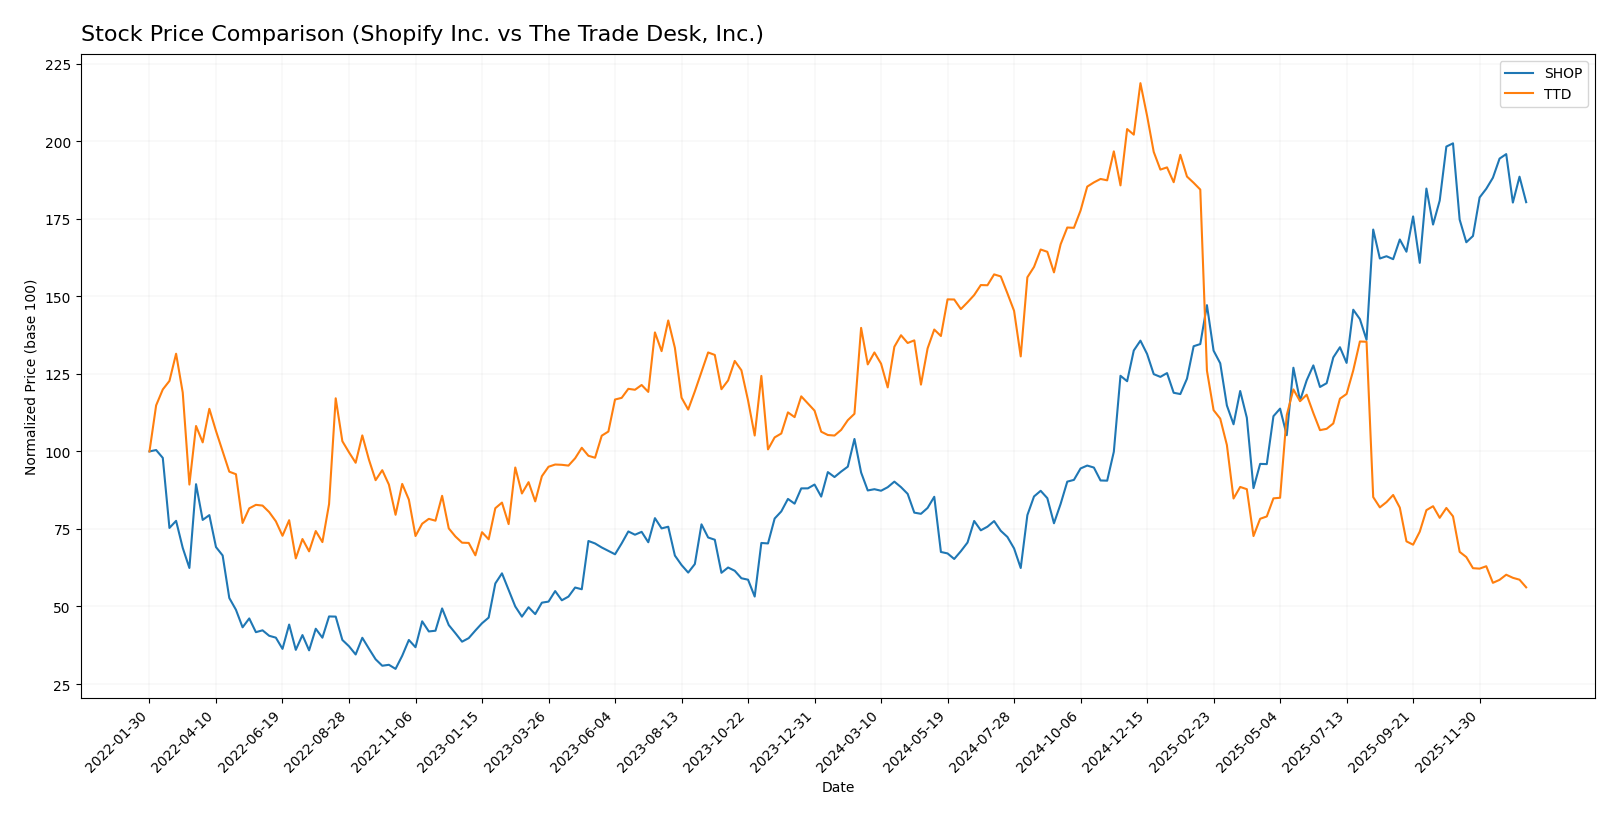
The past year revealed significant divergences in price trajectories and trading volumes between Shopify Inc. and The Trade Desk, Inc., highlighting contrasting market dynamics and investor sentiment.
Trend Analysis
Shopify Inc. exhibited a strong bullish trend over the past 12 months with a 106.34% price increase, despite a deceleration in momentum. The stock ranged from a low of 54.43 to a high of 173.86, showing high volatility with a 33.7 std deviation.
The Trade Desk, Inc. experienced a bearish trend with a 56.13% price decline over the same period, also decelerating. Its price fluctuated between 35.73 and 139.11, with a 28.35 std deviation, reflecting notable downside pressure.
Comparing both, Shopify delivered the highest market performance over the past year, outperforming The Trade Desk with a strong positive return versus a substantial loss.
Target Prices
Analysts present a clear target price consensus for Shopify Inc. and The Trade Desk, Inc.
| Company | Target High | Target Low | Consensus |
|---|---|---|---|
| Shopify Inc. | 200 | 140 | 186.24 |
| The Trade Desk, Inc. | 98 | 39 | 56.73 |
The consensus target for Shopify at 186.24 is above its current price of 157.10, indicating potential upside. For The Trade Desk, the target consensus at 56.73 also exceeds the current price of 35.71, suggesting room for growth.
Analyst Opinions Comparison
This section compares analysts’ ratings and grades for Shopify Inc. and The Trade Desk, Inc.:
Rating Comparison
Shopify Inc. Rating
- Rating: Both companies hold a “B” rating, indicating a very favorable standing.
- Discounted Cash Flow Score: Shopify has a moderate score of 3 reflecting average valuation.
- ROE Score: Shopify’s ROE score is 4, showing favorable profit generation from equity.
- ROA Score: Shopify excels with a very favorable score of 5, indicating efficient asset use.
- Debt To Equity Score: Both companies have a moderate score of 3, indicating balanced financial risk.
- Overall Score: Both firms share a moderate overall score of 3, reflecting average financial health.
The Trade Desk Rating
- Rating: Both companies hold a “B” rating, indicating a very favorable standing.
- Discounted Cash Flow Score: The Trade Desk scores 4, a favorable indicator of valuation.
- ROE Score: The Trade Desk also has a favorable ROE score of 4.
- ROA Score: The Trade Desk has a favorable score of 4, showing solid asset utilization.
- Debt To Equity Score: Both companies have a moderate score of 3, indicating balanced financial risk.
- Overall Score: Both firms share a moderate overall score of 3, reflecting average financial health.
Which one is the best rated?
Both Shopify and The Trade Desk have identical overall ratings and debt-to-equity scores. Shopify leads on return on assets, while The Trade Desk scores higher on discounted cash flow. Overall, the ratings show comparable financial strength with slight differences in specific metrics.
Scores Comparison
Here is a comparison of the Altman Z-Score and Piotroski Score for Shopify Inc. and The Trade Desk, Inc.:
Shopify Inc. Scores
- Altman Z-Score: 50.42, indicating a safe zone with very low bankruptcy risk.
- Piotroski Score: 6, reflecting average financial strength.
The Trade Desk Scores
- Altman Z-Score: 4.30, indicating a safe zone with low bankruptcy risk.
- Piotroski Score: 5, reflecting average financial strength.
Which company has the best scores?
Shopify has a notably higher Altman Z-Score than The Trade Desk, indicating stronger financial stability. Both companies share similar average Piotroski Scores, suggesting comparable financial health in that regard.
Grades Comparison
Here is the grades comparison for Shopify Inc. and The Trade Desk, Inc.:
Shopify Inc. Grades
The following table summarizes recent grade changes and recommendations for Shopify Inc.:
| Grading Company | Action | New Grade | Date |
|---|---|---|---|
| Scotiabank | Upgrade | Sector Outperform | 2026-01-08 |
| Wolfe Research | Downgrade | Peer Perform | 2026-01-06 |
| Wells Fargo | Maintain | Overweight | 2025-12-17 |
| Truist Securities | Maintain | Hold | 2025-11-05 |
| CIBC | Maintain | Outperform | 2025-11-05 |
| Cantor Fitzgerald | Maintain | Neutral | 2025-11-05 |
| DA Davidson | Maintain | Buy | 2025-11-05 |
| Scotiabank | Maintain | Sector Perform | 2025-11-05 |
| Needham | Maintain | Buy | 2025-11-05 |
| JP Morgan | Maintain | Overweight | 2025-11-05 |
Shopify’s grades show a mix of positive and neutral ratings with a recent upgrade by Scotiabank balanced by a downgrade from Wolfe Research.
The Trade Desk, Inc. Grades
The following table shows the latest grade updates and ratings for The Trade Desk, Inc.:
| Grading Company | Action | New Grade | Date |
|---|---|---|---|
| Morgan Stanley | Maintain | Equal Weight | 2026-01-13 |
| Wells Fargo | Maintain | Equal Weight | 2026-01-12 |
| Cantor Fitzgerald | Maintain | Neutral | 2026-01-08 |
| Wolfe Research | Maintain | Outperform | 2026-01-06 |
| Guggenheim | Maintain | Buy | 2026-01-05 |
| Jefferies | Maintain | Hold | 2025-12-11 |
| Wedbush | Maintain | Neutral | 2025-12-08 |
| DA Davidson | Maintain | Buy | 2025-11-10 |
| Truist Securities | Maintain | Buy | 2025-11-07 |
| Wells Fargo | Maintain | Equal Weight | 2025-11-07 |
The Trade Desk’s grades are predominantly stable with several buy ratings and consistent neutral to equal weight evaluations.
Which company has the best grades?
Both Shopify Inc. and The Trade Desk, Inc. have a consensus “Buy” rating, but Shopify has more overweight and outperform ratings, while The Trade Desk shows more equal weight and hold grades. This may imply Shopify is currently viewed with slightly higher growth expectations by analysts, potentially affecting investor confidence and portfolio positioning.
Strengths and Weaknesses
Below is a comparative overview of the key strengths and weaknesses of Shopify Inc. (SHOP) and The Trade Desk, Inc. (TTD) based on recent financial and operational data.
| Criterion | Shopify Inc. (SHOP) | The Trade Desk, Inc. (TTD) |
|---|---|---|
| Diversification | Moderate – Revenue mainly from Merchant Solutions and Subscription (6.53B & 2.35B USD in 2024) | Moderate – Focused on digital advertising platform, fewer segments |
| Profitability | Mixed – Net margin 22.74% (favorable), but ROIC 7.55% below WACC 17.1% (value destroying) | Mixed – Net margin 16.08% (favorable), ROIC 10.02% above WACC 8.88% (value creating) but declining |
| Innovation | Strong innovation indicated by growing ROIC trend (+514%) despite negative value creation | Innovation challenged – declining ROIC trend (-8.5%) suggests profitability pressures |
| Global presence | Strong global e-commerce platform presence | Strong global digital advertising reach |
| Market Share | Large in e-commerce platform market | Significant in programmatic advertising but highly competitive |
Key takeaways: Shopify shows robust revenue growth and innovation but struggles with value creation due to high capital costs. The Trade Desk is profitable with efficient capital use but faces declining returns, signaling caution on sustaining growth. Both companies have strong global footprints, yet their market focus and risks differ significantly.
Risk Analysis
Below is a comparative table highlighting key risk factors for Shopify Inc. (SHOP) and The Trade Desk, Inc. (TTD) based on their latest financial and market data from 2024:
| Metric | Shopify Inc. (SHOP) | The Trade Desk, Inc. (TTD) |
|---|---|---|
| Market Risk | High beta 2.84 indicates higher volatility and sensitivity to market swings | Moderate beta 1.11 suggests lower volatility relative to Shopify |
| Debt level | Low debt-to-equity ratio 0.10, strong balance sheet with favorable interest coverage | Low debt-to-equity ratio 0.11, also financially stable with strong coverage |
| Regulatory Risk | Moderate, as e-commerce faces evolving data privacy and cross-border compliance | Moderate, due to advertising regulations and data privacy laws, especially in US and EU |
| Operational Risk | Medium, reliance on platform stability and merchant adoption globally | Medium, depends on platform performance and advertising market cycles |
| Environmental Risk | Low, limited direct environmental impact given SaaS business model | Low, primarily software-based with minimal environmental footprint |
| Geopolitical Risk | Moderate, operates globally with exposure to international trade tensions and currency fluctuations | Moderate, US-based but with international clients, sensitive to geopolitical advertising restrictions |
In synthesis, Shopify’s higher market risk due to a volatile beta and its unfavorable valuation multiples pose notable concerns, despite strong financial health and low debt. The Trade Desk shows more moderate market risk but carries high valuation risk with an elevated P/E ratio. Regulatory and geopolitical factors are similarly moderate for both, impacting their operational environments. Investors should weigh Shopify’s growth potential against its volatility, while considering The Trade Desk’s premium valuation and sector-specific risks.
Which Stock to Choose?
Shopify Inc. (SHOP) shows robust income growth with a 25.78% revenue increase in 2024 and favorable profitability ratios including a 22.74% net margin and 17.47% ROE. It maintains low debt levels and a very favorable rating of B, though its WACC is high compared to ROIC, indicating slight value destruction despite improving profitability.
The Trade Desk, Inc. (TTD) reports solid income growth and a strong gross margin of 80.69%, with a 16.08% net margin and moderate ROE of 13.33%. It exhibits low debt and a favorable rating of B, but its ROIC trends downward and remains below WACC, suggesting ongoing value erosion and cautious outlook on profitability sustainability.
For investors seeking growth potential with improving profitability metrics, Shopify may appear more favorable, while those prioritizing a currently favorable financial ratio profile and moderate valuation might lean towards The Trade Desk, considering its stable rating but declining ROIC trend.
Disclaimer: Investment carries a risk of loss of initial capital. The past performance is not a reliable indicator of future results. Be sure to understand risks before making an investment decision.
Go Further
I encourage you to read the complete analyses of Shopify Inc. and The Trade Desk, Inc. to enhance your investment decisions: