In today’s dynamic software industry, Workday, Inc. and ServiceTitan, Inc. stand out as innovative leaders offering cloud-based applications tailored to business operations. Workday excels in enterprise financial and human capital management, while ServiceTitan focuses on field service software for residential and commercial infrastructure. Given their shared market in application software and distinct growth strategies, this analysis will help you decide which company presents the most compelling investment opportunity.
Table of contents
Companies Overview
I will begin the comparison between Workday, Inc. and ServiceTitan, Inc. by providing an overview of these two companies and their main differences.
Workday, Inc. Overview
Workday, Inc. provides enterprise cloud applications globally, focusing on financial management, human capital management, planning, and analytics. Its software helps organizations manage financial processes, employee lifecycles, and operational insights. Headquartered in Pleasanton, CA, Workday serves various industries including healthcare, education, and finance, positioning itself as a comprehensive cloud-based business management platform.
ServiceTitan, Inc. Overview
ServiceTitan, Inc. specializes in software for field service management, helping businesses install, maintain, and service infrastructure in residential and commercial buildings. Founded in 2008 and based in Glendale, CA, ServiceTitan targets the field service industry with solutions tailored to operational efficiency. It operates primarily in the technology sector and has a smaller workforce compared to Workday.
Key similarities and differences
Both companies operate in the technology sector and provide software-as-a-service solutions, focusing on improving business operations. Workday targets a broader market across multiple industries with enterprise cloud applications, while ServiceTitan concentrates on field service management for residential and commercial infrastructure. Workday has a significantly larger market cap and employee base, reflecting its broader scope and longer market presence.
Income Statement Comparison
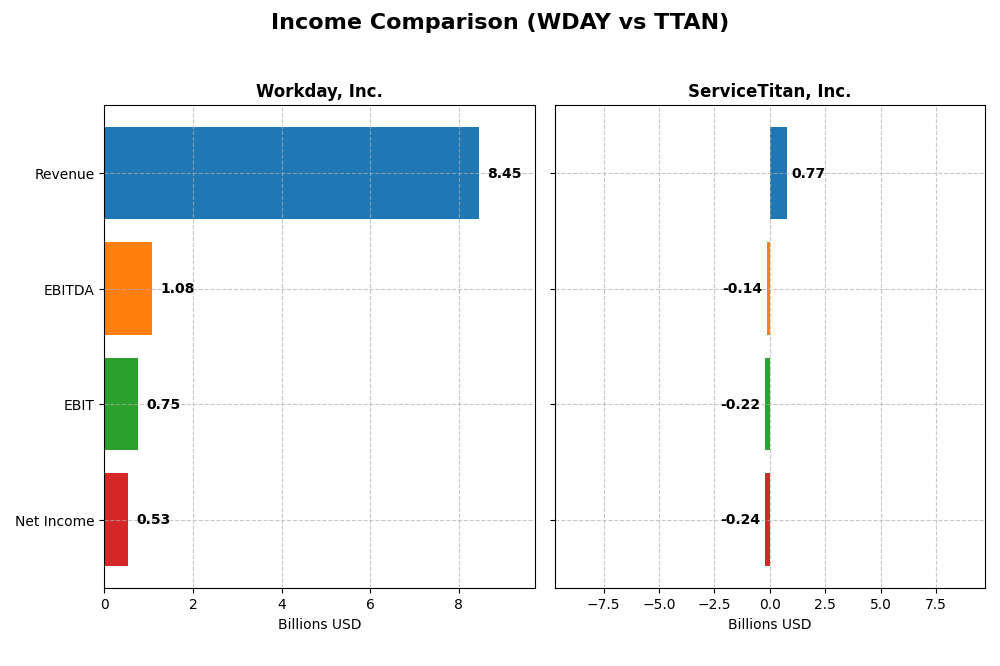
The table below presents a side-by-side comparison of the key income statement metrics for Workday, Inc. and ServiceTitan, Inc. for the fiscal year 2025.
| Metric | Workday, Inc. (WDAY) | ServiceTitan, Inc. (TTAN) |
|---|---|---|
| Market Cap | 49.9B | 8.5B |
| Revenue | 8.45B | 772M |
| EBITDA | 1.08B | -141M |
| EBIT | 752M | -221M |
| Net Income | 526M | -239M |
| EPS | 1.98 | -8.53 |
| Fiscal Year | 2025 | 2025 |
Income Statement Interpretations
Workday, Inc.
Workday’s revenue steadily increased from $4.32B in 2021 to $8.45B in 2025, nearly doubling over five years. Net income fluctuated, with losses in early years but a strong rebound to $526M in 2025. Gross margin remained robust at 75.5%, while net margin slipped to 6.23% in 2025. Despite a recent decline in net margin growth, overall profitability and revenue trends are positive.
ServiceTitan, Inc.
ServiceTitan’s revenue grew from $468M in 2023 to $772M in 2025, reflecting a solid 65% increase over three years. However, net income remained negative, reaching a loss of $239M in 2025. The gross margin was favorable at 64.9%, but ebit and net margins were significantly negative, indicating ongoing operating challenges. Recent revenue growth was strong, but profitability remains elusive.
Which one has the stronger fundamentals?
Workday shows stronger fundamentals with higher and improving revenue, positive net income, and favorable margin metrics despite some margin volatility. ServiceTitan, while growing revenue rapidly, struggles with consistent losses and negative margins. Workday’s more balanced profitability and margin stability suggest a firmer financial footing compared to ServiceTitan’s current operating deficits.
Financial Ratios Comparison
The table below presents a side-by-side comparison of key financial ratios for Workday, Inc. (WDAY) and ServiceTitan, Inc. (TTAN) based on their most recent fiscal year data from 2025.
| Ratios | Workday, Inc. (WDAY) | ServiceTitan, Inc. (TTAN) |
|---|---|---|
| ROE | 5.82% | -16.44% |
| ROIC | 2.73% | -14.11% |
| P/E | 132.15 | -18.12 |
| P/B | 7.69 | 2.98 |
| Current Ratio | 1.85 | 3.74 |
| Quick Ratio | 1.85 | 3.74 |
| D/E | 0.37 | 0.11 |
| Debt-to-Assets | 18.70% | 9.35% |
| Interest Coverage | 3.64 | -14.82 |
| Asset Turnover | 0.47 | 0.44 |
| Fixed Asset Turnover | 5.36 | 9.57 |
| Payout ratio | 0 | 0 |
| Dividend yield | 0 | 0 |
Interpretation of the Ratios
Workday, Inc.
Workday, Inc. shows a balanced mix of favorable and unfavorable ratios, with strengths in liquidity (current and quick ratios at 1.85) and low leverage (debt-to-equity at 0.37). However, profitability ratios like return on equity (5.82%) and return on invested capital (2.73%) are weak, and valuation multiples such as P/E (132.15) are high. The company does not pay dividends, reflecting a reinvestment strategy focused on growth and R&D.
ServiceTitan, Inc.
ServiceTitan, Inc. presents several unfavorable profitability and coverage ratios, including a negative net margin (-30.98%) and interest coverage (-14.26), indicating operational challenges. Its liquidity is mixed, with a strong quick ratio (3.74) but a flagged current ratio. The firm does not distribute dividends, which aligns with its negative earnings and emphasis on reinvestment and expansion.
Which one has the best ratios?
Workday’s ratios reflect a more stable financial position with balanced liquidity and manageable debt, despite high valuation and modest returns. ServiceTitan exhibits more pronounced weaknesses in profitability and coverage, alongside mixed liquidity signals. Overall, Workday’s financial ratios appear more favorable, while ServiceTitan’s metrics suggest higher risk and operational strain.
Strategic Positioning
This section compares the strategic positioning of Workday and ServiceTitan including Market position, Key segments, and disruption:
Workday, Inc.
- Large market cap of 49.9B USD with strong NASDAQ presence; faces competitive pressure in enterprise applications.
- Focuses on enterprise cloud applications including financial management, human capital management, and analytics; subscription services drive revenue.
- Exposure to cloud and AI-driven analytics in enterprise SaaS; evolving technology trends impact product innovation.
ServiceTitan, Inc.
- Smaller market cap of 8.5B USD; competes in field service software for residential and commercial sectors.
- Concentrates on field service management platform and subscription revenue for infrastructure maintenance services.
- Technology disruption limited to field service software; stable but less diversified technological exposure.
Workday, Inc. vs ServiceTitan, Inc. Positioning
Workday adopts a diversified approach targeting multiple enterprise segments with cloud and analytics, offering scale advantages. ServiceTitan is more concentrated on field service software, focusing on a niche market with potentially less diversification but specialized offerings.
Which has the best competitive advantage?
Both companies are currently shedding value relative to their cost of capital. Workday shows a growing ROIC trend, indicating improving profitability, while ServiceTitan’s profitability is stable but unfavorable, suggesting Workday has a slightly stronger competitive advantage.
Stock Comparison
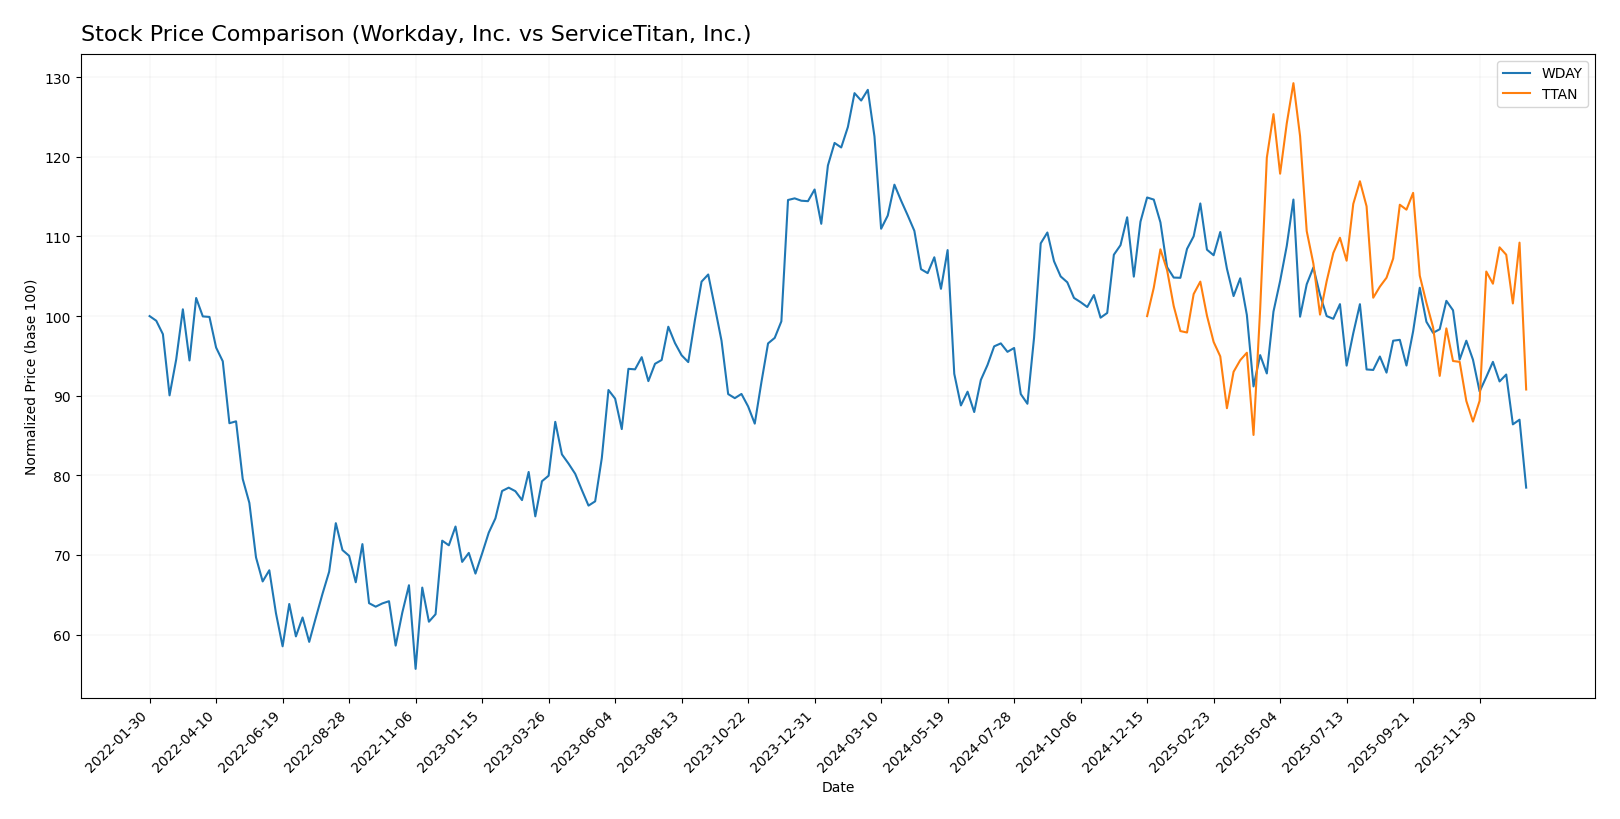
The stock prices of Workday, Inc. (WDAY) and ServiceTitan, Inc. (TTAN) have exhibited notable bearish trends over the past 12 months, with both experiencing significant declines and distinct trading volume dynamics.
Trend Analysis
Workday, Inc. (WDAY) showed a bearish trend over the past year with a price decrease of 38.91%, accompanied by a deceleration in the downward trend and a high volatility level at 20.22 std deviation.
ServiceTitan, Inc. (TTAN) also experienced a bearish trend with a 9.22% price drop over the past year but showed acceleration in the decline and lower volatility at 9.86 std deviation.
Comparatively, TTAN delivered the highest market performance, with a smaller percentage loss than WDAY, reflecting a less severe bearish trend over the analyzed period.
Target Prices
The target price consensus for Workday, Inc. and ServiceTitan, Inc. reflects optimistic analyst expectations.
| Company | Target High | Target Low | Consensus |
|---|---|---|---|
| Workday, Inc. | 320 | 235 | 274.47 |
| ServiceTitan, Inc. | 145 | 117 | 132.44 |
Analysts expect both stocks to appreciate, with Workday’s consensus target significantly above its current price of 187, and ServiceTitan’s target also well above its current price of 91, indicating potential upside.
Analyst Opinions Comparison
This section compares analysts’ ratings and grades for Workday, Inc. (WDAY) and ServiceTitan, Inc. (TTAN):
Rating Comparison
WDAY Rating
- Rating: B-, rated as Very Favorable overall.
- Discounted Cash Flow Score: 4, indicating a Favorable valuation based on future cash flow.
- ROE Score: 3, reflecting Moderate efficiency in generating profit from equity.
- ROA Score: 3, showing Moderate effectiveness in asset utilization to generate earnings.
- Debt To Equity Score: 2, indicating Moderate financial risk with some leverage.
- Overall Score: 2, a Moderate summary of the company’s financial standing.
TTAN Rating
- Rating: C-, also rated as Very Favorable overall.
- Discounted Cash Flow Score: 1, indicating a Very Unfavorable valuation.
- ROE Score: 1, reflecting Very Unfavorable efficiency in generating profit from equity.
- ROA Score: 1, showing Very Unfavorable asset utilization effectiveness.
- Debt To Equity Score: 3, indicating Moderate financial risk with more leverage.
- Overall Score: 1, a Very Unfavorable summary of the company’s financial standing.
Which one is the best rated?
Based strictly on the provided data, WDAY holds a higher overall rating (B-) and better scores in discounted cash flow, ROE, and ROA compared to TTAN’s lower scores and C- rating. WDAY is therefore better rated by analysts.
Scores Comparison
Here is a comparison of the Altman Z-Score and Piotroski Score for Workday, Inc. and ServiceTitan, Inc.:
WDAY Scores
- Altman Z-Score: 4.41, indicating financial safety zone.
- Piotroski Score: 6, reflecting average financial strength.
TTAN Scores
- Altman Z-Score: 15.74, indicating financial safety zone.
- Piotroski Score: 6, reflecting average financial strength.
Which company has the best scores?
ServiceTitan has a significantly higher Altman Z-Score than Workday, both in the safe zone, while both share an identical average Piotroski Score of 6. Thus, ServiceTitan shows stronger financial stability based on these metrics.
Grades Comparison
Here is a comparison of the latest grades assigned to Workday, Inc. and ServiceTitan, Inc.:
Workday, Inc. Grades
This table summarizes the recent grades from recognized financial institutions for Workday, Inc.:
| Grading Company | Action | New Grade | Date |
|---|---|---|---|
| Barclays | Maintain | Overweight | 2026-01-12 |
| RBC Capital | Maintain | Outperform | 2026-01-05 |
| TD Cowen | Maintain | Buy | 2025-11-26 |
| DA Davidson | Maintain | Neutral | 2025-11-26 |
| Wells Fargo | Maintain | Overweight | 2025-11-26 |
| Barclays | Maintain | Overweight | 2025-11-26 |
| Keybanc | Maintain | Overweight | 2025-11-26 |
| Citigroup | Maintain | Neutral | 2025-11-26 |
| JP Morgan | Maintain | Overweight | 2025-11-26 |
| UBS | Maintain | Neutral | 2025-11-26 |
The overall trend for Workday shows consistent overweight and buy ratings with several neutral stances, reflecting moderate positive sentiment.
ServiceTitan, Inc. Grades
Below is a summary of recent grades from reputable grading companies for ServiceTitan, Inc.:
| Grading Company | Action | New Grade | Date |
|---|---|---|---|
| Piper Sandler | Maintain | Overweight | 2025-12-05 |
| BMO Capital | Maintain | Outperform | 2025-12-05 |
| TD Cowen | Maintain | Buy | 2025-12-05 |
| Morgan Stanley | Maintain | Equal Weight | 2025-12-05 |
| BMO Capital | Maintain | Outperform | 2025-11-20 |
| Wells Fargo | Maintain | Overweight | 2025-09-19 |
| Stifel | Maintain | Buy | 2025-09-19 |
| Piper Sandler | Maintain | Overweight | 2025-09-19 |
| Canaccord Genuity | Maintain | Buy | 2025-09-19 |
| Citigroup | Maintain | Neutral | 2025-09-09 |
ServiceTitan’s grades mainly include overweight, outperform, and buy ratings, with a few neutral and equal weight assessments, indicating generally favorable analyst views.
Which company has the best grades?
Both Workday, Inc. and ServiceTitan, Inc. have received predominantly positive grades, with a majority of buy, outperform, and overweight recommendations. Workday shows a larger volume of ratings maintaining overweight and outperform grades, suggesting slightly stronger consensus optimism, which may influence investor confidence and valuation considerations.
Strengths and Weaknesses
Below is a comparison of key strengths and weaknesses of Workday, Inc. (WDAY) and ServiceTitan, Inc. (TTAN) based on the latest available data.
| Criterion | Workday, Inc. (WDAY) | ServiceTitan, Inc. (TTAN) |
|---|---|---|
| Diversification | Primarily subscription services with growing professional services; strong recurring revenue base (7.7B subscription in 2025) | Platform and subscription revenue less diversified, smaller scale (1.3B total in 2025) |
| Profitability | Net margin 6.23%, ROIC 2.73% but below WACC (8.86%), value shedding despite growth | Negative net margin (-31%), ROIC (-14.1%), also shedding value, profitability unstable |
| Innovation | Consistent investment in cloud HR and financial solutions; growing ROIC trend indicates improving efficiency | Innovation in trade/service software but profitability and ROIC remain unfavorable and flat |
| Global presence | Established global footprint in enterprise SaaS markets | More regional focus, less global scale |
| Market Share | Large market share in enterprise cloud HR and finance | Smaller market share in niche trade/service software |
Key takeaways: Both companies currently destroy value as ROIC is below WACC, but Workday shows a positive trend in ROIC growth and stronger recurring revenues. ServiceTitan faces more profitability challenges and remains slightly unfavorable. Investors should weigh Workday’s improving profitability and scale against ServiceTitan’s higher risks.
Risk Analysis
Below is a comparison of key risks for Workday, Inc. (WDAY) and ServiceTitan, Inc. (TTAN) as of 2025:
| Metric | Workday, Inc. (WDAY) | ServiceTitan, Inc. (TTAN) |
|---|---|---|
| Market Risk | Beta 1.14, moderate volatility | Beta -0.85, negative correlation to market |
| Debt level | Debt-to-Equity 0.37, low risk | Debt-to-Equity 0.11, very low risk |
| Regulatory Risk | Moderate, tech industry regulations | Moderate, tech and field service regulations |
| Operational Risk | Medium, large workforce (20K+) complexity | Medium, smaller workforce (~3K) but newer IPO |
| Environmental Risk | Low, primarily software business | Low, service software with minimal direct impact |
| Geopolitical Risk | Moderate, global operations exposure | Moderate, US-focused but supply chain sensitive |
Workday faces moderate market and regulatory risks due to its large scale and global reach, while ServiceTitan’s key risks stem from its negative market beta and unprofitable status. Both show low debt risk, but ServiceTitan’s operational and financial instability pose higher impact risks. Caution is advised, especially with ServiceTitan’s current losses and market sensitivity.
Which Stock to Choose?
Workday, Inc. (WDAY) shows a favorable income evolution with 16.35% revenue growth in 2025 and a strong 95.6% over five years. Its financial ratios are mixed; profitability is moderate with a 6.23% net margin, but ROE and ROIC are unfavorable. Debt levels and liquidity ratios remain favorable, supported by a B- rating and a slightly unfavorable MOAT due to value shedding despite growing profitability.
ServiceTitan, Inc. (TTAN) reports a favorable revenue growth of 25.64% in 2025 and 65.02% overall since 2023, but profitability is negative with a -30.98% net margin. Its financial ratios lean unfavorable, especially ROE and ROIC, though it maintains low debt and a C- rating. The MOAT evaluation is unfavorable, reflecting stable but value-destroying performance with average financial strength scores.
Considering ratings and comprehensive income and ratio evaluations, Workday might appear more favorable for investors prioritizing steady income growth and improving profitability. Conversely, ServiceTitan could be interpreted as more suitable for those with a higher risk tolerance interested in revenue expansion despite current losses and value erosion.
Disclaimer: Investment carries a risk of loss of initial capital. The past performance is not a reliable indicator of future results. Be sure to understand risks before making an investment decision.
Go Further
I encourage you to read the complete analyses of Workday, Inc. and ServiceTitan, Inc. to enhance your investment decisions: