Unity Software Inc. and ServiceTitan, Inc. are two innovative players in the software application industry, each carving a unique niche with cutting-edge technology solutions. Unity focuses on real-time 3D content across diverse platforms, while ServiceTitan streamlines field service operations for residential and commercial infrastructure. This comparison highlights their market strategies and growth potential, helping you decide which company deserves a place in your investment portfolio.
Table of contents
Companies Overview
I will begin the comparison between Unity Software Inc. and ServiceTitan, Inc. by providing an overview of these two companies and their main differences.
Unity Software Inc. Overview
Unity Software Inc. develops and operates a real-time 3D content platform that supports interactive 2D and 3D content creation for multiple devices, including mobile phones, consoles, and augmented reality gadgets. Serving content creators and developers globally, it offers software solutions to monetize and run immersive experiences. Founded in 2004, Unity is headquartered in San Francisco and trades on the NYSE with a market cap of around 17.5B USD.
ServiceTitan, Inc. Overview
ServiceTitan, Inc. provides software solutions for managing field service operations related to the installation, maintenance, and servicing of residential and commercial infrastructure. Founded in 2008 and based in Glendale, CA, it offers technology to streamline field service activities. The company is publicly traded on NASDAQ with a market cap of approximately 8.5B USD and employs just over 3,000 people.
Key similarities and differences
Both companies operate in the software application industry within the technology sector and target professional users through SaaS solutions. Unity focuses on content creation and real-time 3D platforms for diverse digital media, while ServiceTitan specializes in software for field service management in the building infrastructure sector. Unity’s business is more global and content-driven, whereas ServiceTitan’s is niche and operationally focused on service workflows.
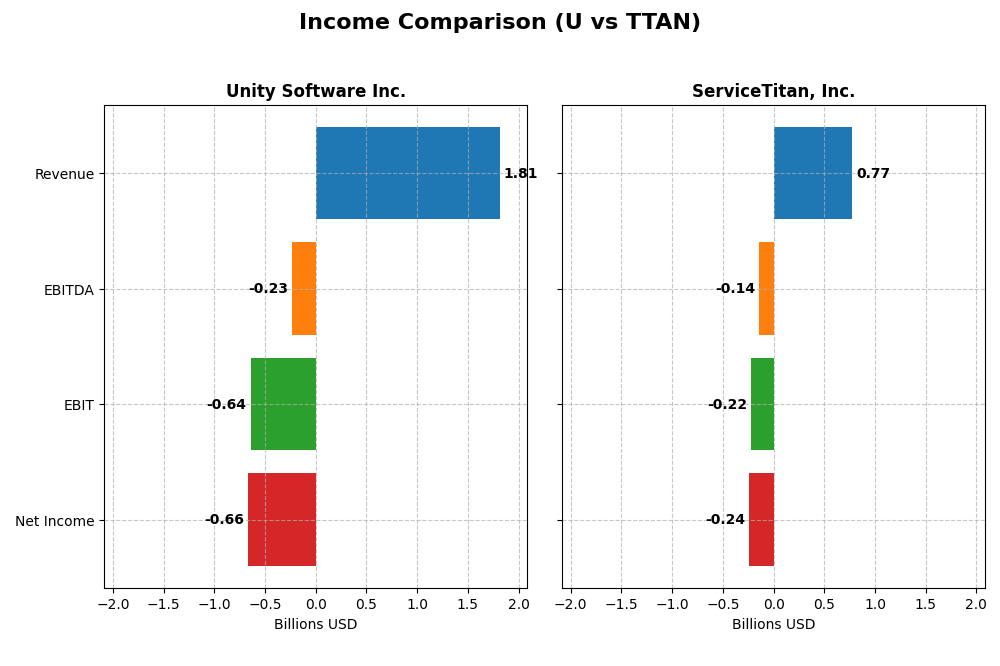
Income Statement Comparison
This table compares the most recent full fiscal year income statement metrics for Unity Software Inc. and ServiceTitan, Inc., providing a snapshot of their financial performance.
| Metric | Unity Software Inc. | ServiceTitan, Inc. |
|---|---|---|
| Market Cap | 17.5B | 8.5B |
| Revenue | 1.81B | 771.9M |
| EBITDA | -235M | -141M |
| EBIT | -644M | -221M |
| Net Income | -664M | -239M |
| EPS | -1.68 | -8.53 |
| Fiscal Year | 2024 | 2025 |
Income Statement Interpretations
Unity Software Inc.
Unity’s revenue grew significantly by 135% from 2020 to 2024, but net income remained negative and declined overall by 135%. In 2024, revenue fell 17% year-over-year, and gross profit also decreased by 8%. Despite this, EBIT improved by 17%, showing some operational recovery, though net margins stayed negative at -36.6%, reflecting ongoing profitability challenges.
ServiceTitan, Inc.
ServiceTitan’s revenue grew 65% from 2023 to 2025, with net income improving by 11% over the same period. In 2025, revenue increased 26% year-over-year, accompanied by a 33% rise in gross profit, but EBIT fell 27%, indicating rising costs. The net margin remained negative near -31%, though margin growth over the period was favorable, suggesting gradual improvement.
Which one has the stronger fundamentals?
ServiceTitan presents a more favorable income statement evaluation, with half of key metrics positive, including revenue and net income growth, and improved net margin over time. Unity shows strong revenue growth but persistent losses and unfavorable margin trends dominate. ServiceTitan’s more balanced growth and margin improvements suggest relatively stronger fundamentals based on recent income statement performance.
Financial Ratios Comparison
Below is a comparative overview of the most recent financial ratios for Unity Software Inc. and ServiceTitan, Inc., reflecting key performance and financial health indicators for fiscal year 2024/2025.
| Ratios | Unity Software Inc. (2024) | ServiceTitan, Inc. (2025) |
|---|---|---|
| ROE | -20.8% | -16.4% |
| ROIC | -12.8% | -14.1% |
| P/E | -13.4 | -18.1 |
| P/B | 2.79 | 2.98 |
| Current Ratio | 2.50 | 3.74 |
| Quick Ratio | 2.50 | 3.74 |
| D/E | 0.74 | 0.11 |
| Debt-to-Assets | 34.9% | 9.4% |
| Interest Coverage | -32.1 | -14.8 |
| Asset Turnover | 0.27 | 0.44 |
| Fixed Asset Turnover | 18.3 | 9.57 |
| Payout Ratio | 0 | 0 |
| Dividend Yield | 0% | 0% |
Interpretation of the Ratios
Unity Software Inc.
Unity Software’s ratios present a mixed picture with a slight tilt towards unfavorable. Key profitability measures such as net margin (-36.63%), ROE (-20.81%), and ROIC (-12.78%) are weak, signaling operational challenges. However, liquidity ratios like the current and quick ratio (both 2.5) are favorable, indicating solid short-term financial health. Unity does not pay dividends, focusing instead on reinvestment and growth, consistent with its negative earnings and high R&D expenses.
ServiceTitan, Inc.
ServiceTitan shows a similar trend with several unfavorable profitability ratios, including net margin (-30.98%) and ROE (-16.44%). Its weighted average cost of capital at 4.95% is favorable, and the company maintains low debt-to-equity (0.11) and debt-to-assets (9.35%) ratios, indicating a conservative capital structure. ServiceTitan also does not pay dividends, likely due to ongoing investments in growth and research, aligned with its negative net income.
Which one has the best ratios?
Both Unity Software and ServiceTitan share a slightly unfavorable overall ratio profile, each with half of their key ratios marked unfavorable. ServiceTitan edges ahead in capital structure strength and lower leverage, while Unity benefits from better liquidity and fixed asset turnover. Neither company pays dividends, reflecting prioritization of growth over shareholder returns at this stage.
Strategic Positioning
This section compares the strategic positioning of Unity Software Inc. and ServiceTitan, Inc. including Market position, Key segments, and disruption:
Unity Software Inc.
- Large market cap of 17.5B, faces high beta indicating higher volatility and competitive pressure.
- Focused on Create and Operate Solutions for real-time 2D and 3D content across multiple platforms.
- Exposed to technological disruption through interactive real-time 3D content software innovation.
ServiceTitan, Inc.
- Smaller market cap of 8.5B, with negative beta indicating lower correlation to market swings.
- Concentrates on platform and subscription revenues servicing field service infrastructure.
- Exposure tied to software solutions for field service operations in residential and commercial sectors.
Unity Software Inc. vs ServiceTitan, Inc. Positioning
Unity is diversified in software for a broad creative market with global reach, while ServiceTitan is concentrated in field service software. Unity’s broader segments offer scale but face high market volatility; ServiceTitan’s niche focus provides specialization but limits market scope.
Which has the best competitive advantage?
Both companies are shedding value as their ROIC is below WACC. Unity shows a very unfavorable moat with declining profitability, whereas ServiceTitan’s moat is unfavorable but with stable profitability, indicating neither currently holds a strong competitive advantage.
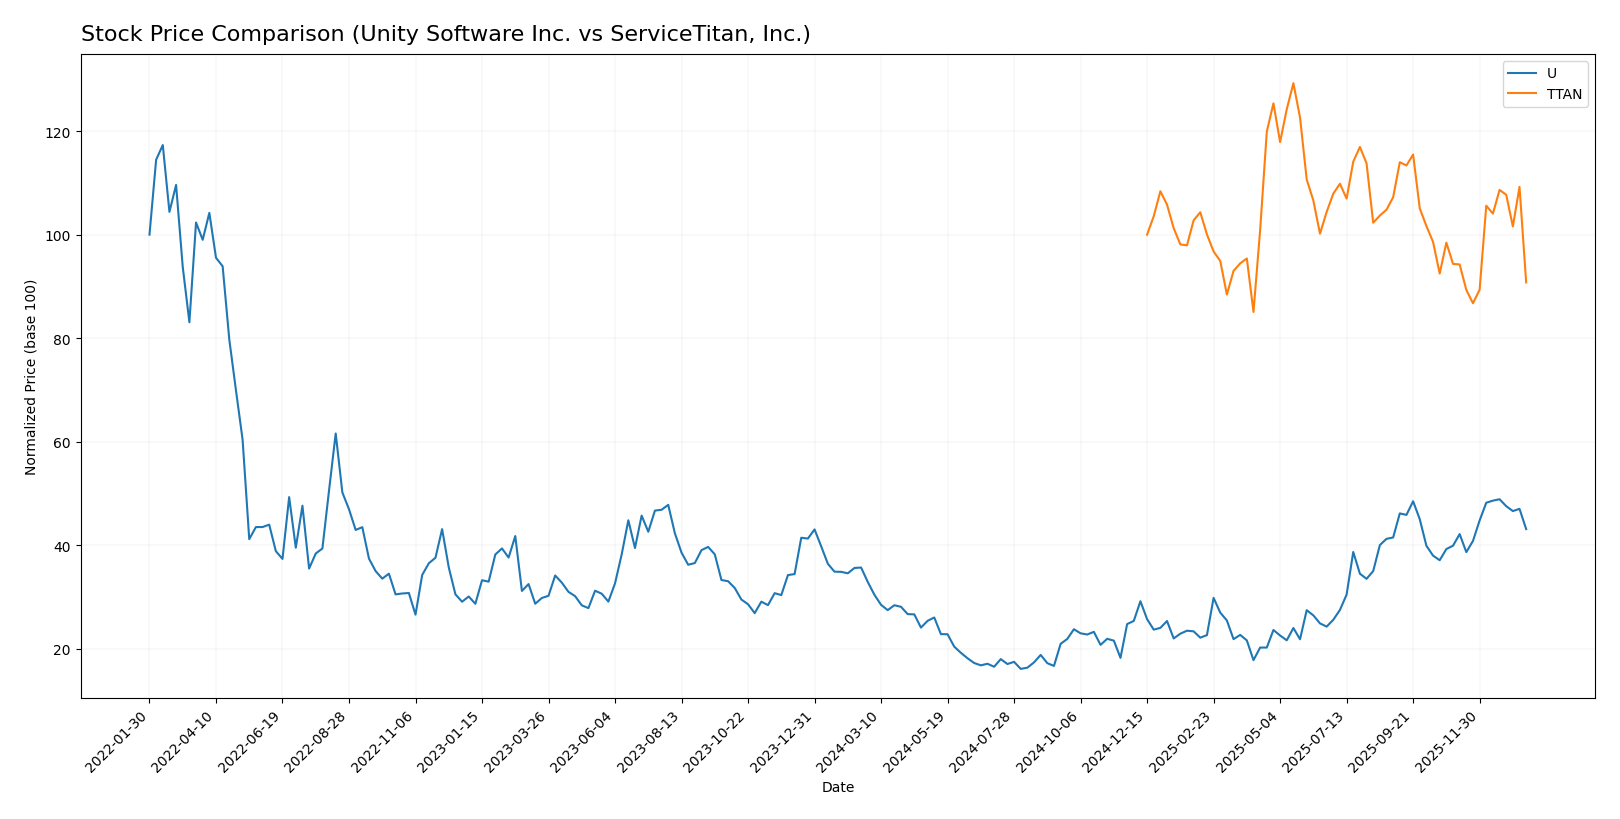
Stock Comparison
The stock price movements of Unity Software Inc. and ServiceTitan, Inc. over the past 12 months reveal distinct trading dynamics, with Unity showing a significant upward trajectory while ServiceTitan experienced a notable decline.
Trend Analysis
Unity Software Inc. exhibited a bullish trend with a 31.0% price increase over the past year, marked by acceleration and a high volatility level (9.04 std deviation). The stock reached a peak of 46.42 and a low of 15.32.
ServiceTitan, Inc. showed a bearish trend with a 9.22% price decline over the same period. Despite acceleration in the downward trend, the stock demonstrated slightly higher volatility at 9.86 std deviation, hitting a high of 129.26 and a low of 85.07.
Comparing the two, Unity Software Inc. delivered the highest market performance with a strong positive price change, while ServiceTitan, Inc. underperformed with a significant negative return.
Target Prices
Analysts present a clear consensus on target prices for Unity Software Inc. and ServiceTitan, Inc.
| Company | Target High | Target Low | Consensus |
|---|---|---|---|
| Unity Software Inc. | 60 | 39 | 50.98 |
| ServiceTitan, Inc. | 145 | 117 | 132.44 |
The consensus target prices suggest upside potential for both stocks compared to current prices: Unity Software trades near 40.95 USD, well below its 50.98 USD consensus, while ServiceTitan’s current price of 90.78 USD is significantly under its 132.44 USD consensus. This indicates generally positive analyst expectations for growth.
Analyst Opinions Comparison
This section compares analysts’ ratings and grades for Unity Software Inc. and ServiceTitan, Inc.:
Rating Comparison
Unity Software Inc. Rating
- Rating: D+ with a very favorable status from analysts.
- Discounted Cash Flow Score: 1, indicating very unfavorable DCF.
- ROE Score: 1, showing very unfavorable return on equity.
- ROA Score: 1, reflecting very unfavorable return on assets.
- Debt To Equity Score: 1, very unfavorable financial risk score.
- Overall Score: 1, marked as very unfavorable overall rating.
ServiceTitan, Inc. Rating
- Rating: C- with a very favorable status from analysts.
- Discounted Cash Flow Score: 1, indicating very unfavorable DCF.
- ROE Score: 1, showing very unfavorable return on equity.
- ROA Score: 1, reflecting very unfavorable return on assets.
- Debt To Equity Score: 3, indicating a moderate financial risk profile.
- Overall Score: 1, marked as very unfavorable overall rating.
Which one is the best rated?
ServiceTitan holds a higher rating grade of C- compared to Unity’s D+, reflecting a slightly better analyst rating despite both having very unfavorable overall scores. ServiceTitan’s debt-to-equity score is notably stronger, indicating comparatively lower financial risk.
Scores Comparison
Here is a comparison of the Altman Z-Score and Piotroski Score for both companies:
Unity Software Inc. Scores
- Altman Z-Score: 2.93, indicating moderate bankruptcy risk in the grey zone.
- Piotroski Score: 4, reflecting average financial strength.
ServiceTitan, Inc. Scores
- Altman Z-Score: 15.74, indicating very low bankruptcy risk in the safe zone.
- Piotroski Score: 6, reflecting average financial strength.
Which company has the best scores?
Based on the provided data, ServiceTitan shows a significantly stronger Altman Z-Score, placing it in the safe zone, while Unity is in the grey zone. Both have average Piotroski Scores, with ServiceTitan slightly higher at 6 versus 4 for Unity.
Grades Comparison
The following comparison presents the recent grades from reputable financial institutions for both Unity Software Inc. and ServiceTitan, Inc.:
Unity Software Inc. Grades
This table summarizes the latest grades and rating actions from established grading companies for Unity Software Inc.
| Grading Company | Action | New Grade | Date |
|---|---|---|---|
| Morgan Stanley | Maintain | Overweight | 2026-01-13 |
| Goldman Sachs | Maintain | Neutral | 2026-01-13 |
| Wells Fargo | Maintain | Overweight | 2026-01-08 |
| Jefferies | Maintain | Buy | 2026-01-05 |
| Piper Sandler | Upgrade | Overweight | 2025-12-11 |
| BTIG | Upgrade | Buy | 2025-12-11 |
| Wells Fargo | Upgrade | Overweight | 2025-12-05 |
| Arete Research | Upgrade | Buy | 2025-12-01 |
| Citigroup | Maintain | Buy | 2025-11-11 |
| Wells Fargo | Maintain | Equal Weight | 2025-11-07 |
Overall, Unity Software Inc. has seen multiple upgrades and maintains a positive outlook with several “Buy” and “Overweight” ratings from reputable firms.
ServiceTitan, Inc. Grades
Below is the summary table of the most recent grades from credible grading companies for ServiceTitan, Inc.
| Grading Company | Action | New Grade | Date |
|---|---|---|---|
| Piper Sandler | Maintain | Overweight | 2025-12-05 |
| BMO Capital | Maintain | Outperform | 2025-12-05 |
| TD Cowen | Maintain | Buy | 2025-12-05 |
| Morgan Stanley | Maintain | Equal Weight | 2025-12-05 |
| BMO Capital | Maintain | Outperform | 2025-11-20 |
| Wells Fargo | Maintain | Overweight | 2025-09-19 |
| Stifel | Maintain | Buy | 2025-09-19 |
| Piper Sandler | Maintain | Overweight | 2025-09-19 |
| Canaccord Genuity | Maintain | Buy | 2025-09-19 |
| Citigroup | Maintain | Neutral | 2025-09-09 |
ServiceTitan, Inc. maintains a solid rating trend with consistent “Buy,” “Overweight,” and “Outperform” grades, reflecting sustained analyst confidence.
Which company has the best grades?
Both Unity Software Inc. and ServiceTitan, Inc. have received predominantly positive grades with strong buy-side consensus. Unity shows recent upgrades indicating improving sentiment, while ServiceTitan displays steady, consistent buy and outperform ratings. Investors may find these patterns indicative of analyst confidence but should consider other risk factors.
Strengths and Weaknesses
Below is a comparative summary of the key strengths and weaknesses of Unity Software Inc. (U) and ServiceTitan, Inc. (TTAN) based on the most recent financial and operational data.
| Criterion | Unity Software Inc. (U) | ServiceTitan, Inc. (TTAN) |
|---|---|---|
| Diversification | Moderate: Revenue split between Create Solutions (614M) and Operate Solutions (1.2B) | Focused: Platform Revenue (739M) and Subscription Revenue (566M) |
| Profitability | Negative margins and ROIC (-12.8%), shedding value, declining profitability | Negative margins and ROIC (-14.1%), shedding value, stable but unfavorable profitability |
| Innovation | Strong product innovation in software solutions, but declining financial returns | Innovative SaaS platform for trades, but financials indicate challenges in value creation |
| Global presence | Significant presence in software markets globally | Primarily North American market focus with SaaS platform |
| Market Share | Leading in game development and real-time 3D content tools | Strong in trades service management software, growing market share |
Key takeaways: Both companies face profitability challenges and are currently value destroyers, with Unity showing a declining ROIC trend versus ServiceTitan’s stable but unfavorable trend. Unity’s diversified product segments contrast with ServiceTitan’s focused SaaS offerings. Caution is advised due to ongoing negative returns despite innovation and market presence.
Risk Analysis
Below is a comparative overview of key risks for Unity Software Inc. (U) and ServiceTitan, Inc. (TTAN) as of the most recent fiscal years.
| Metric | Unity Software Inc. (U) | ServiceTitan, Inc. (TTAN) |
|---|---|---|
| Market Risk | High beta (2.05) indicating high volatility | Negative beta (-0.85) suggesting inverse market movement |
| Debt level | Moderate debt-to-equity (0.74), 35% debt-to-assets | Low debt-to-equity (0.11), 9.4% debt-to-assets |
| Regulatory Risk | Moderate, tech sector subject to data/privacy rules | Moderate, similar industry and regulatory environment |
| Operational Risk | Unfavorable profitability and efficiency ratios | Unfavorable margins but lower leverage reduce risk |
| Environmental Risk | Limited direct exposure, software focus | Limited direct exposure, service software focus |
| Geopolitical Risk | Moderate, global presence including China and Europe | Moderate, mainly US operations but global tech market impact |
Unity Software faces significant market risk due to its high beta and operational challenges reflected in negative profitability and coverage ratios. ServiceTitan, while also unprofitable, maintains lower financial leverage and a safer Altman Z-score, reducing bankruptcy risk. Market volatility and operational inefficiencies are the most impactful concerns for both.
Which Stock to Choose?
Unity Software Inc. (U) has experienced a 17.1% revenue decline in 2024, with mostly unfavorable profitability and financial ratios, including a negative ROE of -20.81% and a very unfavorable overall rating (D+). Its debt level is moderate, and it shows a very unfavorable MOAT due to declining ROIC below WACC.
ServiceTitan, Inc. (TTAN) reported a 25.64% revenue growth in 2025 and a more favorable income statement with a 50% favorable ratio score. While profitability remains negative with a -16.44% ROE and an unfavorable MOAT, its debt levels are low and financial ratios are slightly better, alongside a very favorable rating (C-).
For investors focused on growth, ServiceTitan’s favorable income growth and improving ratios may appear more attractive, whereas risk-averse investors might view Unity’s higher current ratio and stable, albeit unfavorable, financial condition as a signal to wait. Both companies show value destruction in MOAT analysis, suggesting caution.
Disclaimer: Investment carries a risk of loss of initial capital. The past performance is not a reliable indicator of future results. Be sure to understand risks before making an investment decision.
Go Further
I encourage you to read the complete analyses of Unity Software Inc. and ServiceTitan, Inc. to enhance your investment decisions: