In today’s rapidly evolving technology landscape, Uber Technologies, Inc. and ServiceTitan, Inc. stand out as dynamic players in the software application sector. While Uber revolutionizes global mobility, delivery, and freight services, ServiceTitan focuses on optimizing field service management for residential and commercial infrastructure. Their shared commitment to innovation and software solutions makes this comparison essential. Join me as we explore which company offers the most compelling investment opportunity in 2026.
Table of contents
Companies Overview
I will begin the comparison between Uber Technologies, Inc. and ServiceTitan, Inc. by providing an overview of these two companies and their main differences.
Uber Overview
Uber Technologies, Inc. develops and operates proprietary technology applications across multiple continents, connecting consumers with independent providers for ride-sharing, delivery, and freight services. Its business spans three segments: Mobility, Delivery, and Freight, offering a broad range of transportation and logistics solutions. Founded in 2009 and headquartered in San Francisco, Uber is a leading player in the software application industry with a market cap of 176B USD.
ServiceTitan Overview
ServiceTitan, Inc. provides software solutions focused on field service activities related to the installation, maintenance, and servicing of infrastructure and systems in residential and commercial buildings. Founded in 2008 and based in Glendale, California, the company serves a specialized niche within the software application sector. ServiceTitan has a market cap of 8.5B USD and employs approximately 3,000 people.
Key similarities and differences
Both Uber and ServiceTitan operate in the technology sector within the software application industry, leveraging software platforms to serve their respective markets. However, Uber has a diversified business model targeting mobility, delivery, and freight logistics globally, while ServiceTitan concentrates on field service management for building infrastructure primarily in the US. The scale of Uber is significantly larger, with over 31,000 employees compared to ServiceTitan’s 3,000.
Income Statement Comparison
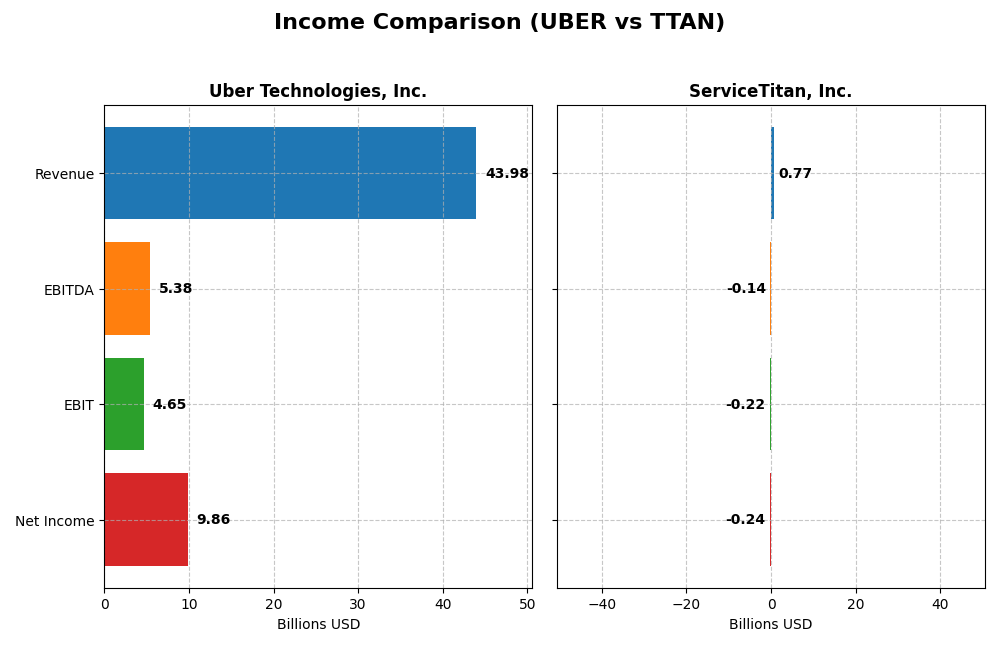
This table presents a side-by-side comparison of key income statement metrics for Uber Technologies, Inc. and ServiceTitan, Inc. based on their most recent fiscal year data.
| Metric | Uber Technologies, Inc. | ServiceTitan, Inc. |
|---|---|---|
| Market Cap | 176.3B | 8.5B |
| Revenue | 43.98B | 772M |
| EBITDA | 5.39B | -141M |
| EBIT | 4.65B | -221M |
| Net Income | 9.86B | -239M |
| EPS | 4.71 | -8.53 |
| Fiscal Year | 2024 | 2025 |
Income Statement Interpretations
Uber Technologies, Inc.
Uber demonstrated strong growth from 2020 to 2024, with revenue rising from 11.1B to 43.9B and net income turning positive to 9.86B in 2024 after several years of losses. Margins improved notably, with a gross margin of 39.4% and net margin reaching 22.41%. The latest fiscal year saw a 17.96% revenue increase and a sharp rise in net margin, signaling robust profitability gains.
ServiceTitan, Inc.
ServiceTitan’s revenue increased steadily from 468M in 2023 to 772M in 2025, reflecting a 65% growth over the period. However, the company remained unprofitable, with net losses widening to 359M in 2025 despite a favorable gross margin of 64.9%. Operating margins stayed negative, and EBIT declined by 26.7% in the most recent year, showing challenges in controlling operating expenses.
Which one has the stronger fundamentals?
Uber exhibits stronger fundamentals with consistent revenue growth, significant margin improvements, and a positive net income trajectory. In contrast, ServiceTitan, while growing revenue, continues to face substantial losses and negative EBIT margins. Uber’s favorable income statement metrics and profitability trends outweigh ServiceTitan’s mixed results, indicating more solid financial footing based on these income statements.
Financial Ratios Comparison
The following table presents a side-by-side comparison of key financial ratios for Uber Technologies, Inc. and ServiceTitan, Inc. based on the most recent fiscal year data available.
| Ratios | Uber Technologies, Inc. (2024) | ServiceTitan, Inc. (2025) |
|---|---|---|
| ROE | 45.7% | -16.4% |
| ROIC | 6.79% | -14.1% |
| P/E | 12.8 | -18.1 |
| P/B | 5.86 | 2.98 |
| Current Ratio | 1.07 | 3.74 |
| Quick Ratio | 1.07 | 3.74 |
| D/E (Debt-to-Equity) | 0.53 | 0.11 |
| Debt-to-Assets | 22.3% | 9.4% |
| Interest Coverage | 5.35 | -14.8 |
| Asset Turnover | 0.86 | 0.44 |
| Fixed Asset Turnover | 14.14 | 9.57 |
| Payout Ratio | 0 | 0 |
| Dividend Yield | 0 | 0 |
Interpretation of the Ratios
Uber Technologies, Inc.
Uber shows a balanced mix of strong and neutral ratios, with a notable 22.41% net margin and a high 45.72% return on equity indicating profitability strength. However, its price-to-book ratio at 5.86 is unfavorable, suggesting a relatively high market valuation compared to book value. Uber does not pay dividends, reflecting a reinvestment strategy likely focused on growth and operational expansion.
ServiceTitan, Inc.
ServiceTitan’s ratios lean toward unfavorable, with a negative net margin of -30.98% and negative returns on equity and invested capital, signaling operational challenges. Despite this, it benefits from a low debt-to-equity ratio and favorable weighted average cost of capital. The company also does not pay dividends, which aligns with a high-growth phase and focus on reinvestment for future development.
Which one has the best ratios?
Uber’s financial ratios are slightly more favorable overall, supported by strong profitability metrics and solid coverage ratios, despite some valuation concerns. ServiceTitan faces more significant profitability and efficiency challenges, reflected in its mostly unfavorable ratios and operational losses, which weigh on its financial standing relative to Uber.
Strategic Positioning
This section compares the strategic positioning of Uber Technologies, Inc. and ServiceTitan, Inc., focusing on market position, key segments, and exposure to technological disruption:
Uber Technologies, Inc.
- Leading global platform in ride-sharing, delivery, freight; faces intense competition.
- Operates three key segments: Mobility, Delivery, Freight driving revenue growth.
- Proprietary technology platform; exposure to evolving mobility and logistics tech.
ServiceTitan, Inc.
- Smaller market cap, focused on field service software with moderate competition.
- Generates revenue mainly from platform and subscription services in field service.
- Field service software reliant on technology but less exposed to broad mobility disruption.
Uber Technologies, Inc. vs ServiceTitan, Inc. Positioning
Uber’s diversified approach spans mobility, delivery, and freight, benefiting from multiple revenue streams but facing competitive pressures. ServiceTitan concentrates on field service software, offering focused solutions with potentially lower scale but less segment diversification.
Which has the best competitive advantage?
Both companies are currently shedding value relative to their cost of capital. Uber shows improving profitability trends, while ServiceTitan’s profitability is stable but less favorable, indicating Uber’s moat is slightly less unfavorable.
Stock Comparison
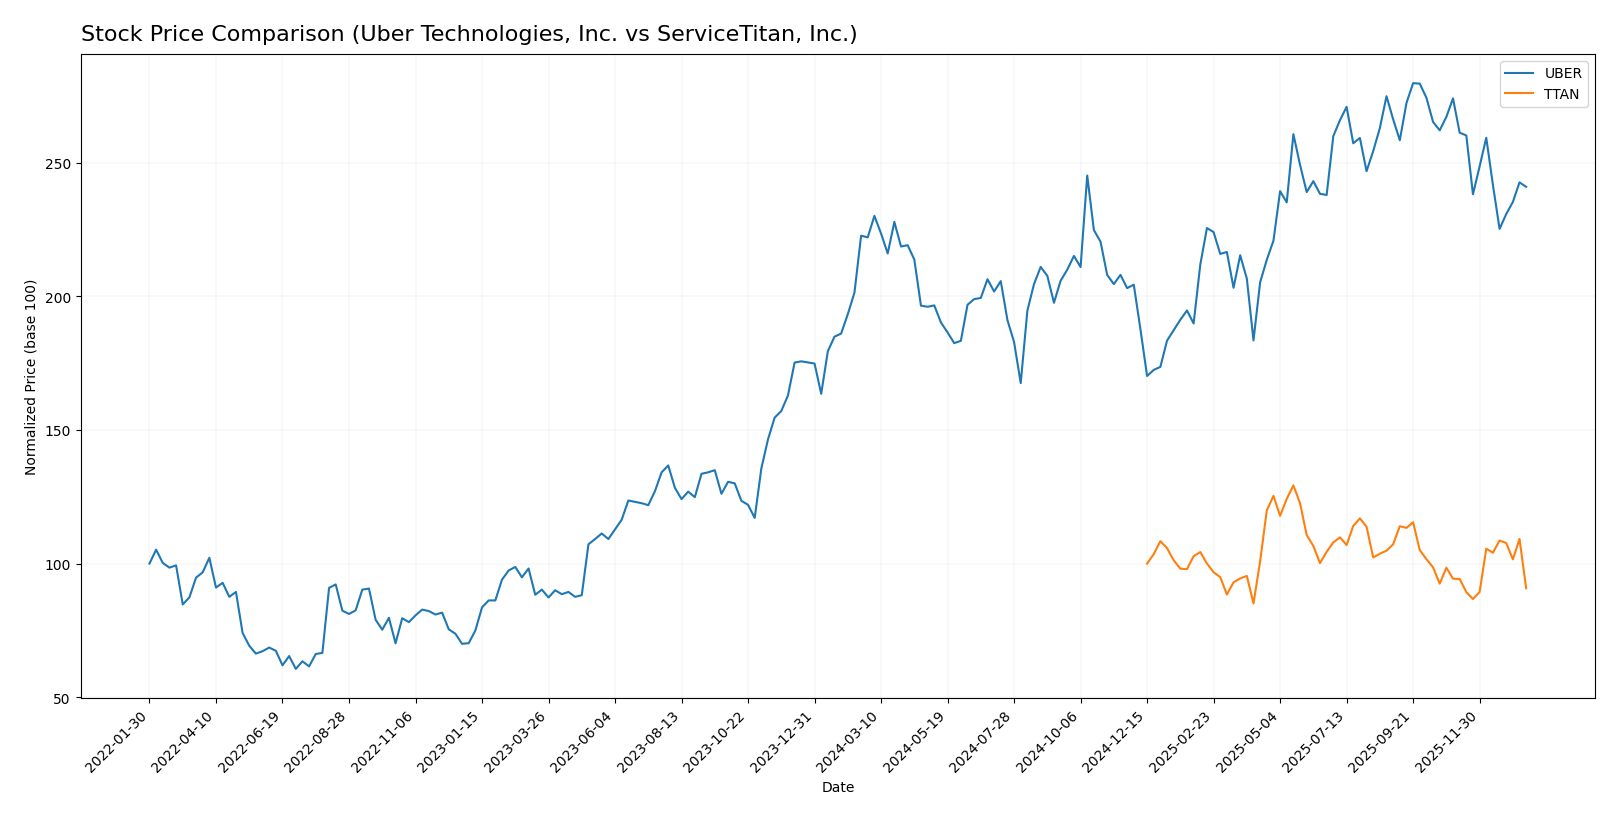
The stock price movements of Uber Technologies, Inc. and ServiceTitan, Inc. over the past 12 months reveal contrasting trends, with Uber exhibiting a bullish pattern despite recent deceleration, while ServiceTitan shows a sustained bearish trajectory accompanied by accelerating decline.
Trend Analysis
Uber Technologies, Inc. shows an 8.5% price increase over the past year, indicating a bullish trend with deceleration in momentum. The stock fluctuated between 58.99 and 98.51, with high volatility (std dev 10.29).
ServiceTitan, Inc. experienced a 9.22% decline over the same period, reflecting a bearish trend with accelerating downward movement. Price ranged from 85.07 to 129.26, and volatility remained high (std dev 9.86).
Comparing both, Uber has delivered the highest market performance over the last 12 months, outperforming ServiceTitan by a significant margin.
Target Prices
The current analyst consensus suggests moderate to strong upside potential for both Uber Technologies, Inc. and ServiceTitan, Inc.
| Company | Target High | Target Low | Consensus |
|---|---|---|---|
| Uber Technologies, Inc. | 140 | 73 | 111.26 |
| ServiceTitan, Inc. | 145 | 117 | 132.44 |
Analysts expect Uber’s price to rise from its current $84.85 to around $111 on average, indicating a positive outlook. ServiceTitan’s consensus target of $132.44 also suggests significant potential upside from its $90.78 trading price.
Analyst Opinions Comparison
This section compares analysts’ ratings and grades for Uber Technologies, Inc. and ServiceTitan, Inc.:
Rating Comparison
Uber Rating
- Rating: B, classified as Very Favorable by analysts.
- Discounted Cash Flow Score: 1, indicating a Very Unfavorable valuation outlook.
- ROE Score: 5, Very Favorable, showing strong profit generation efficiency.
- ROA Score: 5, Very Favorable, reflecting effective asset utilization.
- Debt To Equity Score: 2, Moderate risk level in financial leverage.
- Overall Score: 3, Moderate overall financial standing.
ServiceTitan Rating
- Rating: C-, classified as Very Favorable by analysts.
- Discounted Cash Flow Score: 1, also Very Unfavorable for valuation.
- ROE Score: 1, Very Unfavorable, indicating weak profit generation.
- ROA Score: 1, Very Unfavorable, showing poor asset utilization.
- Debt To Equity Score: 3, Moderate level of financial risk.
- Overall Score: 1, Very Unfavorable overall financial standing.
Which one is the best rated?
Based on the provided data, Uber holds a substantially stronger position with higher ROE and ROA scores, a better overall score, and a more favorable rating than ServiceTitan. ServiceTitan’s scores are mostly very unfavorable, except for a moderate debt-to-equity score.
Scores Comparison
Here is a comparison of the Altman Z-Score and Piotroski Score for Uber and ServiceTitan:
Uber Scores
- Altman Z-Score: 4.44, indicating a safe zone from bankruptcy risk.
- Piotroski Score: 6, reflecting average financial strength.
ServiceTitan Scores
- Altman Z-Score: 15.74, well within the safe zone, very low bankruptcy risk.
- Piotroski Score: 6, also reflecting average financial strength.
Which company has the best scores?
ServiceTitan has a significantly higher Altman Z-Score than Uber, indicating stronger financial stability. Both have equal Piotroski Scores, showing similar average financial strength based on the provided data.
Grades Comparison
Here is a comparison of the latest available grades for Uber Technologies, Inc. and ServiceTitan, Inc.:
Uber Technologies, Inc. Grades
The table below summarizes recent grades and actions from reputable grading firms for Uber Technologies, Inc.:
| Grading Company | Action | New Grade | Date |
|---|---|---|---|
| BTIG | Maintain | Buy | 2026-01-15 |
| Wells Fargo | Maintain | Overweight | 2026-01-08 |
| Cantor Fitzgerald | Maintain | Overweight | 2026-01-08 |
| Wolfe Research | Maintain | Outperform | 2026-01-06 |
| Wedbush | Maintain | Neutral | 2025-12-19 |
| Morgan Stanley | Maintain | Overweight | 2025-12-08 |
| Arete Research | Upgrade | Buy | 2025-12-03 |
| Wells Fargo | Maintain | Overweight | 2025-11-05 |
| Guggenheim | Maintain | Buy | 2025-11-05 |
| DA Davidson | Maintain | Buy | 2025-11-05 |
Uber’s grades predominantly indicate a positive outlook, with multiple buy and overweight ratings and a single neutral from Wedbush. The trend shows stable or improving sentiment.
ServiceTitan, Inc. Grades
The table below lists recent grades and actions from reputable grading firms for ServiceTitan, Inc.:
| Grading Company | Action | New Grade | Date |
|---|---|---|---|
| Piper Sandler | Maintain | Overweight | 2025-12-05 |
| BMO Capital | Maintain | Outperform | 2025-12-05 |
| TD Cowen | Maintain | Buy | 2025-12-05 |
| Morgan Stanley | Maintain | Equal Weight | 2025-12-05 |
| BMO Capital | Maintain | Outperform | 2025-11-20 |
| Wells Fargo | Maintain | Overweight | 2025-09-19 |
| Stifel | Maintain | Buy | 2025-09-19 |
| Piper Sandler | Maintain | Overweight | 2025-09-19 |
| Canaccord Genuity | Maintain | Buy | 2025-09-19 |
| Citigroup | Maintain | Neutral | 2025-09-09 |
ServiceTitan’s ratings also show a generally positive bias with multiple buy and outperform ratings, alongside a few neutral and equal weight assessments, indicating a cautiously optimistic view.
Which company has the best grades?
Both Uber Technologies and ServiceTitan have received predominantly favorable grades, with consensus ratings at “Buy” for each. Uber shows a slightly larger volume of buy and overweight grades from major firms, suggesting somewhat stronger market endorsement. Investors might interpret Uber’s wider positive consensus as a signal of broader analyst confidence, whereas ServiceTitan’s mix of outperform and equal weight ratings implies slightly more measured expectations.
Strengths and Weaknesses
Below is a comparative overview of key strengths and weaknesses for Uber Technologies, Inc. and ServiceTitan, Inc. based on their latest financial and operational data.
| Criterion | Uber Technologies, Inc. (UBER) | ServiceTitan, Inc. (TTAN) |
|---|---|---|
| Diversification | Highly diversified with Mobility ($25B), Delivery ($13.75B), Freight ($5.14B) revenue streams | Focused revenue model: Platform ($739M) and Subscription ($566M) only |
| Profitability | Favorable net margin (22.41%) and ROE (45.72%), neutral ROIC (6.79%) | Unfavorable net margin (-31%) and ROE (-16.4%), negative ROIC (-14.1%) |
| Innovation | Growing ROIC trend (+139%), strong asset turnover (14.14) indicating efficient asset use | Neutral ROIC trend (+1.7%), but struggles with interest coverage and asset turnover |
| Global presence | Strong global footprint supporting large-scale Mobility and Delivery services | Primarily US-focused SaaS platform for trades and home services |
| Market Share | Large market share in ride-hailing and delivery sectors | Emerging player in home services software with niche market share |
Key takeaways: Uber benefits from strong diversification, improving profitability, and global scale, despite slightly unfavorable value creation. ServiceTitan shows stable but unfavorable profitability and is more vulnerable due to limited diversification and market reach. Investors should weigh Uber’s growth potential against ServiceTitan’s current financial challenges.
Risk Analysis
Below is a comparative table outlining key risk factors for Uber Technologies, Inc. and ServiceTitan, Inc. based on the most recent data from 2025-2026.
| Metric | Uber Technologies, Inc. | ServiceTitan, Inc. |
|---|---|---|
| Market Risk | Beta 1.203, moderate volatility | Beta -0.85, inverse correlation, less market sensitivity |
| Debt level | Debt-to-Equity 0.53 (neutral), Debt-to-Assets 22.32% (favorable) | Debt-to-Equity 0.11 (favorable), Debt-to-Assets 9.35% (favorable) |
| Regulatory Risk | High in multiple jurisdictions (US, EU, Asia) | Moderate, primarily US-focused regulatory environment |
| Operational Risk | Complex global operations across mobility, delivery, freight | Focused on field service software, lower operational complexity |
| Environmental Risk | Moderate, increasing pressure on emissions and sustainability | Lower, less direct environmental impact |
| Geopolitical Risk | Exposure in multiple international markets | Limited primarily to US market |
The most likely and impactful risks for Uber are regulatory and geopolitical, given its broad international presence and scrutiny on gig economy practices. ServiceTitan faces significant financial risks, evidenced by its unfavorable net margins and weak profitability metrics despite low debt, indicating operational scaling challenges. Investors should weigh Uber’s diversified but complex risk profile against ServiceTitan’s financial instability and market position.
Which Stock to Choose?
Uber Technologies, Inc. has shown strong income growth with a 295% revenue increase from 2020 to 2024, and consistently favorable profitability ratios including a 22.41% net margin and 45.72% ROE in 2024. Its debt levels are moderate with a 0.53 debt-to-equity ratio, and its overall rating is very favorable (B).
ServiceTitan, Inc. displays positive revenue growth of 65% over 2023-2025 but struggles with profitability, posting a -30.98% net margin and negative returns on equity and invested capital. The company maintains low debt with a 0.11 debt-to-equity ratio, yet its financial ratios are slightly unfavorable, and it holds a very favorable rating (C-).
Investors with a growth-oriented profile might see Uber’s strong income evolution and slightly favorable financial ratios as attractive, while those who prioritize financial stability and lower leverage could find ServiceTitan’s conservative debt levels appealing despite its profitability challenges. The ratings and income evaluations suggest Uber appears stronger in profitability and value creation.
Disclaimer: Investment carries a risk of loss of initial capital. The past performance is not a reliable indicator of future results. Be sure to understand risks before making an investment decision.
Go Further
I encourage you to read the complete analyses of Uber Technologies, Inc. and ServiceTitan, Inc. to enhance your investment decisions: