In today’s dynamic technology sector, Tyler Technologies, Inc. (TYL) and ServiceTitan, Inc. (TTAN) stand out as prominent players in application software, each targeting distinct yet overlapping markets. Tyler focuses on integrated public sector solutions, while ServiceTitan innovates in field service management for residential and commercial infrastructure. This comparison explores their strategies and market positions to help you decide which company holds the most promise for your investment portfolio.
Table of contents
Companies Overview
I will begin the comparison between Tyler Technologies and ServiceTitan by providing an overview of these two companies and their main differences.
Tyler Technologies Overview
Tyler Technologies, Inc. provides integrated information management solutions and services tailored for the public sector. Its offerings span enterprise software, appraisal and tax systems, and judicial solutions, supporting government agencies in managing financials, municipal functions, public safety, and education. Founded in 1966 and headquartered in Plano, Texas, Tyler leverages cloud hosting collaborations and serves a broad public sector client base with over 7,400 employees.
ServiceTitan Overview
ServiceTitan, Inc. specializes in software that supports field service activities for the installation, maintenance, and servicing of residential and commercial building infrastructure. Founded in 2008 and based in Glendale, California, the company focuses on technology solutions that streamline operations for service providers. With about 3,000 employees, ServiceTitan operates primarily in the software application industry and has been publicly traded since late 2024.
Key similarities and differences
Both Tyler Technologies and ServiceTitan operate within the software application industry and serve business clients through technology solutions. Tyler’s focus is on the public sector with a broad portfolio covering government financial and operational systems, while ServiceTitan targets field service operations in residential and commercial sectors. Tyler is a more established company with a larger workforce and market cap, whereas ServiceTitan is a younger firm with a narrower service scope and smaller scale.
Income Statement Comparison
The following table compares the latest full fiscal year income statement metrics of Tyler Technologies, Inc. and ServiceTitan, Inc., providing a snapshot of their financial performance.
| Metric | Tyler Technologies, Inc. (TYL) | ServiceTitan, Inc. (TTAN) |
|---|---|---|
| Market Cap | 18.9B | 8.5B |
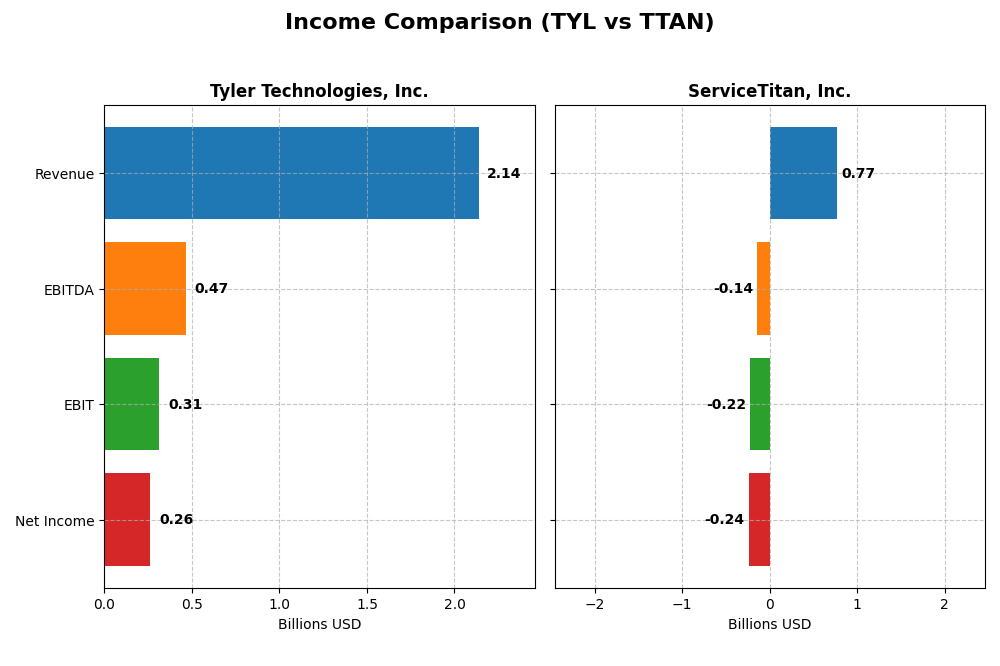
| Revenue | 2.14B | 771.9M |
| EBITDA | 466.5M | -141.0M |
| EBIT | 314.1M | -221.3M |
| Net Income | 263.0M | -239.1M |
| EPS | 6.17 | -8.53 |
| Fiscal Year | 2024 | 2025 |
Income Statement Interpretations
Tyler Technologies, Inc.
Tyler Technologies showed strong revenue growth from 2020 to 2024, nearly doubling from $1.12B to $2.14B, with net income increasing steadily to $263M in 2024. Margins largely remained stable, with a gross margin around 41% and a net margin of 12.3%. The latest year saw a favorable 9.5% revenue rise and a 44.7% net margin improvement, reflecting robust profitability expansion.
ServiceTitan, Inc.
ServiceTitan’s revenue grew rapidly from $468M in 2023 to $772M in 2025, a 65% increase over the period. However, the company remains unprofitable, with net losses widening to $239M in 2025 despite a favorable gross margin near 65%. The most recent year showed a 25.6% revenue increase but a deepening EBIT loss of 28.7%, indicating ongoing operational challenges.
Which one has the stronger fundamentals?
Tyler Technologies demonstrates stronger fundamentals, with consistent profitability, stable margins, and significant earnings growth, despite a slight net margin decline over the period. ServiceTitan’s impressive top-line growth contrasts with persistent operating losses and negative margins. Overall, Tyler’s financial metrics reflect more favorable income statement health and risk management.
Financial Ratios Comparison
The table below compares key financial ratios for Tyler Technologies, Inc. (TYL) and ServiceTitan, Inc. (TTAN) based on the most recent fiscal year data available.
| Ratios | Tyler Technologies, Inc. (TYL) 2024 | ServiceTitan, Inc. (TTAN) 2025 |
|---|---|---|
| ROE | 7.76% | -16.44% |
| ROIC | 6.20% | -14.11% |
| P/E | 93.42 | -18.12 |
| P/B | 7.25 | 2.98 |
| Current Ratio | 1.35 | 3.74 |
| Quick Ratio | 1.35 | 3.74 |
| D/E (Debt-to-Equity) | 0.19 | 0.11 |
| Debt-to-Assets | 12.32% | 9.35% |
| Interest Coverage | 50.50 | -14.82 |
| Asset Turnover | 0.41 | 0.44 |
| Fixed Asset Turnover | 10.95 | 9.57 |
| Payout Ratio | 0 | 0 |
| Dividend Yield | 0% | 0% |
Interpretation of the Ratios
Tyler Technologies, Inc.
Tyler Technologies shows a mix of strong and weak ratios. Its net margin is favorable at 12.3%, but return on equity (7.76%) and price multiples like PE (93.42) and PB (7.25) are unfavorable, suggesting valuation concerns. The company’s dividend yield is zero, consistent with its strategy not to pay dividends, likely to reinvest earnings for growth and maintain financial flexibility.
ServiceTitan, Inc.
ServiceTitan’s ratios reveal weaknesses, including a negative net margin (-30.98%) and poor returns on equity (-16.44%) and invested capital (-14.11%), reflecting operational challenges. Although it shows a favorable WACC (4.95%) and manageable debt ratios, the company does not pay dividends, which aligns with its high-growth phase and reinvestment focus, foregoing shareholder returns through dividends.
Which one has the best ratios?
Tyler Technologies presents a slightly favorable overall ratios profile with more favorable financial health indicators and profitability than ServiceTitan, which is slightly unfavorable due to significant losses and negative returns. The contrast in dividend policies reflects their different stages, with Tyler stable but ServiceTitan investing heavily in growth.
Strategic Positioning
This section compares the strategic positioning of Tyler Technologies, Inc. and ServiceTitan, Inc., including market position, key segments, and exposure to technological disruption:
Tyler Technologies, Inc.
- Established leader in public sector software, facing moderate competitive pressure.
- Diverse segments: enterprise software, appraisal, tax, SaaS, professional services, and transaction fees.
- Strategic AWS collaboration supports cloud hosting, mitigating technological disruption risks.
ServiceTitan, Inc.
- Emerging player in field service software, with competitive pressure from new entrants.
- Focused on platform and subscription revenues for residential and commercial field services.
- Limited explicit data on technology disruption exposure, focused on field services infrastructure.
Tyler Technologies, Inc. vs ServiceTitan, Inc. Positioning
Tyler shows a diversified approach across multiple public sector software segments, benefiting from AWS partnership but facing value decline. ServiceTitan concentrates on field services software with a narrower focus and stable but unfavorable profitability trends.
Which has the best competitive advantage?
Both companies are currently shedding value as ROIC is below WACC. Tyler’s diversified segments and AWS collaboration contrast with ServiceTitan’s focused model, but neither demonstrates a strong economic moat based on recent ROIC trends.
Stock Comparison
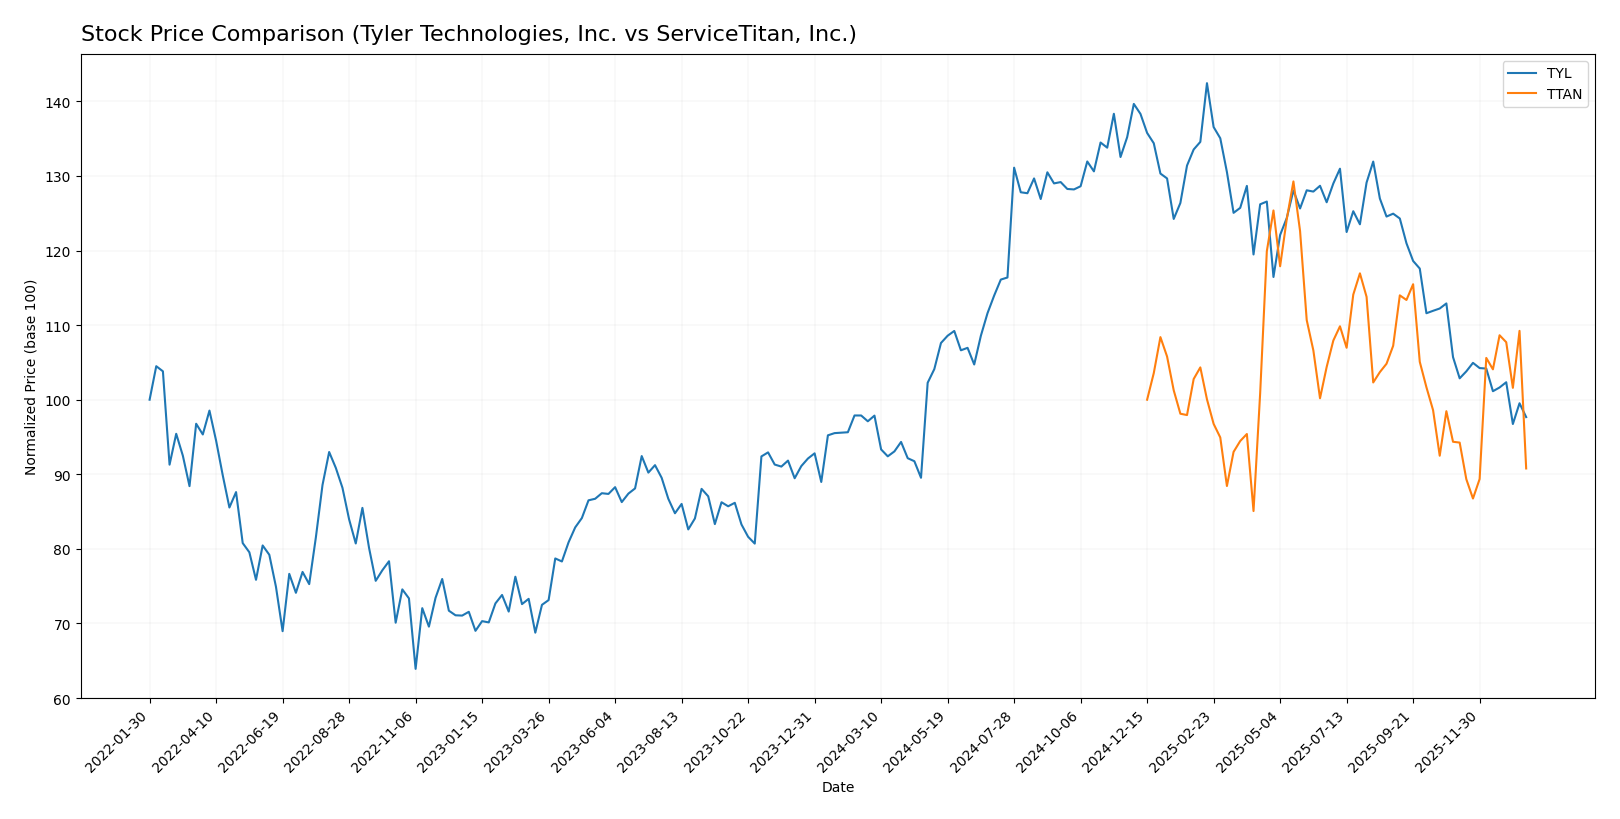
The stock price movements of Tyler Technologies, Inc. (TYL) and ServiceTitan, Inc. (TTAN) over the past 12 months reveal contrasting trends, with TYL showing marginal gains amid decelerating momentum and TTAN experiencing a sharper decline but accelerating losses.
Trend Analysis
Tyler Technologies, Inc. (TYL) recorded a 0.58% price increase over the past year, indicating a bullish trend with deceleration. The stock ranged between 403.35 and 641.7, displaying moderate volatility (std dev 61.82).
ServiceTitan, Inc. (TTAN) showed a -9.22% price change over the same period, reflecting a bearish trend with accelerating downward momentum. The price fluctuated from 85.07 to 129.26, with lower volatility (std dev 9.86).
Comparing both stocks, Tyler Technologies delivered the highest market performance with a slight positive return, unlike ServiceTitan’s significant decline over the past year.
Target Prices
Analysts present a positive target consensus for both Tyler Technologies, Inc. and ServiceTitan, Inc.
| Company | Target High | Target Low | Consensus |
|---|---|---|---|
| Tyler Technologies, Inc. | 675 | 470 | 584 |
| ServiceTitan, Inc. | 145 | 117 | 132.44 |
The consensus target prices for Tyler Technologies and ServiceTitan are significantly above their current stock prices of 440.01 and 90.78, respectively, indicating analysts expect notable upside potential.
Analyst Opinions Comparison
This section compares analysts’ ratings and grades for Tyler Technologies, Inc. and ServiceTitan, Inc.:
Rating Comparison
TYL Rating
- Rating: B, considered Very Favorable by analysts.
- Discounted Cash Flow Score: 4, indicating Favorable valuation based on cash flows.
- ROE Score: 3, a Moderate measure of equity profit efficiency.
- ROA Score: 4, Favorable asset utilization efficiency.
- Debt To Equity Score: 3, Moderate financial risk.
- Overall Score: 3, Moderate overall financial standing.
TTAN Rating
- Rating: C-, also marked Very Favorable overall.
- Discounted Cash Flow Score: 1, indicating Very Unfavorable valuation.
- ROE Score: 1, Very Unfavorable for equity profitability.
- ROA Score: 1, Very Unfavorable asset utilization.
- Debt To Equity Score: 3, Moderate financial risk.
- Overall Score: 1, Very Unfavorable overall standing.
Which one is the best rated?
Based strictly on the provided data, Tyler Technologies holds a higher rating (B vs. C-) and stronger scores in discounted cash flow, ROE, ROA, and overall financial health compared to ServiceTitan. Both share a moderate debt-to-equity score.
Scores Comparison
Here is a comparison of the Altman Z-Score and Piotroski Score for Tyler Technologies and ServiceTitan:
Tyler Technologies Scores
- Altman Z-Score: 7.42 indicating a safe financial zone
- Piotroski Score: 6, reflecting average financial strength
ServiceTitan Scores
- Altman Z-Score: 15.74 indicating a safe financial zone
- Piotroski Score: 6, reflecting average financial strength
Which company has the best scores?
Both Tyler Technologies and ServiceTitan are firmly in the Altman Z-Score safe zone, indicating low bankruptcy risk. Their Piotroski Scores are identical at 6, signaling average financial health for both companies.
Grades Comparison
Here is a comparison of the most recent grades assigned to Tyler Technologies, Inc. and ServiceTitan, Inc.:
Tyler Technologies, Inc. Grades
The table below shows recent grades from recognized financial institutions for Tyler Technologies, Inc.
| Grading Company | Action | New Grade | Date |
|---|---|---|---|
| Piper Sandler | Maintain | Overweight | 2026-01-13 |
| Wells Fargo | Maintain | Equal Weight | 2026-01-08 |
| DA Davidson | Maintain | Neutral | 2025-12-09 |
| Evercore ISI Group | Maintain | In Line | 2025-10-31 |
| DA Davidson | Maintain | Neutral | 2025-10-31 |
| DA Davidson | Maintain | Neutral | 2025-10-10 |
| DA Davidson | Maintain | Neutral | 2025-08-05 |
| Barclays | Maintain | Overweight | 2025-07-31 |
| Needham | Maintain | Buy | 2025-05-13 |
| Barclays | Maintain | Overweight | 2025-04-25 |
Tyler Technologies’ grades show a consistent pattern of “Overweight,” “Buy,” and “Neutral” ratings, indicating a generally positive but cautious outlook.
ServiceTitan, Inc. Grades
The table below shows recent grades from recognized financial institutions for ServiceTitan, Inc.
| Grading Company | Action | New Grade | Date |
|---|---|---|---|
| Piper Sandler | Maintain | Overweight | 2025-12-05 |
| BMO Capital | Maintain | Outperform | 2025-12-05 |
| TD Cowen | Maintain | Buy | 2025-12-05 |
| Morgan Stanley | Maintain | Equal Weight | 2025-12-05 |
| BMO Capital | Maintain | Outperform | 2025-11-20 |
| Wells Fargo | Maintain | Overweight | 2025-09-19 |
| Stifel | Maintain | Buy | 2025-09-19 |
| Piper Sandler | Maintain | Overweight | 2025-09-19 |
| Canaccord Genuity | Maintain | Buy | 2025-09-19 |
| Citigroup | Maintain | Neutral | 2025-09-09 |
ServiceTitan’s grades reflect a strong consensus of “Buy,” “Overweight,” and “Outperform” ratings, suggesting a generally bullish sentiment.
Which company has the best grades?
Both companies have a consensus “Buy” rating, but ServiceTitan exhibits a higher number of “Outperform” and “Buy” grades from multiple firms compared to Tyler Technologies’ mix of “Neutral” and “Overweight” ratings. This may indicate stronger analyst confidence in ServiceTitan’s near-term prospects, which investors might consider when assessing potential portfolio impacts.
Strengths and Weaknesses
The table below compares the key strengths and weaknesses of Tyler Technologies, Inc. (TYL) and ServiceTitan, Inc. (TTAN) based on the most recent financial and operational data.
| Criterion | Tyler Technologies, Inc. (TYL) | ServiceTitan, Inc. (TTAN) |
|---|---|---|
| Diversification | High diversification with multiple revenue streams: SaaS, Transaction Fees, Professional Services, Maintenance, and Hardware | Moderate diversification with Platform and Subscription Revenues only |
| Profitability | Positive net margin at 12.3%, but ROIC below WACC, indicating value destruction | Negative net margin (-31%) and ROIC (-14.1%), signaling significant losses |
| Innovation | Steady investment in software and platform technologies; favorable fixed asset turnover (10.95) | Moderate innovation with solid fixed asset turnover (9.57), but overall financial strain limits R&D capacity |
| Global presence | Established presence primarily in the U.S. government and enterprise software markets | Primarily focused on North American market with growth potential |
| Market Share | Strong position in public sector software with recurring revenue streams | Growing market share in trades management software but currently losing value |
In summary, Tyler Technologies offers a diversified revenue base and stable profitability but struggles with declining capital efficiency. ServiceTitan is still expanding but faces significant profitability challenges and value destruction, requiring cautious consideration for investment.
Risk Analysis
Below is a comparative table highlighting key risk metrics for Tyler Technologies, Inc. (TYL) and ServiceTitan, Inc. (TTAN) for the most recent fiscal years:
| Metric | Tyler Technologies, Inc. (TYL) | ServiceTitan, Inc. (TTAN) |
|---|---|---|
| Market Risk | Beta 0.92 (moderate volatility) | Beta -0.85 (inverse correlation, unusual) |
| Debt level | Debt-to-Equity 0.19 (low, favorable) | Debt-to-Equity 0.11 (low, favorable) |
| Regulatory Risk | Moderate (public sector focus) | Moderate (service industry regulations) |
| Operational Risk | Moderate (integrated software solutions complexity) | Moderate (field service operations dependency) |
| Environmental Risk | Low (software industry, minimal direct impact) | Low (software industry, minimal direct impact) |
| Geopolitical Risk | Moderate (US-based, public sector contracts) | Moderate (US-based, commercial building services) |
Synthesis: Both companies exhibit low financial leverage and strong balance sheet health, reducing debt-related risks. Tyler’s slightly higher market volatility and public sector exposure could impact stability, while ServiceTitan’s negative beta suggests unusual market sensitivity. Operational and regulatory risks are moderate for both, with no significant environmental concerns. Investors should monitor market and operational factors closely for impact.
Which Stock to Choose?
Tyler Technologies, Inc. (TYL) shows a favorable income evolution with 9.53% revenue growth in 2024 and strong profitability metrics, though with a slightly declining ROIC and a very unfavorable moat rating. Its financial ratios are slightly favorable overall, supported by low debt and high interest coverage.
ServiceTitan, Inc. (TTAN) exhibits robust revenue growth of 25.64% in 2025 but suffers from negative profitability and unfavorable financial ratios overall. Despite low debt levels and strong current liquidity, it has an unfavorable moat status reflecting ongoing value destruction and negative returns on capital.
For risk-averse investors prioritizing financial stability and consistent income generation, Tyler Technologies might appear more favorable given its positive income statement and stronger financial ratios. Conversely, growth-oriented investors who accept higher risk could interpret ServiceTitan’s rapid revenue expansion as a potential opportunity despite its current profitability challenges.
Disclaimer: Investment carries a risk of loss of initial capital. The past performance is not a reliable indicator of future results. Be sure to understand risks before making an investment decision.
Go Further
I encourage you to read the complete analyses of Tyler Technologies, Inc. and ServiceTitan, Inc. to enhance your investment decisions: