In today’s dynamic tech landscape, Strategy Inc and ServiceTitan, Inc. stand out as innovative leaders in the software application industry. Strategy Inc focuses on Bitcoin treasury management and AI-driven analytics, while ServiceTitan streamlines field service operations for residential and commercial infrastructure. Their distinct yet overlapping market approaches make this comparison compelling. Join me as we analyze which company offers the most attractive investment opportunity for your portfolio.
Table of contents
Companies Overview
I will begin the comparison between Strategy Inc and ServiceTitan, Inc. by providing an overview of these two companies and their main differences.
Strategy Inc Overview
Strategy Inc operates as a bitcoin treasury company and provides AI-powered enterprise analytics software. It offers investors exposure to Bitcoin through various securities and delivers tools like Strategy One and Strategy Mosaic for data insights and governance. Incorporated in 1989 and headquartered in Tysons Corner, VA, it is positioned in the technology sector with a market cap of approximately 50B USD.
ServiceTitan, Inc. Overview
ServiceTitan, Inc. focuses on software solutions for managing field service activities related to residential and commercial infrastructure. Founded in 2008 and based in Glendale, CA, it serves the technology sector with a market cap around 8.5B USD. The company supports service installation, maintenance, and management, aiming to streamline operations for service providers.
Key similarities and differences
Both companies operate in the technology sector and provide application software solutions. Strategy Inc emphasizes cryptocurrency exposure and AI analytics for enterprises, while ServiceTitan targets field service management for infrastructure systems. Strategy Inc has a significantly larger market cap and focuses on data intelligence, contrasting with ServiceTitan’s operational service software niche.
Income Statement Comparison
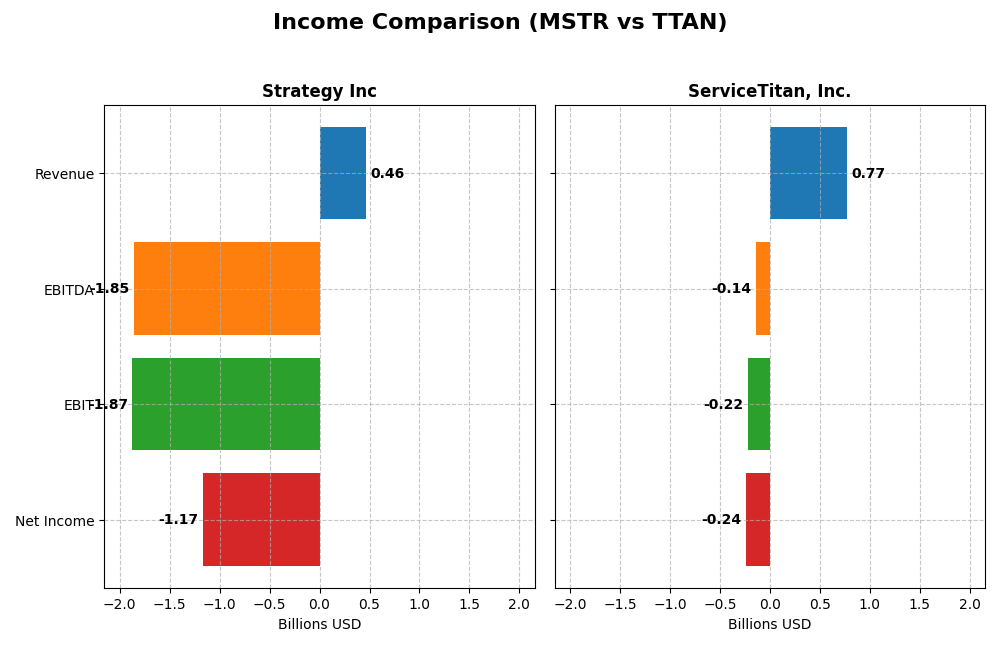
Below is the income statement comparison for the most recent fiscal year available for Strategy Inc and ServiceTitan, Inc.
| Metric | Strategy Inc (MSTR) | ServiceTitan, Inc. (TTAN) |
|---|---|---|
| Market Cap | 50B | 8.5B |
| Revenue | 463M | 771.9M |
| EBITDA | -1.85B | -141M |
| EBIT | -1.87B | -221.3M |
| Net Income | -1.17B | -239.1M |
| EPS | -6.06 | -8.53 |
| Fiscal Year | 2024 | 2025 |
Income Statement Interpretations
Strategy Inc
Strategy Inc’s revenue declined modestly by 3.6% overall and 6.6% in the last year, with net income showing a dramatic deterioration, falling over 15,400% across the period. Gross margins remained strong at 72.1%, but EBIT and net margins were deeply negative. The latest year saw negative growth in revenue, gross profit, and margins, indicating worsening profitability.
ServiceTitan, Inc.
ServiceTitan reported solid revenue growth of 65% over three years and 25.6% in the last year, with net income growing 11.3% overall. Gross margin was a healthy 64.9%, though EBIT and net margins stayed negative at around -29% and -31%. Despite increasing operating expenses, revenue expansion drove positive margin improvements, signaling operational scaling challenges.
Which one has the stronger fundamentals?
ServiceTitan exhibits stronger fundamentals with favorable revenue and net income growth and a healthy gross margin, despite ongoing losses. Strategy Inc struggles with declining revenue and sharply worsening profitability, reflected in unfavorable EBIT and net margins. ServiceTitan’s more balanced margin profile and growth metrics suggest comparatively better income statement health.
Financial Ratios Comparison
The table below presents a comparison of key financial ratios for Strategy Inc (MSTR) and ServiceTitan, Inc. (TTAN) based on their most recent fiscal year data.
| Ratios | Strategy Inc (MSTR) 2024 | ServiceTitan, Inc. (TTAN) 2025 |
|---|---|---|
| ROE | -6.40% | -16.44% |
| ROIC | -4.38% | -14.11% |
| P/E | -47.80 | -18.12 |
| P/B | 3.06 | 2.98 |
| Current Ratio | 0.71 | 3.74 |
| Quick Ratio | 0.71 | 3.74 |
| D/E | 0.40 | 0.11 |
| Debt-to-Assets | 28.09% | 9.35% |
| Interest Coverage | -29.92 | -14.82 |
| Asset Turnover | 0.02 | 0.44 |
| Fixed Asset Turnover | 5.73 | 9.57 |
| Payout Ratio | 0 | 0 |
| Dividend Yield | 0 | 0 |
Interpretation of the Ratios
Strategy Inc
Strategy Inc shows mostly weak financial ratios, including negative net margin (-251.73%) and return on equity (-6.4%), signaling operational and profitability challenges. The company’s current and quick ratios are low at 0.71, indicating liquidity concerns. It does not pay dividends, suggesting a possible focus on reinvestment or dealing with financial stress rather than shareholder payouts.
ServiceTitan, Inc.
ServiceTitan’s ratios are mixed, with a net margin of -30.98% and negative return on equity (-16.44%), reflecting profitability struggles. However, it has a strong quick ratio of 3.74 and low debt-to-assets ratio (9.35%), indicating better liquidity and conservative leverage. The company also does not pay dividends, likely prioritizing growth or reinvestment over distributions.
Which one has the best ratios?
While both companies face profitability issues, ServiceTitan exhibits a slightly more favorable liquidity position and lower leverage than Strategy Inc. However, Strategy Inc benefits from a stronger debt-to-equity ratio and fixed asset turnover. Overall, ServiceTitan’s ratios are slightly less unfavorable, reflecting a marginally stronger financial position.
Strategic Positioning
This section compares the strategic positioning of Strategy Inc and ServiceTitan, Inc., focusing on Market position, Key segments, and Exposure to technological disruption:
Strategy Inc
- Operates globally with bitcoin treasury and software; faces high beta volatility and strong competition.
- Key segments include bitcoin exposure and AI analytics software with multiple revenue streams.
- Exposure to technological disruption from cryptocurrency markets and AI-driven analytics.
ServiceTitan, Inc.
- US-based software for field service in infrastructure; lower beta suggests less market volatility.
- Focused on platform and subscription revenues for field service management.
- Exposure primarily in software innovation for field service operations.
Strategy Inc vs ServiceTitan, Inc. Positioning
Strategy Inc pursues a diversified approach with bitcoin treasury and AI software, offering multiple revenue sources but higher market risk. ServiceTitan concentrates on field service software, with stable but narrower revenue streams and less volatility.
Which has the best competitive advantage?
Both companies are currently shedding value with ROIC below WACC; however, ServiceTitan shows stable profitability trends, whereas Strategy Inc experiences declining returns, indicating a slightly stronger competitive advantage for ServiceTitan based on MOAT evaluation.
Stock Comparison
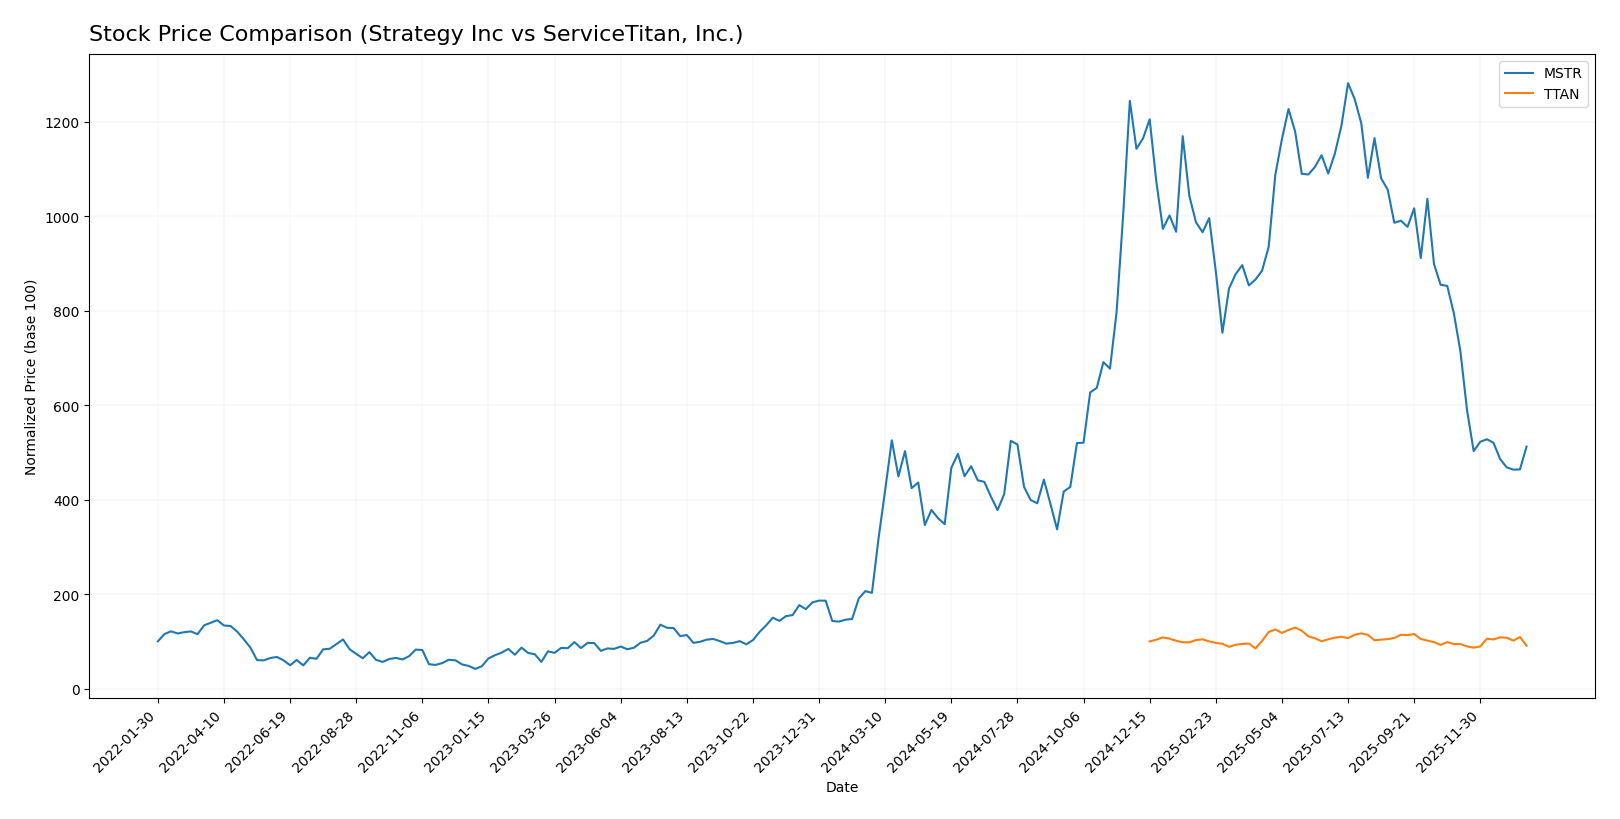
The stock price dynamics over the past 12 months reveal significant divergence, with Strategy Inc (MSTR) showing strong gains despite recent pullbacks, while ServiceTitan, Inc. (TTAN) experienced a moderate decline with some deceleration in bearish momentum.
Trend Analysis
Strategy Inc (MSTR) exhibited a bullish trend over the past year with a 152.71% price increase, though recent months show a deceleration phase and a 35.55% pullback, reflecting heightened volatility with a standard deviation of 103.09.
ServiceTitan, Inc. (TTAN) followed a bearish trend with a 9.22% price decrease over the year, but recent data indicate an acceleration in the downtrend, offset slightly by a mild positive slope recently and lower volatility at 9.86 standard deviation.
Comparing the two, Strategy Inc (MSTR) delivered the highest market performance by a wide margin, despite recent volatility, while ServiceTitan, Inc. (TTAN) lagged with a consistent downward trajectory.
Target Prices
The current analyst consensus on target prices for Strategy Inc and ServiceTitan, Inc. reflects a broad range of expectations with notable upside potential.
| Company | Target High | Target Low | Consensus |
|---|---|---|---|
| Strategy Inc | 705 | 175 | 433.57 |
| ServiceTitan, Inc. | 145 | 117 | 132.44 |
Analysts expect Strategy Inc’s stock to rise significantly from its current price of 173.71 USD, with a consensus target more than double. ServiceTitan’s consensus target of 132.44 USD also suggests a strong upside from the current 90.78 USD price level.
Analyst Opinions Comparison
This section compares analysts’ ratings and grades for Strategy Inc and ServiceTitan, Inc.:
Rating Comparison
Strategy Inc Rating
- Rating: A-, considered very favorable by analysts.
- Discounted Cash Flow Score: 1, indicating a very unfavorable valuation outlook.
- ROE Score: 4, reflecting favorable profitability from shareholders’ equity.
- ROA Score: 5, rated very favorable for effective asset utilization.
- Debt To Equity Score: 3, a moderate indication of financial leverage and risk.
- Overall Score: 4, a favorable overall financial standing.
ServiceTitan, Inc. Rating
- Rating: C-, despite the low grade, is marked as very favorable in status.
- Discounted Cash Flow Score: 1, also very unfavorable for valuation.
- ROE Score: 1, showing very unfavorable efficiency in generating profit from equity.
- ROA Score: 1, very unfavorable in asset utilization efficiency.
- Debt To Equity Score: 3, also moderate, suggesting similar leverage risk.
- Overall Score: 1, indicating a very unfavorable overall financial position.
Which one is the best rated?
Strategy Inc is clearly better rated, with a higher overall score of 4 versus 1 for ServiceTitan, Inc. It also outperforms in ROE and ROA, while both have equal and moderate debt-to-equity scores.
Scores Comparison
Here is a comparison of the financial scores for Strategy Inc and ServiceTitan, Inc.:
Strategy Inc Scores
- Altman Z-Score: 2.78, indicating a grey zone risk level for bankruptcy.
- Piotroski Score: 4, reflecting an average financial strength status.
ServiceTitan, Inc. Scores
- Altman Z-Score: 15.74, well within the safe zone for bankruptcy risk.
- Piotroski Score: 6, also indicating average financial health.
Which company has the best scores?
Based on the provided data, ServiceTitan, Inc. shows a significantly stronger Altman Z-Score in the safe zone compared to Strategy Inc’s grey zone score. Both companies have average Piotroski Scores, with ServiceTitan slightly higher.
Grades Comparison
The following is a comparison of recent grades and ratings from recognized financial analysts for Strategy Inc and ServiceTitan, Inc.:
Strategy Inc Grades
This table summarizes the latest analyst grades and actions for Strategy Inc:
| Grading Company | Action | New Grade | Date |
|---|---|---|---|
| Mizuho | Maintain | Outperform | 2026-01-16 |
| TD Cowen | Maintain | Buy | 2026-01-15 |
| Citigroup | Maintain | Buy | 2025-12-22 |
| Bernstein | Maintain | Outperform | 2025-12-08 |
| Monness, Crespi, Hardt | Upgrade | Neutral | 2025-11-10 |
| HC Wainwright & Co. | Maintain | Buy | 2025-11-03 |
| Canaccord Genuity | Maintain | Buy | 2025-11-03 |
| BTIG | Maintain | Buy | 2025-10-31 |
| Cantor Fitzgerald | Maintain | Overweight | 2025-10-31 |
| TD Cowen | Maintain | Buy | 2025-10-31 |
Overall, Strategy Inc’s grades predominantly indicate a positive outlook, with multiple “Buy” and “Outperform” ratings, showing stability and some recent upgrades.
ServiceTitan, Inc. Grades
This table presents recent analyst grades and actions for ServiceTitan, Inc.:
| Grading Company | Action | New Grade | Date |
|---|---|---|---|
| Piper Sandler | Maintain | Overweight | 2025-12-05 |
| BMO Capital | Maintain | Outperform | 2025-12-05 |
| TD Cowen | Maintain | Buy | 2025-12-05 |
| Morgan Stanley | Maintain | Equal Weight | 2025-12-05 |
| BMO Capital | Maintain | Outperform | 2025-11-20 |
| Wells Fargo | Maintain | Overweight | 2025-09-19 |
| Stifel | Maintain | Buy | 2025-09-19 |
| Piper Sandler | Maintain | Overweight | 2025-09-19 |
| Canaccord Genuity | Maintain | Buy | 2025-09-19 |
| Citigroup | Maintain | Neutral | 2025-09-09 |
ServiceTitan, Inc. shows a consistent pattern of “Buy,” “Outperform,” and “Overweight” ratings, with no downgrades, indicating a stable and favorable analyst consensus.
Which company has the best grades?
Both companies have a “Buy” consensus from analysts, but Strategy Inc has a larger number of “Buy” ratings (17) compared to ServiceTitan’s 12, while ServiceTitan shows more “Outperform” and “Overweight” grades. This balance suggests both have strong support, with Strategy Inc favored for broader buy interest and ServiceTitan for slightly more bullish ratings, potentially affecting investor perception of growth and risk differently.
Strengths and Weaknesses
Here is a comparative overview of the key strengths and weaknesses of Strategy Inc (MSTR) and ServiceTitan, Inc. (TTAN) based on the most recent financial and operational data:
| Criterion | Strategy Inc (MSTR) | ServiceTitan, Inc. (TTAN) |
|---|---|---|
| Diversification | Moderate: Revenue from licenses, maintenance, subscriptions, and technology services; some reliance on maintenance (243.8M in 2024) | Moderate: Primarily platform and subscription revenues, with platform revenue at 739.5M in 2025 |
| Profitability | Weak: Negative net margin (-251.7%), negative ROIC (-4.38%), and declining profitability | Weak: Negative net margin (-31.0%), negative ROIC (-14.11%), stable but unfavorable profitability |
| Innovation | Moderate: Technology services contribute 64.3M, but declining ROIC suggests challenges in innovation payoff | Moderate to strong: Higher fixed asset turnover (9.57) signals efficient asset use, innovation potential |
| Global presence | Limited data; mostly US-based with moderate global footprint implied | Likely US-focused; no clear global expansion data available |
| Market Share | Niche software provider with declining returns, losing value | Growing platform provider with stable ROIC but value destruction persists |
Key takeaways: Both companies face profitability challenges with negative returns on invested capital, signaling value destruction. Strategy Inc shows a more diversified revenue base but suffers from worsening profitability. ServiceTitan has a strong asset turnover and slightly better ratio distribution but still struggles with negative margins. Caution is advised when considering investments in either company.
Risk Analysis
Below is a comparative table of key risks for Strategy Inc (MSTR) and ServiceTitan, Inc. (TTAN) based on the most recent data available in 2026:
| Metric | Strategy Inc (MSTR) | ServiceTitan, Inc. (TTAN) |
|---|---|---|
| Market Risk | High beta (3.43) indicating high volatility and sensitivity to market swings | Negative beta (-0.85) suggesting counter-cyclical performance, moderate market risk |
| Debt level | Moderate debt-to-assets 28.1%, manageable leverage | Low debt-to-assets 9.35%, conservative leverage position |
| Regulatory Risk | Elevated due to bitcoin treasury activities and global operations | Moderate, mainly compliance with US service industry regulations |
| Operational Risk | Exposure to technology platform reliability and AI software integration | Exposure to field service software implementations and customer retention |
| Environmental Risk | Low direct exposure, primarily software business | Low, with limited physical operations |
| Geopolitical Risk | Significant due to international bitcoin operations and crypto regulation volatility | Low to moderate, primarily US-focused operations |
Synthesis: Strategy Inc faces the most impactful risks from high market volatility and regulatory uncertainty around cryptocurrency activities, amplified by unfavorable profitability and liquidity ratios. ServiceTitan has lower leverage and market risk but struggles with operational efficiency and profitability, posing moderate financial risks. Investors should weigh Strategy Inc’s high beta and crypto exposure against ServiceTitan’s operational challenges.
Which Stock to Choose?
Strategy Inc (MSTR) shows a declining income trend with a 6.61% revenue drop in 2024 and mostly unfavorable financial ratios, including negative profitability and weak liquidity. Despite a strong overall rating of A-, it is shedding value with a very unfavorable MOAT status.
ServiceTitan, Inc. (TTAN) exhibits favorable income growth, with 25.64% revenue increase in 2025 and half of income metrics positive. Its financial ratios are slightly unfavorable but show better debt management and liquidity. The company has an overall C- rating and an unfavorable MOAT with stable profitability.
Investors seeking growth might find TTAN’s positive income trajectory and improving profitability more appealing, while those prioritizing financial ratings might view MSTR’s stronger rating as noteworthy despite its deteriorating value creation. Profiles sensitive to value destruction may see caution signals in both.
Disclaimer: Investment carries a risk of loss of initial capital. The past performance is not a reliable indicator of future results. Be sure to understand risks before making an investment decision.
Go Further
I encourage you to read the complete analyses of Strategy Inc and ServiceTitan, Inc. to enhance your investment decisions: