In today’s dynamic tech landscape, Snowflake Inc. and ServiceTitan, Inc. stand out as innovative leaders in the software application industry. Both companies leverage cloud technology to transform how businesses operate—Snowflake by revolutionizing data management and ServiceTitan by streamlining field service operations. Given their market overlap and growth potential, this comparison will help you decide which stock deserves a place in your investment portfolio. Let’s uncover which company holds the most promise for your wallet.
Table of contents
Companies Overview
I will begin the comparison between Snowflake Inc. and ServiceTitan, Inc. by providing an overview of these two companies and their main differences.
Snowflake Inc. Overview
Snowflake Inc. provides a cloud-based data platform that helps customers consolidate data into a single source of truth. Its Data Cloud platform enables businesses to derive meaningful insights, build data-driven applications, and share data across various industries. Founded in 2012 and headquartered in Bozeman, MT, Snowflake operates internationally and is positioned as a leader in software applications with a market cap of $70.4B.
ServiceTitan, Inc. Overview
ServiceTitan, Inc. focuses on software solutions for field service management, supporting activities to install, maintain, and service infrastructure in residential and commercial buildings. Founded in 2008 and based in Glendale, CA, the company serves the technology sector with a market cap of $8.5B. Its software targets the operational needs of service providers in the building and infrastructure industry.
Key similarities and differences
Both Snowflake and ServiceTitan operate in the technology sector within the software application industry, providing specialized platforms to improve operational efficiency. While Snowflake emphasizes cloud data management and analytics across multiple industries, ServiceTitan concentrates on field service management for infrastructure maintenance. Their market caps and employee counts differ significantly, reflecting distinct market focuses and scales of operation.
Income Statement Comparison
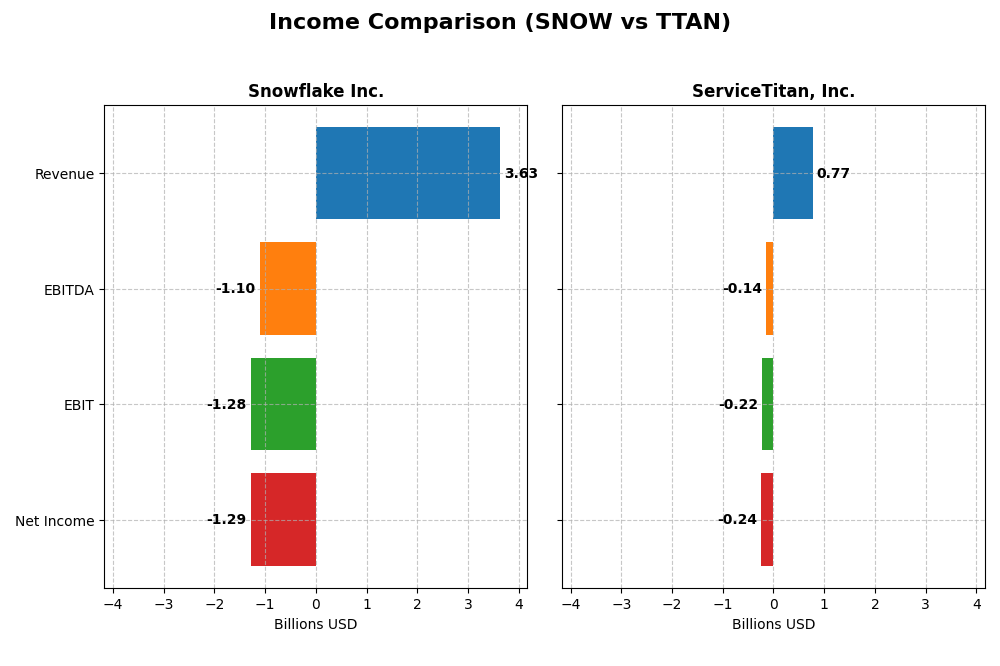
Below is a comparison of key income statement metrics for Snowflake Inc. and ServiceTitan, Inc. for the most recent fiscal year available.
| Metric | Snowflake Inc. (SNOW) | ServiceTitan, Inc. (TTAN) |
|---|---|---|
| Market Cap | 70.4B | 8.5B |
| Revenue | 3.63B | 772M |
| EBITDA | -1.10B | -141M |
| EBIT | -1.28B | -221M |
| Net Income | -1.29B | -239M |
| EPS | -3.86 | -8.53 |
| Fiscal Year | 2025 | 2025 |
Income Statement Interpretations
Snowflake Inc.
Snowflake Inc. experienced robust revenue growth, increasing from $592M in 2021 to $3.63B in 2025, while net income remained negative and deteriorated to -$1.29B in 2025. Gross margins stayed strong at 66.5%, but EBIT and net margins remained unfavorable, reflecting ongoing operating losses. The latest year showed revenue growth slowing to 29.2%, with worsening EBIT and net margin performance.
ServiceTitan, Inc.
ServiceTitan’s revenue rose steadily from $468M in 2023 to $772M in 2025, with net income losses narrowing overall to -$239M in 2025. The company maintained a favorable gross margin near 64.9%, though EBIT and net margins stayed negative. The most recent year saw a 25.6% revenue increase, a decline in EBIT, but a slight improvement in net margin growth, indicating mixed operational results.
Which one has the stronger fundamentals?
Both companies demonstrate strong revenue growth and solid gross margins. Snowflake’s larger scale and higher revenue growth contrast with deeper net losses and deteriorating EBIT margins. ServiceTitan shows more modest revenue growth but better net income improvement and a favorable overall income statement evaluation. Fundamentally, ServiceTitan’s income statement trends appear more balanced, while Snowflake’s remain challenged by significant operating losses.
Financial Ratios Comparison
Below is a comparison of key financial ratios for Snowflake Inc. and ServiceTitan, Inc. for the fiscal year 2025.
| Ratios | Snowflake Inc. (SNOW) | ServiceTitan, Inc. (TTAN) |
|---|---|---|
| ROE | -42.9% | -16.4% |
| ROIC | -25.2% | -14.1% |
| P/E | -47.0 | -18.1 |
| P/B | 20.1 | 3.0 |
| Current Ratio | 1.75 | 3.74 |
| Quick Ratio | 1.75 | 3.74 |
| D/E (Debt-to-Equity) | 0.90 | 0.11 |
| Debt-to-Assets | 29.7% | 9.4% |
| Interest Coverage | -528 | -14.8 |
| Asset Turnover | 0.40 | 0.44 |
| Fixed Asset Turnover | 5.53 | 9.57 |
| Payout ratio | 0 | 0 |
| Dividend yield | 0 | 0 |
Interpretation of the Ratios
Snowflake Inc.
Snowflake’s ratios reveal a mixed financial health profile. While liquidity ratios such as current and quick ratios are favorable at 1.75, key profitability metrics like net margin (-35.45%), ROE (-42.86%), and ROIC (-25.24%) are unfavorable, indicating operational challenges. The company does not pay dividends, consistent with its high investment in R&D and growth focus, foregoing distributions to reinvest capital.
ServiceTitan, Inc.
ServiceTitan presents a similar picture with notable weaknesses in profitability, as net margin (-30.98%), ROE (-16.44%), and ROIC (-14.11%) remain negative. Liquidity is strong with a current ratio of 3.74, yet some ratios like interest coverage are unfavorable. Like Snowflake, ServiceTitan does not pay dividends, reflecting its reinvestment strategy and growth phase priorities without shareholder payouts.
Which one has the best ratios?
Both companies show slightly unfavorable overall ratio evaluations due to negative profitability and coverage metrics. ServiceTitan scores marginally better in favorability percentages (42.86% vs. 35.71%) and has a lower debt level. However, both firms face similar risks from unprofitable operations and no dividend returns, suggesting cautious interpretation of their financial health.
Strategic Positioning
This section compares the strategic positioning of Snowflake Inc. and ServiceTitan, Inc. in terms of market position, key segments, and exposure to technological disruption:
Snowflake Inc.
- Leading cloud-based data platform with strong competitive pressure in software applications.
- Key segments include cloud data platform products and professional services driving growth.
- Exposure to technological disruption through continuous innovation in cloud data solutions.
ServiceTitan, Inc.
- Focused on field service software with less competitive pressure in niche market.
- Platform and subscription revenues mainly from field service management software.
- Limited exposure with focus on infrastructure and systems servicing software.
Snowflake Inc. vs ServiceTitan, Inc. Positioning
Snowflake operates a diversified cloud data platform targeting multiple industries, while ServiceTitan concentrates on field service software. Snowflake’s broader product base supports wider market reach; ServiceTitan’s specialization offers targeted industry focus but narrower scope.
Which has the best competitive advantage?
Both companies are currently shedding value with ROIC below WACC. Snowflake shows a declining ROIC trend, while ServiceTitan maintains neutral ROIC trend but still unfavorable overall, indicating no clear moat advantage for either.
Stock Comparison
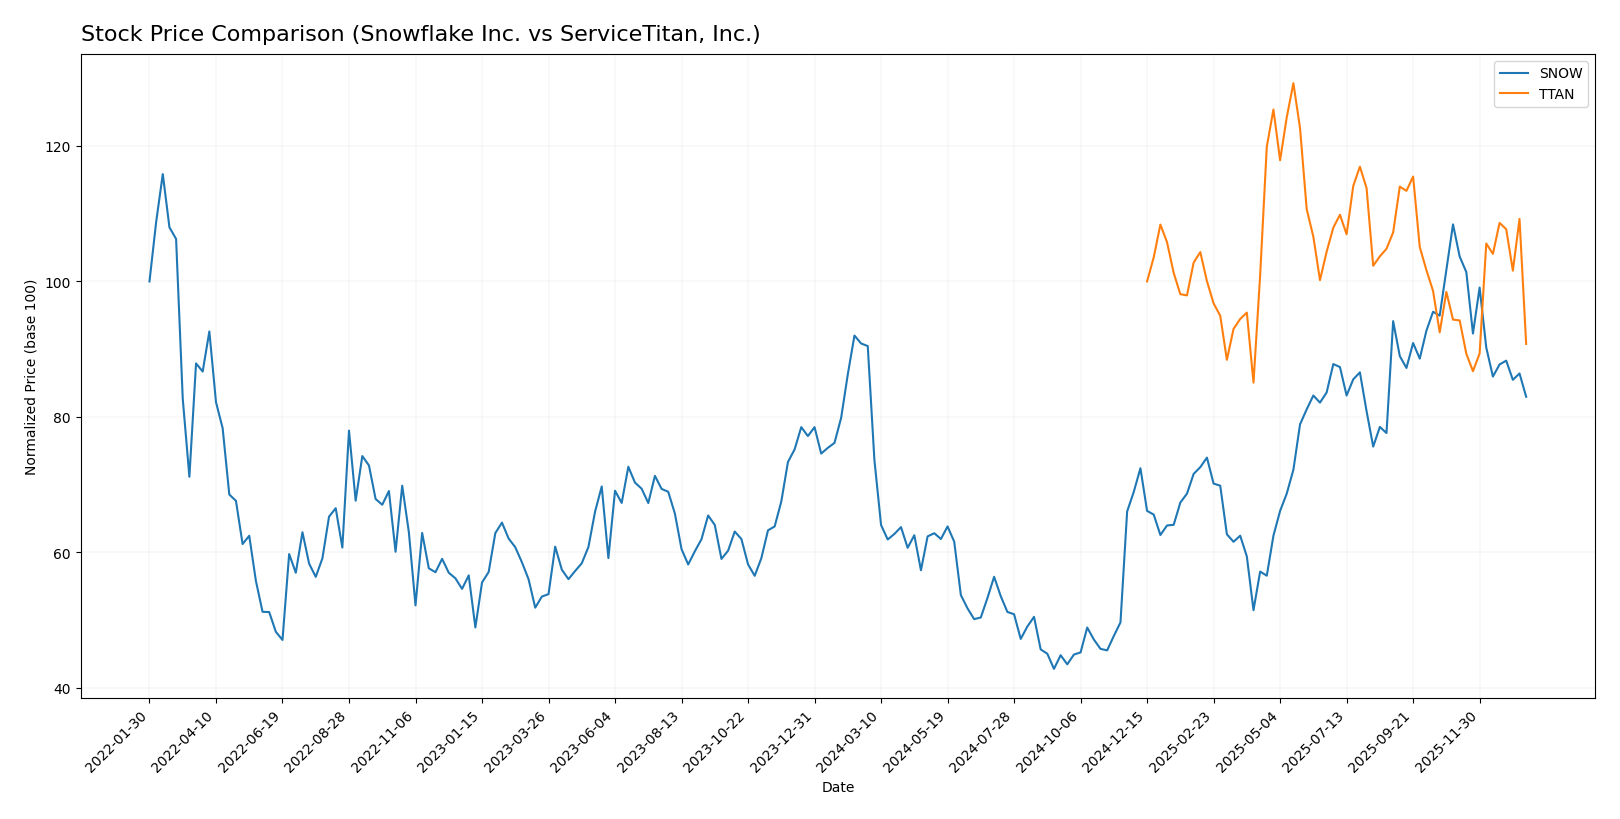
The stock price movements of Snowflake Inc. and ServiceTitan, Inc. over the past year reveal notable bearish trends, with Snowflake experiencing strong deceleration and higher volatility compared to ServiceTitan’s accelerating downward momentum.
Trend Analysis
Snowflake Inc. (SNOW) shows a bearish trend over the past 12 months, with an overall price decline of 8.27% and decelerating downward momentum. The stock experienced significant volatility, reflected in a 42.6 standard deviation and a high-low range from 274.88 to 108.56.
ServiceTitan, Inc. (TTAN) also presents a bearish trend over the last year, with a 9.22% price decrease but accelerating downward momentum. Its volatility is lower than Snowflake’s, with a standard deviation of 9.86 and a high-low range between 129.26 and 85.07.
Comparing both stocks, ServiceTitan delivered a slightly larger price drop than Snowflake. Snowflake’s higher volatility contrasts with ServiceTitan’s accelerating bearish trend, indicating differing risk and momentum profiles.
Target Prices
Analysts present a clear consensus on target prices for Snowflake Inc. and ServiceTitan, Inc.
| Company | Target High | Target Low | Consensus |
|---|---|---|---|
| Snowflake Inc. | 325 | 237 | 281.86 |
| ServiceTitan, Inc. | 145 | 117 | 132.44 |
The consensus target prices for Snowflake and ServiceTitan suggest significant upside potential compared to their current prices of 210.38 and 90.78, respectively, indicating positive analyst sentiment and expected growth.
Analyst Opinions Comparison
This section compares analysts’ ratings and grades for Snowflake Inc. and ServiceTitan, Inc.:
Rating Comparison
Snowflake Inc. Rating
- Rating: C- with a very favorable status
- Discounted Cash Flow Score: 3, moderate rating
- ROE Score: 1, very unfavorable
- ROA Score: 1, very unfavorable
- Debt To Equity Score: 1, very unfavorable
- Overall Score: 1, very unfavorable
ServiceTitan, Inc. Rating
- Rating: C- with a very favorable status
- Discounted Cash Flow Score: 1, very unfavorable rating
- ROE Score: 1, very unfavorable
- ROA Score: 1, very unfavorable
- Debt To Equity Score: 3, moderate rating
- Overall Score: 1, very unfavorable
Which one is the best rated?
Both companies share the same overall rating of C- and an overall score of 1, indicating very unfavorable financial standings. Snowflake shows a moderate discounted cash flow score, while ServiceTitan has a moderate debt-to-equity score, reflecting different strengths in their financial profiles.
Scores Comparison
Here is a comparison of the financial scores for Snowflake Inc. and ServiceTitan, Inc.:
Snowflake Inc. Scores
- Altman Z-Score: 5.36, indicating a safe zone with low bankruptcy risk.
- Piotroski Score: 4, reflecting average financial strength.
ServiceTitan, Inc. Scores
- Altman Z-Score: 15.74, indicating a safe zone with very low bankruptcy risk.
- Piotroski Score: 6, reflecting average financial strength.
Which company has the best scores?
ServiceTitan has a higher Altman Z-Score and Piotroski Score than Snowflake, suggesting comparatively stronger financial stability and health based on the provided data.
Grades Comparison
Here is the comparison of recent grades assigned to Snowflake Inc. and ServiceTitan, Inc.:
Snowflake Inc. Grades
The following table summarizes recent grades and rating actions from reputable grading companies for Snowflake Inc.:
| Grading Company | Action | New Grade | Date |
|---|---|---|---|
| Barclays | Downgrade | Equal Weight | 2026-01-12 |
| Argus Research | Upgrade | Buy | 2026-01-08 |
| Citigroup | Maintain | Buy | 2025-12-08 |
| Wells Fargo | Maintain | Overweight | 2025-12-04 |
| Keybanc | Maintain | Overweight | 2025-12-04 |
| Piper Sandler | Maintain | Overweight | 2025-12-04 |
| Morgan Stanley | Maintain | Overweight | 2025-12-04 |
| Wedbush | Maintain | Outperform | 2025-12-04 |
| Deutsche Bank | Maintain | Buy | 2025-12-04 |
| Cantor Fitzgerald | Maintain | Overweight | 2025-12-04 |
Overall, Snowflake shows a generally positive consensus with mostly “Buy” or “Overweight” grades and only one recent downgrade.
ServiceTitan, Inc. Grades
The following table summarizes recent grades and rating actions from reputable grading companies for ServiceTitan, Inc.:
| Grading Company | Action | New Grade | Date |
|---|---|---|---|
| Piper Sandler | Maintain | Overweight | 2025-12-05 |
| BMO Capital | Maintain | Outperform | 2025-12-05 |
| TD Cowen | Maintain | Buy | 2025-12-05 |
| Morgan Stanley | Maintain | Equal Weight | 2025-12-05 |
| BMO Capital | Maintain | Outperform | 2025-11-20 |
| Wells Fargo | Maintain | Overweight | 2025-09-19 |
| Stifel | Maintain | Buy | 2025-09-19 |
| Piper Sandler | Maintain | Overweight | 2025-09-19 |
| Canaccord Genuity | Maintain | Buy | 2025-09-19 |
| Citigroup | Maintain | Neutral | 2025-09-09 |
ServiceTitan maintains a positive outlook with multiple “Buy,” “Overweight,” and “Outperform” grades, and no downgrades or negative actions recorded recently.
Which company has the best grades?
Both Snowflake Inc. and ServiceTitan, Inc. hold predominantly positive grades with consensus ratings as “Buy.” Snowflake shows a slightly broader range of “Overweight” and “Buy” ratings with one downgrade, while ServiceTitan’s grades remain consistently maintained at “Buy” or better without downgrades. Investors may interpret these patterns as signals of sustained confidence from analysts for both companies.
Strengths and Weaknesses
The table below summarizes the key strengths and weaknesses of Snowflake Inc. (SNOW) and ServiceTitan, Inc. (TTAN) based on their recent financial performance and market positioning.
| Criterion | Snowflake Inc. (SNOW) | ServiceTitan, Inc. (TTAN) |
|---|---|---|
| Diversification | Moderate: Mainly product-driven revenues with some professional services; growing product sales (3.46B in 2025) | Moderate: Platform and subscription revenue streams (1.3B combined in 2025) |
| Profitability | Weak: Negative net margin (-35.45%), declining ROIC (-25.24%), value destroying | Weak: Negative net margin (-30.98%), stable but negative ROIC (-14.11%), value destroying |
| Innovation | Strong: Rapid product revenue growth indicating innovation in cloud data services | Moderate: Platform-centric innovation but profitability challenges persist |
| Global presence | Strong: Well-established global cloud footprint | Moderate: Primarily US-focused with expanding reach |
| Market Share | Significant in cloud data warehousing but facing competitive pressure | Niche leader in field service software with moderate market share |
Key takeaway: Both companies show challenges in profitability and value creation, with Snowflake demonstrating stronger innovation and global reach but also sharper declines in returns. ServiceTitan maintains stable operational metrics but remains unprofitable. Investors should weigh growth potential against ongoing value destruction risks.
Risk Analysis
Below is a summary table of key risks for Snowflake Inc. (SNOW) and ServiceTitan, Inc. (TTAN) based on the most recent 2025 data.
| Metric | Snowflake Inc. (SNOW) | ServiceTitan, Inc. (TTAN) |
|---|---|---|
| Market Risk | Moderate (Beta 1.14, volatile tech sector) | Lower (Beta -0.85, less correlated with market) |
| Debt level | Moderate (Debt/Equity 0.9, Debt/Assets 29.7%) | Low (Debt/Equity 0.11, Debt/Assets 9.35%) |
| Regulatory Risk | Moderate (Tech industry data/privacy concerns) | Moderate (Field service regulations) |
| Operational Risk | Medium (High fixed asset turnover but negative margins) | Medium (Negative margins, smaller scale) |
| Environmental Risk | Low (Software industry, minimal direct impact) | Low (Service software, limited exposure) |
| Geopolitical Risk | Medium (Global customer base, US-based) | Medium (US-focused but sensitive to supply chains) |
The most significant risks for both companies are their negative profitability and operational challenges, reflecting ongoing investments and growth efforts. Snowflake’s higher debt level and market volatility heighten financial risk, while ServiceTitan’s low leverage provides stability. Regulatory and geopolitical factors remain moderate but should be monitored closely, especially given evolving data privacy laws and global supply issues.
Which Stock to Choose?
Snowflake Inc. (SNOW) shows strong revenue growth of 29.2% in 2025 but suffers from negative profitability, with a net margin of -35.45% and declining returns on equity (-42.86%). Debt levels are moderate, and the rating is very favorable overall despite mixed financial ratios.
ServiceTitan, Inc. (TTAN) also posts robust revenue growth of 25.6% in 2025, with a net margin of -30.98% and less negative return on equity (-16.44%). Debt is relatively low, and its rating is very favorable, supported by a slightly more balanced ratio profile and a stable profitability trend.
Investors focused on growth might find SNOW’s rapid revenue expansion appealing despite profitability challenges, while those prioritizing financial stability and improving profitability metrics could consider TTAN, given its more favorable debt ratios and stable moat evaluation.
Disclaimer: Investment carries a risk of loss of initial capital. The past performance is not a reliable indicator of future results. Be sure to understand risks before making an investment decision.
Go Further
I encourage you to read the complete analyses of Snowflake Inc. and ServiceTitan, Inc. to enhance your investment decisions: