In today’s fast-evolving tech landscape, Shopify Inc. and ServiceTitan, Inc. stand out as key players in the software application industry, each driving innovation in commerce and field service management. While Shopify dominates global e-commerce platforms, ServiceTitan focuses on optimizing service operations for residential and commercial infrastructure. This article compares their market positions and growth strategies to help you decide which company deserves a spot in your investment portfolio.
Table of contents
Companies Overview
I will begin the comparison between Shopify and ServiceTitan by providing an overview of these two companies and their main differences.
Shopify Overview
Shopify Inc. is a commerce company headquartered in Ottawa, Canada, providing a comprehensive commerce platform across multiple regions including North America, Europe, and Asia Pacific. Its platform supports merchants in managing sales channels such as web storefronts, physical retail, social media, and marketplaces, along with services like payments, shipping, and financing. With a market cap of 205B USD and 8,100 employees, Shopify operates primarily in the software application industry.
ServiceTitan Overview
ServiceTitan, Inc., based in Glendale, California, specializes in software applications for field service management, focusing on residential and commercial infrastructure installation and maintenance. Founded in 2008, the company serves service providers by streamlining operational activities. It has a market cap of 8.5B USD and employs 3,049 people, positioning itself in the technology sector with a focus on niche field service solutions.
Key similarities and differences
Both Shopify and ServiceTitan operate in the software application industry within the technology sector and trade on NASDAQ. Shopify offers a broad commerce platform addressing multiple sales and operational functions for merchants worldwide, while ServiceTitan focuses specifically on field service management software for infrastructure services. Shopify is significantly larger by market cap and workforce, reflecting its broader market scope compared to ServiceTitan’s specialized service field.
Income Statement Comparison
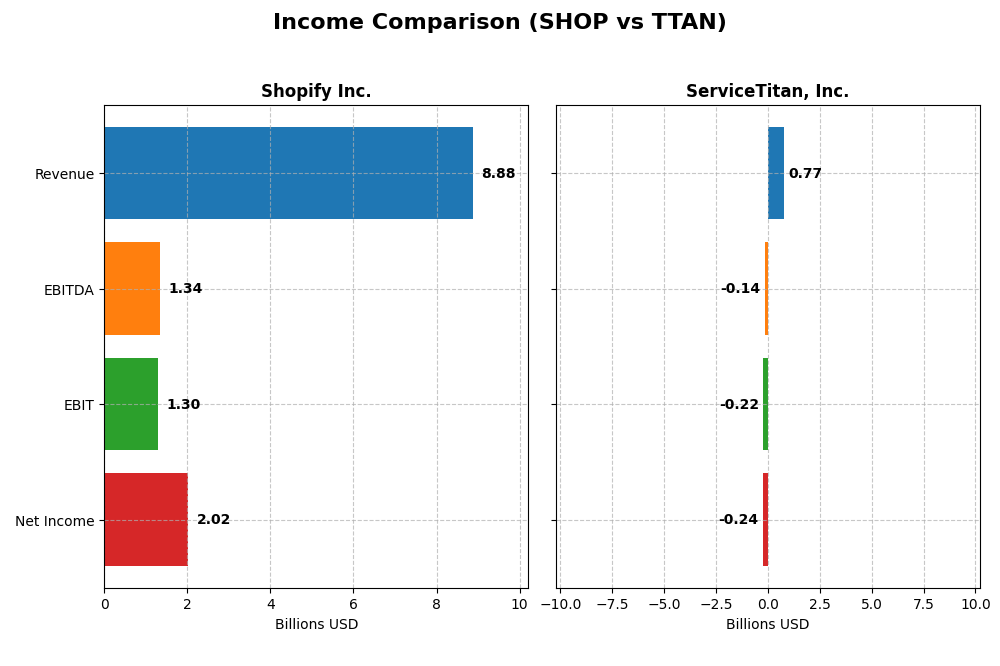
The table below compares key income statement metrics for Shopify Inc. and ServiceTitan, Inc. based on their most recent fiscal year data.
| Metric | Shopify Inc. (SHOP) | ServiceTitan, Inc. (TTAN) |
|---|---|---|
| Market Cap | 205B | 8.5B |
| Revenue | 8.88B | 772M |
| EBITDA | 1.34B | -141M |
| EBIT | 1.30B | -221M |
| Net Income | 2.02B | -239M |
| EPS | 1.56 | -8.53 |
| Fiscal Year | 2024 | 2025 |
Income Statement Interpretations
Shopify Inc.
Shopify Inc. shows strong revenue growth from 2020 to 2024, with revenue rising from $2.9B to $8.9B and net income increasing from $320M to $2.0B. Margins have improved significantly, with gross margin around 50% and a net margin exceeding 22% in 2024. The most recent year saw a 26% revenue growth and a remarkable rebound in net income, signaling robust margin expansion and operational efficiency.
ServiceTitan, Inc.
ServiceTitan’s revenue grew steadily from $468M in 2023 to $772M in 2025, representing a 65% increase over three years. However, the company continues to report net losses, with a net margin of -31% in 2025 despite a favorable gross margin near 65%. The latest year showed a solid top-line growth of 26% but a decline in EBIT and EPS, reflecting ongoing challenges in controlling operating expenses and achieving profitability.
Which one has the stronger fundamentals?
Based on income statement fundamentals, Shopify demonstrates stronger financial health with consistently favorable margin trends, substantial net income growth, and positive operational leverage. ServiceTitan, while growing revenue, struggles with negative profitability metrics and unfavorable EBIT margins, indicating higher risks. Shopify’s superior margin control and profitability position it with more robust income fundamentals.
Financial Ratios Comparison
The table below presents a side-by-side comparison of key financial ratios for Shopify Inc. and ServiceTitan, Inc. based on their most recent fiscal year data.
| Ratios | Shopify Inc. (2024) | ServiceTitan, Inc. (2025) |
|---|---|---|
| ROE | 17.47% | -16.44% |
| ROIC | 7.55% | -14.11% |
| P/E | 68.18 | -18.12 |
| P/B | 11.91 | 2.98 |
| Current Ratio | 3.71 | 3.74 |
| Quick Ratio | 3.70 | 3.74 |
| D/E (Debt-to-Equity) | 0.097 | 0.114 |
| Debt-to-Assets | 8.09% | 9.35% |
| Interest Coverage | 0 | -14.82 |
| Asset Turnover | 0.64 | 0.44 |
| Fixed Asset Turnover | 63.43 | 9.57 |
| Payout Ratio | 0 | 0 |
| Dividend Yield | 0 | 0 |
Interpretation of the Ratios
Shopify Inc.
Shopify’s ratios show a mixed profile with strong net margin (22.74%) and ROE (17.47%), indicating profitability, but a high PE (68.18) and PB (11.91) suggest overvaluation concerns. The low WACC (17.1%) and unfavorable current ratio (3.71) also raise caution. The company does not pay dividends, reflecting a reinvestment strategy focused on growth and R&D.
ServiceTitan, Inc.
ServiceTitan’s ratios reveal significant weaknesses, including a negative net margin (-30.98%) and ROE (-16.44%), underscoring operational challenges. While WACC is favorable at 4.9%, interest coverage is negative, signaling financial stress. The absence of dividends aligns with its high-growth phase and prioritization of reinvestment over shareholder payouts.
Which one has the best ratios?
Shopify demonstrates a more favorable ratio profile overall, with half of its ratios rated positively and profitability metrics standing out. ServiceTitan’s ratios are predominantly unfavorable, reflecting its current financial struggles. Consequently, Shopify exhibits stronger financial health based on the evaluated ratios.
Strategic Positioning
This section compares the strategic positioning of Shopify Inc. and ServiceTitan, Inc. in terms of market position, key segments, and exposure to technological disruption:
Shopify Inc.
- Leading global commerce platform with strong competitive pressure in e-commerce software.
- Key drivers are merchant solutions and subscription services focused on commerce enablement.
- Moderate exposure to technological disruption due to evolving e-commerce and payment technologies.
ServiceTitan, Inc.
- Niche player in field service software, facing moderate competitive pressure.
- Business driven by platform and subscription revenues in field service management.
- Limited exposure to technological disruption, focused on field service infrastructure software.
Shopify Inc. vs ServiceTitan, Inc. Positioning
Shopify offers a diversified commerce platform serving multiple regions and sales channels, while ServiceTitan concentrates on field service software for residential and commercial buildings. Shopify’s broad market reach contrasts with ServiceTitan’s specialized segment focus.
Which has the best competitive advantage?
Both companies are currently shedding value with ROIC below WACC. Shopify shows a growing ROIC trend indicating improving profitability, while ServiceTitan’s profitability remains stable but unfavorable, suggesting Shopify has a slightly stronger competitive moat.
Stock Comparison
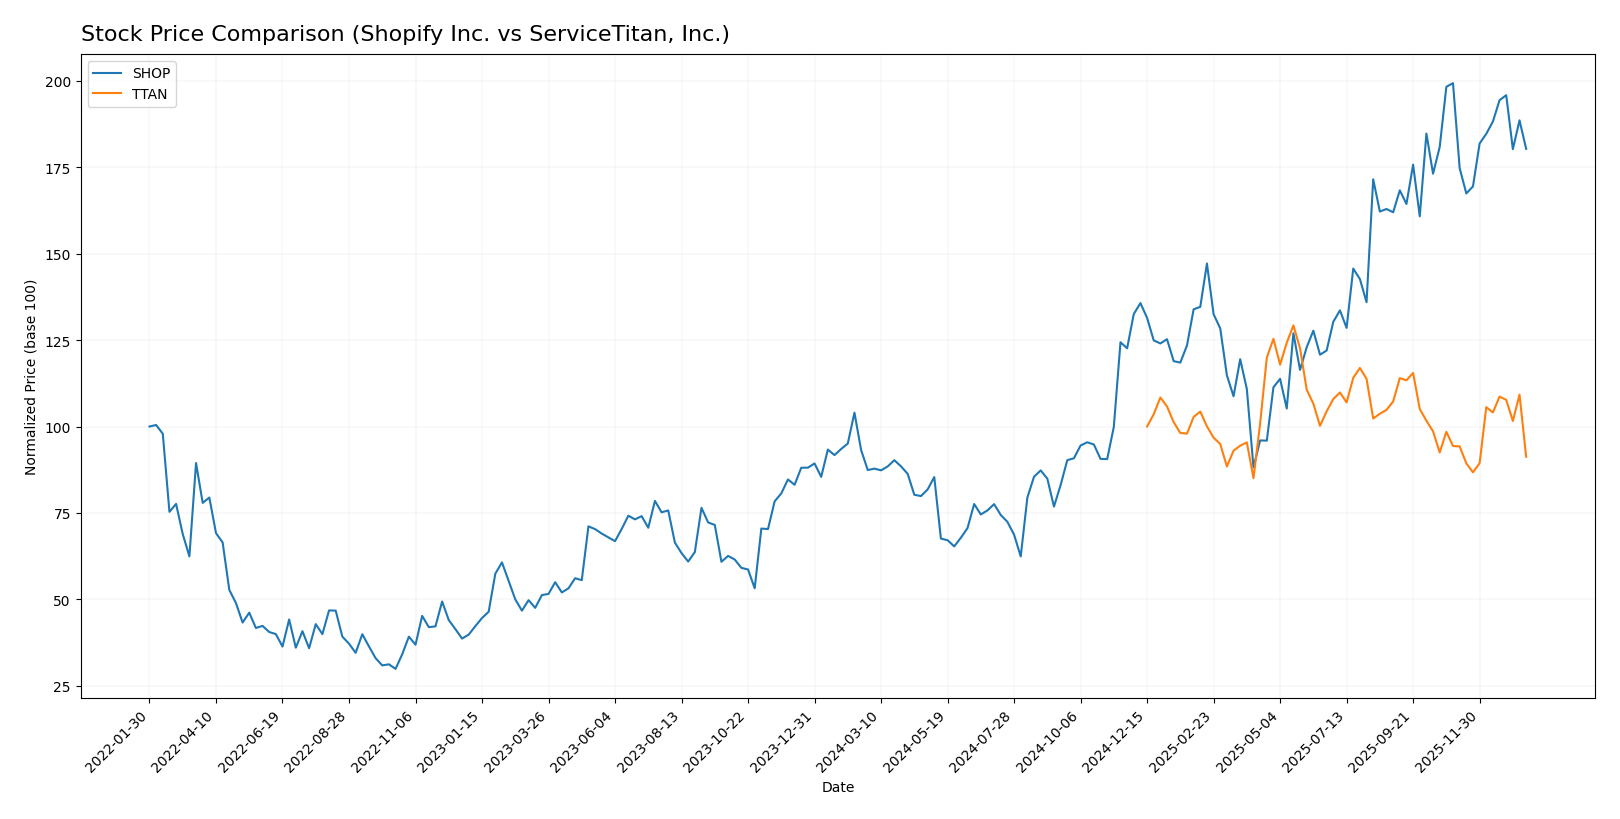
The past year has seen Shopify Inc. (SHOP) exhibit strong bullish momentum with a significant price increase, while ServiceTitan, Inc. (TTAN) experienced a bearish trend marked by declining prices and shifting trading volumes.
Trend Analysis
Shopify’s stock showed a robust 106.32% price increase over the past 12 months, indicating a bullish trend with deceleration in momentum. The stock ranged between 54.43 and 173.86, exhibiting high volatility with a 33.7 standard deviation.
ServiceTitan’s stock declined by 8.75% over the same period, reflecting a bearish trend with accelerating downward momentum. Its price fluctuated between 85.07 and 129.26, with a standard deviation of 9.85, indicating moderate volatility.
Comparing both, Shopify delivered the highest market performance with a strong positive return, whereas ServiceTitan posted a negative return, underscoring contrasting stock trajectories.
Target Prices
The current analyst consensus indicates promising upside potential for both Shopify Inc. and ServiceTitan, Inc.
| Company | Target High | Target Low | Consensus |
|---|---|---|---|
| Shopify Inc. | 200 | 140 | 186.24 |
| ServiceTitan, Inc. | 145 | 117 | 132.44 |
Analysts expect Shopify’s stock price to rise from the current 157.61 USD to around 186.24 USD on average, signaling bullish sentiment. ServiceTitan’s consensus target of 132.44 USD also suggests significant upside from its current 91.25 USD price.
Analyst Opinions Comparison
This section compares analysts’ ratings and grades for Shopify Inc. and ServiceTitan, Inc.:
Rating Comparison
SHOP Rating
- Rating: B, indicating a very favorable assessment by analysts.
- Discounted Cash Flow Score: Moderate at 3, reflecting balanced valuation.
- ROE Score: Favorable at 4, showing efficient profit generation from equity.
- ROA Score: Very favorable at 5, demonstrating excellent asset utilization.
- Debt To Equity Score: Moderate at 3, suggesting balanced financial risk.
- Overall Score: Moderate at 3, reflecting average overall financial health.
TTAN Rating
- Rating: C-, also noted as very favorable, despite lower scores.
- Discounted Cash Flow Score: Very unfavorable at 1, indicating potential overvaluation.
- ROE Score: Very unfavorable at 1, indicating weak profit generation efficiency.
- ROA Score: Very unfavorable at 1, showing poor asset utilisation.
- Debt To Equity Score: Moderate at 3, indicating similar financial risk profile.
- Overall Score: Very unfavorable at 1, suggesting weak overall financial standing.
Which one is the best rated?
Based strictly on the provided data, Shopify Inc. is better rated overall with a B rating and higher scores in key financial metrics like ROE and ROA, while ServiceTitan holds a C- rating with mostly very unfavorable scores except for debt-to-equity.
Scores Comparison
Here is a comparison of the Altman Z-Score and Piotroski Score for Shopify Inc. and ServiceTitan, Inc.:
SHOP Scores
- Altman Z-Score: 50.42, indicating a safe zone with very low bankruptcy risk.
- Piotroski Score: 6, reflecting average financial strength and value.
TTAN Scores
- Altman Z-Score: 15.74, indicating a safe zone with very low bankruptcy risk.
- Piotroski Score: 6, reflecting average financial strength and value.
Which company has the best scores?
Both Shopify and ServiceTitan are in the safe zone for Altman Z-Score, with Shopify showing a notably higher score. Their Piotroski Scores are identical, both indicating average financial strength.
Grades Comparison
Here is a comparison of the recent grades assigned to Shopify Inc. and ServiceTitan, Inc.:
Shopify Inc. Grades
This table summarizes recent grades assigned by reputable grading companies to Shopify Inc.:
| Grading Company | Action | New Grade | Date |
|---|---|---|---|
| Scotiabank | Upgrade | Sector Outperform | 2026-01-08 |
| Wolfe Research | Downgrade | Peer Perform | 2026-01-06 |
| Wells Fargo | Maintain | Overweight | 2025-12-17 |
| Truist Securities | Maintain | Hold | 2025-11-05 |
| CIBC | Maintain | Outperform | 2025-11-05 |
| Cantor Fitzgerald | Maintain | Neutral | 2025-11-05 |
| DA Davidson | Maintain | Buy | 2025-11-05 |
| Scotiabank | Maintain | Sector Perform | 2025-11-05 |
| Needham | Maintain | Buy | 2025-11-05 |
| JP Morgan | Maintain | Overweight | 2025-11-05 |
Overall, Shopify’s grades show a predominance of “Buy” and “Outperform” ratings, with some recent upgrades and downgrades indicating mixed but predominantly positive sentiment.
ServiceTitan, Inc. Grades
This table summarizes recent grades assigned by reputable grading companies to ServiceTitan, Inc.:
| Grading Company | Action | New Grade | Date |
|---|---|---|---|
| Piper Sandler | Maintain | Overweight | 2025-12-05 |
| BMO Capital | Maintain | Outperform | 2025-12-05 |
| TD Cowen | Maintain | Buy | 2025-12-05 |
| Morgan Stanley | Maintain | Equal Weight | 2025-12-05 |
| BMO Capital | Maintain | Outperform | 2025-11-20 |
| Wells Fargo | Maintain | Overweight | 2025-09-19 |
| Stifel | Maintain | Buy | 2025-09-19 |
| Piper Sandler | Maintain | Overweight | 2025-09-19 |
| Canaccord Genuity | Maintain | Buy | 2025-09-19 |
| Citigroup | Maintain | Neutral | 2025-09-09 |
ServiceTitan’s grades consistently show “Buy”, “Outperform”, and “Overweight” ratings, reflecting a stable positive outlook with no recent changes.
Which company has the best grades?
Both Shopify Inc. and ServiceTitan, Inc. have a consensus “Buy” rating, but Shopify exhibits a more mixed recent trend with both upgrades and downgrades. ServiceTitan maintains steadier positive grades without recent adjustments. This difference may affect investor confidence and perceived stability in each stock’s outlook.
Strengths and Weaknesses
Below is a comparative overview of Shopify Inc. (SHOP) and ServiceTitan, Inc. (TTAN) based on key performance and market criteria as of 2026.
| Criterion | Shopify Inc. (SHOP) | ServiceTitan, Inc. (TTAN) |
|---|---|---|
| Diversification | Strong with growing service and subscription revenues (6.53B service, 2.35B subscription in 2024) | Moderate, relies on platform (739M) and subscriptions (566M) in 2025 |
| Profitability | Favorable net margin (22.74%) and ROE (17.47%), but ROIC below WACC indicating value shedding | Negative net margin (-30.98%) and ROE (-16.44%), shedding value with stable but unfavorable ROIC |
| Innovation | High innovation evidenced by rapid ROIC growth (+514%) despite current value destruction | Innovation impact neutral with slight ROIC growth (+1.7%), but overall unfavorable profitability |
| Global presence | Established global e-commerce platform with broad merchant base | Primarily North American focus with niche market penetration |
| Market Share | Leading market share in e-commerce services with diversified revenue streams | Smaller market share focused on home services software solutions |
Key takeaways: Shopify demonstrates strong revenue diversification and improving profitability metrics despite current capital efficiency challenges. ServiceTitan struggles with profitability and value creation but maintains a focused market niche. Investors should weigh Shopify’s growth potential against its high valuation and ServiceTitan’s riskier financial profile.
Risk Analysis
Below is a comparison of key risks for Shopify Inc. (SHOP) and ServiceTitan, Inc. (TTAN) based on the most recent data in 2026:
| Metric | Shopify Inc. (SHOP) | ServiceTitan, Inc. (TTAN) |
|---|---|---|
| Market Risk | High beta 2.84 indicates high volatility | Negative beta -0.85 suggests inverse correlation with market |
| Debt Level | Low debt-to-equity 0.1, low debt-to-assets 8.09% | Low debt-to-equity 0.11, debt-to-assets 9.35% |
| Regulatory Risk | Moderate – operates globally with potential cross-border compliance issues | Moderate – US-focused but subject to tech and service regulations |
| Operational Risk | Medium – large employee base (8,100) and complex platform operations | Medium – smaller scale (3,049 employees) but newer IPO (2024) |
| Environmental Risk | Low – primarily software business with minimal direct environmental impact | Low – software for field services, minimal direct impact |
| Geopolitical Risk | Moderate – global presence exposes to geopolitical tensions | Lower – primarily US-based, less exposed internationally |
Shopify’s high market volatility and elevated valuation multiples pose notable market and valuation risks. ServiceTitan’s major risks stem from negative profitability metrics and operational scale as a relatively new public company. Both maintain low debt levels, mitigating financial distress risk.
Which Stock to Choose?
Shopify Inc. (SHOP) shows a robust income evolution with 25.78% revenue growth in 2024 and favorable profitability margins, including a 22.74% net margin. Its financial ratios are slightly favorable, supported by strong returns on equity (17.47%) and assets (14.5%), low debt levels, and a very favorable rating of B. Despite a slightly unfavorable moat due to ROIC below WACC, SHOP demonstrates growing profitability and solid financial health.
ServiceTitan, Inc. (TTAN) exhibits mixed signals with a favorable gross margin (64.9%) and revenue growth of 25.64% in 2025, but suffers from negative net margin (-30.98%) and unfavorable returns on equity and assets. Its financial ratios are slightly unfavorable overall, with moderate debt but weak interest coverage. TTAN holds a very favorable rating of C- despite unfavorable operational metrics and an unfavorable moat indicating value destruction.
Investors focused on growth and improving profitability might find Shopify’s consistent income growth and stronger financial ratios more appealing, while those with tolerance for higher risk and potential value recovery could interpret ServiceTitan’s profile as a speculative opportunity, considering its recent revenue gains amid profitability challenges.
Disclaimer: Investment carries a risk of loss of initial capital. The past performance is not a reliable indicator of future results. Be sure to understand risks before making an investment decision.
Go Further
I encourage you to read the complete analyses of Shopify Inc. and ServiceTitan, Inc. to enhance your investment decisions: