ServiceTitan, Inc. (TTAN) and PagerDuty, Inc. (PD) are two prominent players in the software application industry, each innovating to transform operational workflows. ServiceTitan focuses on field service management for residential and commercial infrastructure, while PagerDuty excels in digital operations management with AI-driven insights. Given their overlapping markets and tech-driven strategies, this comparison will help investors identify which company offers the most promising investment opportunity in 2026. Let’s explore their potential together.
Table of contents
Companies Overview
I will begin the comparison between ServiceTitan and PagerDuty by providing an overview of these two companies and their main differences.
ServiceTitan Overview
ServiceTitan, Inc. focuses on software solutions that support field service activities, including installation, maintenance, and servicing of infrastructure in residential and commercial buildings. Founded in 2008 and based in Glendale, CA, it holds a strong market position in the application software industry with a market cap near 9.5B USD and employs over 3,000 staff.
PagerDuty Overview
PagerDuty, Inc. operates a digital operations management platform that utilizes machine learning to analyze data from software-enabled systems globally. Established in 2009 and headquartered in San Francisco, CA, PagerDuty serves diverse sectors such as technology, telecommunications, and financial services. It has a market cap of approximately 1.1B USD and employs around 1,200 people.
Key similarities and differences
Both companies operate in the software application sector within the US technology industry, offering platforms that enhance operational efficiency. ServiceTitan specializes in field service management for physical infrastructure, while PagerDuty focuses on digital operations and predictive analytics across multiple industries. Their market caps and employee counts also differ significantly, reflecting varied scales and business focuses.
Income Statement Comparison
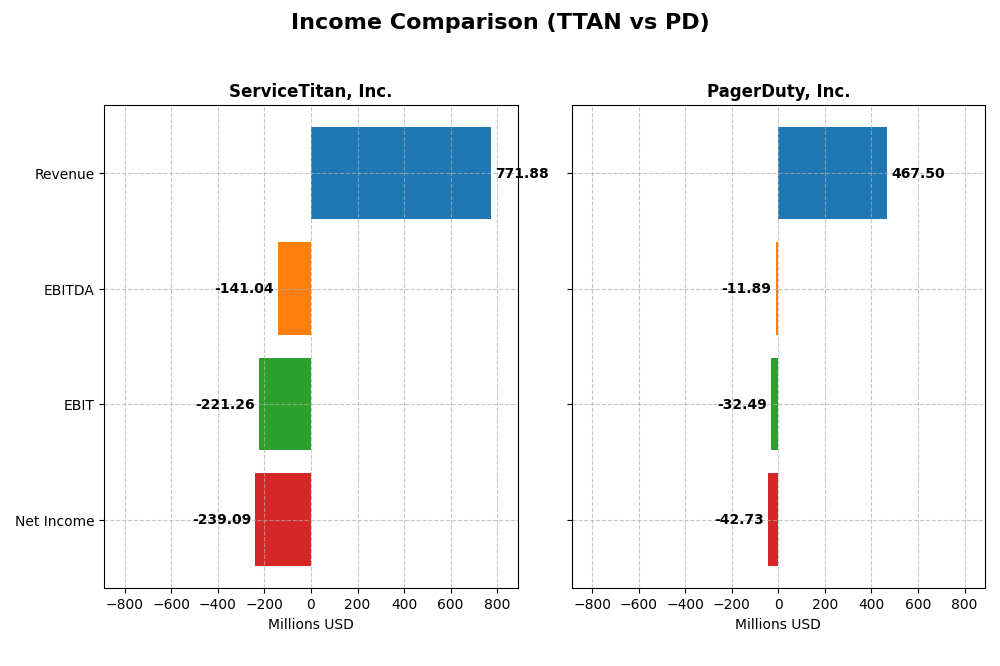
The table below presents key income statement metrics for ServiceTitan, Inc. and PagerDuty, Inc. for the fiscal year 2025, providing a side-by-side financial snapshot.
| Metric | ServiceTitan, Inc. (TTAN) | PagerDuty, Inc. (PD) |
|---|---|---|
| Market Cap | 9.51B | 1.14B |
| Revenue | 772M | 467M |
| EBITDA | -141M | -12M |
| EBIT | -221M | -32M |
| Net Income | -239M | -43M |
| EPS | -8.53 | -0.59 |
| Fiscal Year | 2025 | 2025 |
Income Statement Interpretations
ServiceTitan, Inc.
ServiceTitan’s revenue grew significantly by 65.02% from 2023 to 2025, reaching $772M in 2025, with a gross margin of 64.9%, which is favorable. However, the company remains unprofitable, with a net margin at -30.98% and EBIT margin deteriorating to -28.67%. The latest year saw revenue growth slow to 25.64%, while operating expenses grew at the same rate, pressuring EBIT further.
PagerDuty, Inc.
PagerDuty showed steady revenue growth, increasing 118.91% over 2021-2025 to $467M in 2025, with a strong gross margin of 82.96%. Despite persistent net losses, net margin improved to -9.14%, and EBIT margin improved to -6.95%. In 2025, revenue growth slowed to 8.54%, but EBIT and net margin expanded considerably, signaling operational improvements.
Which one has the stronger fundamentals?
PagerDuty exhibits stronger fundamentals with higher gross margins, improving EBIT and net margins, and consistent favorable growth across key income metrics. ServiceTitan, while growing revenue quickly, struggles with negative margins and worsening EBIT performance. PagerDuty’s better margin control and positive net margin trajectory favor its income statement strength compared to ServiceTitan.
Financial Ratios Comparison
Below is a comparison of key financial ratios for ServiceTitan, Inc. (TTAN) and PagerDuty, Inc. (PD) based on their most recent fiscal year data available (FY 2025).
| Ratios | ServiceTitan, Inc. (TTAN) | PagerDuty, Inc. (PD) |
|---|---|---|
| ROE | -16.4% | -32.9% |
| ROIC | -14.2% | -9.7% |
| P/E | -18.1 | -39.9 |
| P/B | 3.0 | 13.1 |
| Current Ratio | 3.74 | 1.87 |
| Quick Ratio | 3.74 | 1.87 |
| D/E (Debt-to-Equity) | 0.11 | 3.57 |
| Debt-to-Assets | 9.4% | 50.0% |
| Interest Coverage | -14.8 | -6.5 |
| Asset Turnover | 0.44 | 0.50 |
| Fixed Asset Turnover | 9.57 | 16.6 |
| Payout ratio | 0 | 0 |
| Dividend yield | 0 | 0 |
Interpretation of the Ratios
ServiceTitan, Inc.
ServiceTitan’s ratios paint a mixed picture. Key profitability measures like net margin (-30.98%), ROE (-16.44%), and ROIC (-14.25%) are unfavorable, signaling operational challenges. However, liquidity indicators such as quick ratio (3.74) and low debt levels (D/E 0.11) are positive. The company does not pay dividends, likely focusing on reinvestment and growth, with no distribution risks.
PagerDuty, Inc.
PagerDuty exhibits generally weaker profitability ratios, including net margin (-9.14%), ROE (-32.92%), and ROIC (-9.66%), all unfavorable. It carries a higher debt burden (D/E 3.57) and low interest coverage, which raises financial risk concerns. The current and quick ratios are favorable, but it also does not pay dividends, suggesting priority on growth or R&D over shareholder returns at this stage.
Which one has the best ratios?
Comparatively, ServiceTitan shows a slightly unfavorable overall ratio profile, while PagerDuty’s ratios are rated unfavorable, indicating higher financial stress. ServiceTitan’s stronger liquidity and lower leverage contrast with PagerDuty’s elevated debt and weaker profitability, making ServiceTitan the relatively better positioned company based on the available ratio analysis.
Strategic Positioning
This section compares the strategic positioning of ServiceTitan and PagerDuty, including market position, key segments, and exposure to technological disruption:
ServiceTitan, Inc.
- Large market cap of 9.5B; faces competitive pressure in software application for field services
- Focused on field service software for residential and commercial infrastructure; revenues from platform and subscriptions
- Exposure linked to software-enabled systems in field service sector; limited direct info on disruption
PagerDuty, Inc.
- Smaller market cap of 1.1B; competes in digital operations management platform space
- Offers digital operations platform serving diverse industries including tech, telecom, retail, and financial services
- Leverages machine learning for operations management, indicating higher exposure to tech disruption
ServiceTitan vs PagerDuty Positioning
ServiceTitan pursues a concentrated approach specializing in field service software with significant platform and subscription revenue streams. PagerDuty’s strategy is more diversified across industries with advanced digital and machine learning capabilities, presenting different growth drivers and risk profiles.
Which has the best competitive advantage?
Both companies are currently shedding value with ROIC below WACC, but PagerDuty shows improving profitability trends, while ServiceTitan remains stable but unfavorable, indicating PagerDuty may have a slight edge in competitive advantage progression.
Stock Comparison
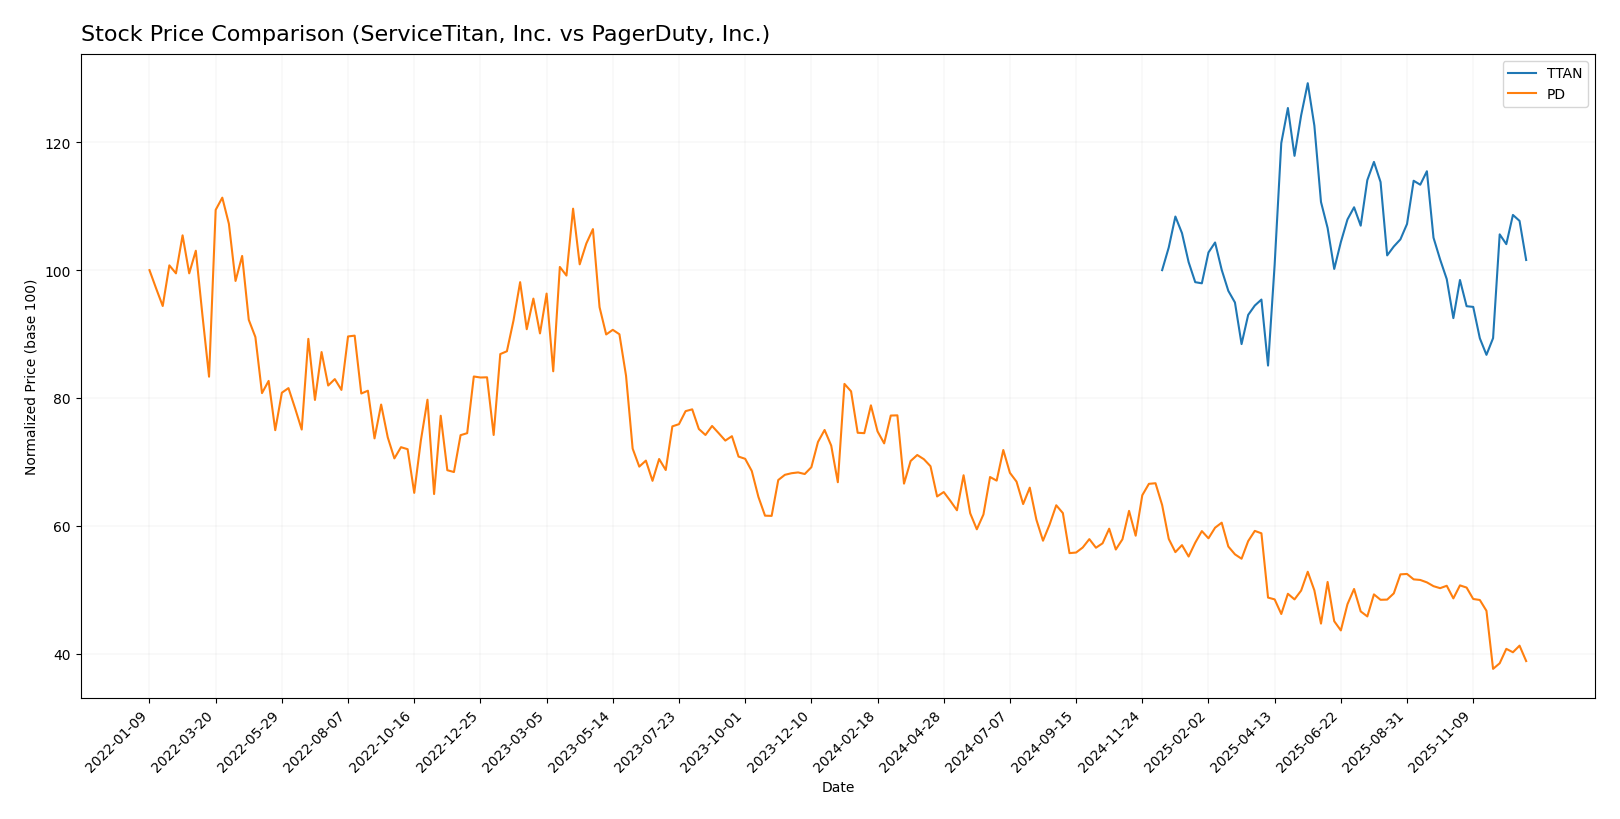
The stock price movements of ServiceTitan, Inc. (TTAN) and PagerDuty, Inc. (PD) over the past year reveal contrasting trading dynamics, with TTAN showing mild overall gains alongside recent acceleration, while PD experiences a significant decline with decelerating losses.
Trend Analysis
ServiceTitan, Inc. (TTAN) recorded a 1.59% price increase over the past 12 months, indicating a neutral to mildly bullish trend with accelerating momentum and a high volatility level (std deviation 9.85). It reached a high of 129.26 and a low of 85.07.
PagerDuty, Inc. (PD) faced a 50.76% price decline over the same period, confirming a bearish trend with deceleration and lower volatility (std deviation 2.93). The stock peaked at 25.16 and bottomed at 12.00.
Comparing the two, TTAN delivered the highest market performance with a slight positive gain, whereas PD showed a substantial loss, marking a clear divergence in stock trends.
Target Prices
The analyst consensus on target prices for ServiceTitan, Inc. and PagerDuty, Inc. suggests moderate upside potential based on current valuations.
| Company | Target High | Target Low | Consensus |
|---|---|---|---|
| ServiceTitan, Inc. | 145 | 125 | 135 |
| PagerDuty, Inc. | 19 | 15 | 16.75 |
Analysts expect ServiceTitan’s stock to rise from $101.59 to around $135, indicating a bullish outlook. PagerDuty’s target consensus at $16.75 also points to potential growth from its current $12.39 price.
Analyst Opinions Comparison
This section compares analysts’ ratings and grades for ServiceTitan, Inc. (TTAN) and PagerDuty, Inc. (PD):
Rating Comparison
TTAN Rating
- Rating: C- indicating a very favorable status overall.
- Discounted Cash Flow Score: 1, rated very unfavorable.
- ROE Score: 1, considered very unfavorable.
- ROA Score: 1, rated very unfavorable.
- Debt To Equity Score: 3, assessed as moderate risk.
- Overall Score: 1, very unfavorable overall financial score.
PD Rating
- Rating: A- reflecting a very favorable overall status.
- Discounted Cash Flow Score: 4, rated favorable.
- ROE Score: 5, considered very favorable.
- ROA Score: 5, rated very favorable.
- Debt To Equity Score: 1, assessed very unfavorable risk.
- Overall Score: 4, favorable overall financial score.
Which one is the best rated?
Based strictly on the provided data, PD is better rated than TTAN, with higher scores in overall rating, discounted cash flow, ROE, and ROA. TTAN’s debt to equity score is moderate, while PD’s is very unfavorable.
Scores Comparison
Here is a comparison of the financial health scores for ServiceTitan and PagerDuty:
ServiceTitan Scores
- Altman Z-Score: 19.0, indicating a safe zone with very low bankruptcy risk.
- Piotroski Score: 6, classified as average financial strength.
PagerDuty Scores
- Altman Z-Score: 1.37, indicating distress zone with higher bankruptcy risk.
- Piotroski Score: 7, classified as strong financial strength.
Which company has the best scores?
ServiceTitan shows a significantly higher Altman Z-Score, placing it in a safe zone compared to PagerDuty’s distress zone. PagerDuty, however, has a stronger Piotroski Score, indicating better financial strength by that measure.
Grades Comparison
The following section presents a comparison of the latest grades for ServiceTitan, Inc. and PagerDuty, Inc.:
ServiceTitan, Inc. Grades
This table summarizes recent ratings assigned by notable grading companies for ServiceTitan, Inc.:
| Grading Company | Action | New Grade | Date |
|---|---|---|---|
| TD Cowen | Maintain | Buy | 2025-12-05 |
| Piper Sandler | Maintain | Overweight | 2025-12-05 |
| BMO Capital | Maintain | Outperform | 2025-12-05 |
| Morgan Stanley | Maintain | Equal Weight | 2025-12-05 |
| BMO Capital | Maintain | Outperform | 2025-11-20 |
| Piper Sandler | Maintain | Overweight | 2025-09-19 |
| Stifel | Maintain | Buy | 2025-09-19 |
| Wells Fargo | Maintain | Overweight | 2025-09-19 |
| Canaccord Genuity | Maintain | Buy | 2025-09-19 |
| Citigroup | Maintain | Neutral | 2025-09-09 |
Overall, ServiceTitan’s grades mostly indicate confidence with predominantly Buy, Overweight, and Outperform ratings maintained recently.
PagerDuty, Inc. Grades
This table presents the most recent grades from recognized grading companies for PagerDuty, Inc.:
| Grading Company | Action | New Grade | Date |
|---|---|---|---|
| RBC Capital | Maintain | Outperform | 2025-11-26 |
| Craig-Hallum | Downgrade | Hold | 2025-11-26 |
| Morgan Stanley | Maintain | Equal Weight | 2025-11-26 |
| TD Cowen | Maintain | Buy | 2025-11-26 |
| Truist Securities | Maintain | Buy | 2025-11-19 |
| Baird | Maintain | Neutral | 2025-09-04 |
| Canaccord Genuity | Maintain | Buy | 2025-09-04 |
| RBC Capital | Maintain | Outperform | 2025-09-04 |
| Canaccord Genuity | Maintain | Buy | 2025-06-02 |
| Truist Securities | Maintain | Buy | 2025-05-30 |
PagerDuty shows a mix of Buy and Outperform ratings, though a recent downgrade to Hold from Craig-Hallum signals some caution.
Which company has the best grades?
ServiceTitan, Inc. generally holds stronger and more consistent Buy, Overweight, and Outperform grades compared to PagerDuty, Inc., which sees a recent downgrade and more mixed ratings. This disparity might influence investor sentiment regarding growth and risk profiles.
Strengths and Weaknesses
Below is a comparison of the key strengths and weaknesses of ServiceTitan, Inc. (TTAN) and PagerDuty, Inc. (PD) based on the most recent financial and strategic data.
| Criterion | ServiceTitan, Inc. (TTAN) | PagerDuty, Inc. (PD) |
|---|---|---|
| Diversification | Moderate: Primarily platform and subscription revenue streams (739M and 566M USD respectively) | Limited diversification; relies heavily on core incident management services |
| Profitability | Unfavorable: Negative net margin (-31%) and ROIC (-14.3%) indicating value destruction | Unfavorable: Negative net margin (-9.1%) and ROIC (-9.7%), but improving ROIC trend |
| Innovation | Moderate: Stable asset turnover and fixed asset efficiency (9.57) | Moderate to strong: Higher fixed asset turnover (16.61) and growing ROIC trend |
| Global presence | Growing, but limited data on international scale | Growing global footprint with increasing profitability trend |
| Market Share | Challenged by negative profitability but stable platform revenue | Market share growth potential supported by improving profitability trend |
Key takeaway: Both companies are currently shedding value with negative profitability metrics, though PagerDuty shows a more promising trend in ROIC growth. ServiceTitan benefits from strong subscription revenues but struggles with overall profitability. Investors should weigh PagerDuty’s improving efficiency against ServiceTitan’s more established revenue base and cautiously monitor their financial recovery trajectories.
Risk Analysis
Below is a comparative risk assessment table for ServiceTitan, Inc. (TTAN) and PagerDuty, Inc. (PD) based on the most recent 2025 data:
| Metric | ServiceTitan, Inc. (TTAN) | PagerDuty, Inc. (PD) |
|---|---|---|
| Market Risk | Moderate (Beta -0.85, volatile price range) | Moderate (Beta 0.69, volatile price range) |
| Debt level | Low (Debt-to-Equity 0.11, Debt-to-Assets 9.35%) | High (Debt-to-Equity 3.57, Debt-to-Assets 50%) |
| Regulatory Risk | Moderate (Tech sector, US-based) | Moderate (Tech sector, US & international) |
| Operational Risk | Medium (Negative margins, operational inefficiencies) | Medium (Negative margins, high employee costs) |
| Environmental Risk | Low (Software industry, limited direct impact) | Low (Software industry, limited direct impact) |
| Geopolitical Risk | Low (Primarily US operations) | Moderate (International exposure) |
Synthesis: PagerDuty faces higher financial risk due to its substantial debt burden and distress-level Altman Z-score, increasing bankruptcy risk. ServiceTitan shows negative profitability but maintains low leverage and a strong Altman Z-score, indicating better financial stability. Market volatility affects both, but PagerDuty’s international scope adds geopolitical uncertainty. Investors should weigh PagerDuty’s growth potential against its financial distress and ServiceTitan’s operational challenges carefully.
Which Stock to Choose?
ServiceTitan, Inc. (TTAN) shows favorable income growth with a 25.64% revenue increase in 2025 and a strong gross margin of 64.9%. However, profitability ratios including ROE (-16.44%) and net margin (-30.98%) are unfavorable, and the company is shedding value with a negative ROIC compared to WACC. Its rating is very favorable overall, despite some weak scores in profitability and valuation metrics.
PagerDuty, Inc. (PD) presents steady income growth with an 8.54% revenue increase in 2025 and an excellent gross margin at 82.96%. Profitability ratios such as ROE (-32.92%) and net margin (-9.14%) remain unfavorable, and the company is also destroying value though with a growing ROIC trend. Its overall rating is very favorable, supported by strong returns but challenged by high debt levels and valuation concerns.
Investors seeking growth might find ServiceTitan’s stronger revenue expansion and higher gross margin appealing, while those focused on improving profitability and financial health could see PagerDuty’s growing ROIC and solid rating as positive signs. Risk-averse investors may note both companies’ value destruction signals and weigh the income and ratio profiles accordingly.
Disclaimer: Investment carries a risk of loss of initial capital. The past performance is not a reliable indicator of future results. Be sure to understand risks before making an investment decision.
Go Further
I encourage you to read the complete analyses of ServiceTitan, Inc. and PagerDuty, Inc. to enhance your investment decisions: