In today’s fast-evolving tech landscape, ServiceTitan, Inc. (TTAN) and Asana, Inc. (ASAN) stand out as prominent players in the software application industry. Both companies focus on optimizing business operations—ServiceTitan through field service management and Asana via work management platforms—targeting overlapping markets with distinct innovation strategies. This article will explore their strengths to help you decide which company offers the most compelling investment opportunity.
Table of contents
Companies Overview
I will begin the comparison between ServiceTitan and Asana by providing an overview of these two companies and their main differences.
ServiceTitan Overview
ServiceTitan, Inc. focuses on software applications that support field service activities essential for installing, maintaining, and servicing infrastructure in residential and commercial buildings. Founded in 2008 and headquartered in Glendale, CA, it occupies a strong position in the technology sector with a market cap of approximately 9.5B USD and employs over 3,000 full-time staff.
Asana Overview
Asana, Inc. operates a work management platform designed to help individuals, teams, and executives orchestrate work across various industries, including technology, retail, and healthcare. Founded in 2008 and based in San Francisco, CA, Asana has a market capitalization of about 3.1B USD and employs around 1,800 people, serving a broad international customer base.
Key similarities and differences
Both companies operate in the software application industry within the technology sector, focusing on improving operational efficiency for businesses. ServiceTitan specializes in field service management for infrastructure, while Asana provides a broader work orchestration platform across multiple industry sectors. ServiceTitan is larger by market cap and workforce, whereas Asana has a more diversified customer base and longer public trading history.
Income Statement Comparison
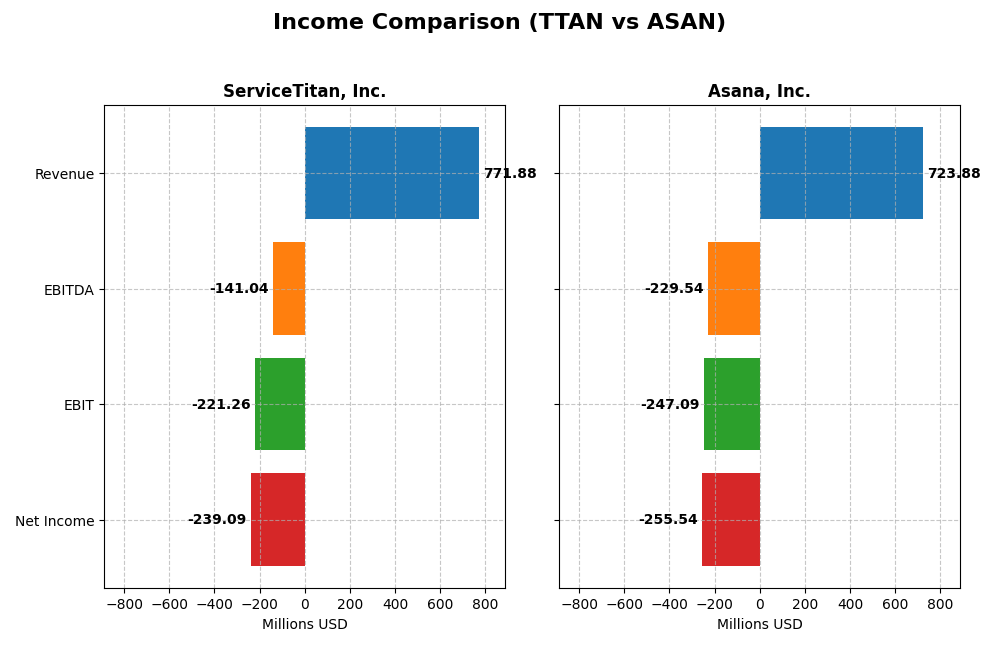
This table provides a side-by-side comparison of key income statement metrics for ServiceTitan, Inc. and Asana, Inc. for the fiscal year 2025.
| Metric | ServiceTitan, Inc. (TTAN) | Asana, Inc. (ASAN) |
|---|---|---|
| Market Cap | 9.5B | 3.1B |
| Revenue | 772M | 724M |
| EBITDA | -141M | -230M |
| EBIT | -221M | -247M |
| Net Income | -239M | -256M |
| EPS | -8.53 | -1.11 |
| Fiscal Year | 2025 | 2025 |
Income Statement Interpretations
ServiceTitan, Inc.
ServiceTitan showed strong revenue growth from 2023 to 2025, rising 65.02%, with net income also improving by 11.29% overall. The gross margin remained favorable at 64.9%, but operating and net margins were negative, reflecting ongoing losses. In 2025, revenue grew 25.64%, with gross profit up 33%, yet EBIT declined 26.74%, signaling margin pressures despite top-line expansion.
Asana, Inc.
Asana experienced robust revenue growth of 218.88% over 2021-2025, with a favorable gross margin of 89.34%. However, net income declined 20.7% overall, and EBIT margins stayed negative at -34.13%. In the latest year, revenue rose 10.94% with improved operating expense control, leading to a modest EBIT increase and a 10.38% net margin growth, indicating gradual profitability progress.
Which one has the stronger fundamentals?
Asana demonstrates stronger fundamentals in terms of revenue growth, gross margins, and improving profitability metrics, with mostly favorable income statement trends. ServiceTitan also shows healthy revenue growth and gross margins but struggles with larger negative operating margins and deteriorating EBIT. Overall, Asana’s higher margin stability and favorable expense growth suggest relatively stronger income fundamentals.
Financial Ratios Comparison
The following table presents a side-by-side comparison of key financial ratios for ServiceTitan, Inc. and Asana, Inc. based on the most recent fiscal year data available (2025).
| Ratios | ServiceTitan, Inc. (TTAN) | Asana, Inc. (ASAN) |
|---|---|---|
| ROE | -16.4% | -112.3% |
| ROIC | -14.2% | -54.0% |
| P/E | -18.1 | -19.2 |
| P/B | 2.98 | 21.52 |
| Current Ratio | 3.74 | 1.44 |
| Quick Ratio | 3.74 | 1.44 |
| D/E | 0.11 | 1.18 |
| Debt-to-Assets | 9.4% | 30.1% |
| Interest Coverage | -14.8 | -72.4 |
| Asset Turnover | 0.44 | 0.81 |
| Fixed Asset Turnover | 9.57 | 2.76 |
| Payout ratio | 0 | 0 |
| Dividend yield | 0% | 0% |
Interpretation of the Ratios
ServiceTitan, Inc.
ServiceTitan displays a mixed ratio profile with 42.86% favorable and 50% unfavorable metrics, indicating a slightly unfavorable overall stance. Key weaknesses include negative net margin (-30.98%), return on equity (-16.44%), and return on invested capital (-14.25%). The company maintains a strong quick ratio (3.74) and low debt levels. It currently does not pay dividends, likely reflecting reinvestment priorities or ongoing growth challenges.
Asana, Inc.
Asana’s financial ratios reveal more challenges with only 21.43% favorable and 50% unfavorable ratios, also rated slightly unfavorable. The firm suffers from severe profitability issues such as a net margin of -35.3%, return on equity at -112.31%, and return on invested capital at -54.04%. Its leverage is comparatively high (debt-to-equity 1.18) and no dividends are paid, consistent with a growth-phase strategy focused on reinvestment.
Which one has the best ratios?
Both companies have slightly unfavorable overall ratio profiles, but ServiceTitan has a higher proportion of favorable ratios (42.86% vs. 21.43%) and lower leverage, suggesting relatively better financial stability. However, both face significant profitability and dividend yield challenges, with no dividend payouts and negative returns indicating ongoing operational difficulties.
Strategic Positioning
This section compares the strategic positioning of ServiceTitan and Asana, including Market position, Key segments, and exposure to disruption:
ServiceTitan, Inc.
- Established market presence in software for field service with competitive pressures from other application providers.
- Focuses on field service activities for residential and commercial infrastructure with platform and subscription revenues.
- Exposure to technology disruption not explicitly stated; operates in a traditional software application industry.
Asana, Inc.
- Operates a work management platform serving diverse industries with strong competition in collaboration software.
- Targets individuals and teams managing work across various sectors including technology, retail, and healthcare.
- No explicit exposure to technological disruption detailed, but operates in a dynamic, innovative software segment.
ServiceTitan vs Asana Positioning
ServiceTitan’s strategy is more concentrated on field service software with clear revenue segmentation, while Asana adopts a diversified approach serving multiple industries with a broad work management platform. ServiceTitan’s focus may limit market scope compared to Asana’s broader reach.
Which has the best competitive advantage?
Both companies currently shed value as ROIC is below WACC; however, ServiceTitan shows stable profitability, whereas Asana faces declining returns, indicating a weaker competitive advantage for Asana based on MOAT evaluation.
Stock Comparison
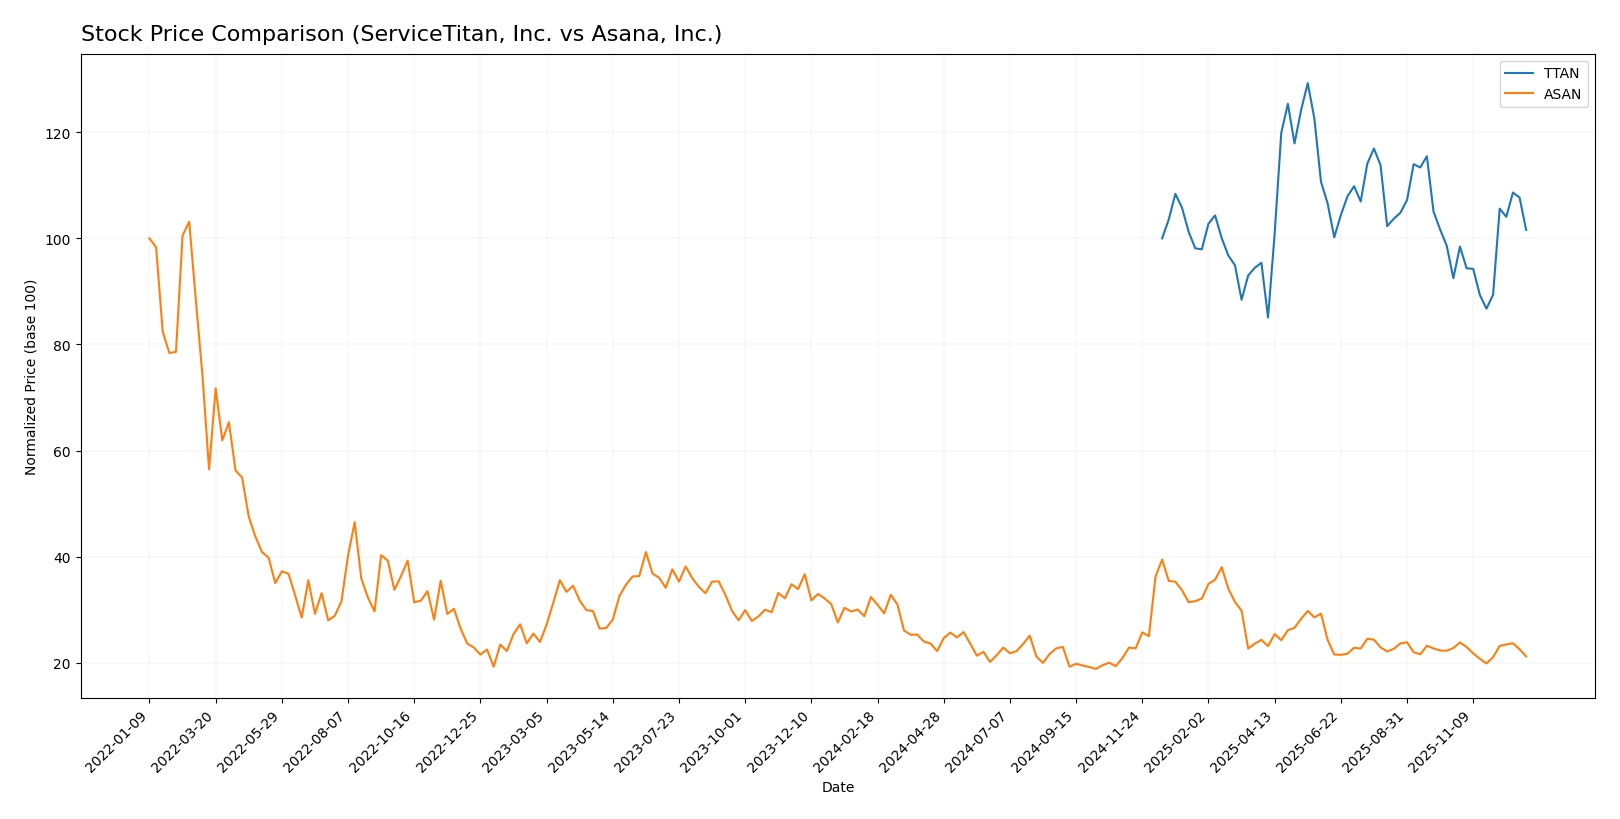
The stock price movements of ServiceTitan, Inc. (TTAN) and Asana, Inc. (ASAN) over the past year reveal contrasting trends, with TTAN showing mild upward momentum and ASAN experiencing significant declines.
Trend Analysis
ServiceTitan, Inc. (TTAN) exhibited a 1.59% price increase over the past 12 months, indicating a neutral to mildly bullish trend with accelerating momentum and price fluctuations between 85.07 and 129.26.
Asana, Inc. (ASAN) posted a -34.64% price drop over the same period, reflecting a clear bearish trend with deceleration and a lower volatility profile, as prices ranged from 11.53 to 24.15.
Comparing the two, TTAN delivered the highest market performance with a modest gain, while ASAN showed a pronounced negative return during the year.
Target Prices
Analysts present a clear consensus on target prices for ServiceTitan, Inc. and Asana, Inc., indicating potential upside from current levels.
| Company | Target High | Target Low | Consensus |
|---|---|---|---|
| ServiceTitan, Inc. | 145 | 125 | 135 |
| Asana, Inc. | 18 | 14 | 15.75 |
For ServiceTitan, the consensus target price of 135 suggests a significant premium over the current price of 101.59, indicating confidence in growth prospects. Asana’s consensus target of 15.75 also implies upside from the current price of 12.96, reflecting moderate bullish sentiment among analysts.
Analyst Opinions Comparison
This section compares analysts’ ratings and grades for ServiceTitan, Inc. and Asana, Inc.:
Rating Comparison
ServiceTitan Rating
- C- rating classified as Very Favorable by analysts.
- Discounted Cash Flow Score is 1, indicating a Very Unfavorable valuation outlook.
- Return on Equity Score is 1, showing Very Unfavorable profitability efficiency.
- Return on Assets Score is 1, reflecting Very Unfavorable asset utilization.
- Debt To Equity Score is 3, considered Moderate financial risk with a stronger balance sheet.
- Overall Score is 1, categorized as Very Unfavorable overall financial health.
Asana Rating
- D+ rating classified as Very Favorable by analysts.
- Discounted Cash Flow Score is 1, indicating a Very Unfavorable valuation outlook.
- Return on Equity Score is 1, showing Very Unfavorable profitability efficiency.
- Return on Assets Score is 1, reflecting Very Unfavorable asset utilization.
- Debt To Equity Score is 1, indicating Very Unfavorable financial risk with high leverage.
- Overall Score is 1, categorized as Very Unfavorable overall financial health.
Which one is the best rated?
Based strictly on provided data, ServiceTitan holds a slightly better financial position due to a moderate debt-to-equity score, while both companies share identical unfavorable scores in other key financial metrics and overall score.
Scores Comparison
Here is a comparison of the Altman Z-Score and Piotroski Score for the two companies:
TTAN Scores
- Altman Z-Score: 19.0, in the safe zone, indicating low bankruptcy risk.
- Piotroski Score: 6, average financial strength rating.
ASAN Scores
- Altman Z-Score: -0.20, in the distress zone, indicating high bankruptcy risk.
- Piotroski Score: 4, average financial strength rating.
Which company has the best scores?
TTAN shows a significantly higher Altman Z-Score in the safe zone, while ASAN’s score is in the distress zone. Both have average Piotroski scores, but TTAN’s overall financial stability appears stronger based on these metrics.
Grades Comparison
Here is a detailed comparison of the recent grades assigned to ServiceTitan, Inc. and Asana, Inc.:
ServiceTitan, Inc. Grades
The following table summarizes recent grades from major grading companies for ServiceTitan, Inc.:
| Grading Company | Action | New Grade | Date |
|---|---|---|---|
| TD Cowen | Maintain | Buy | 2025-12-05 |
| Piper Sandler | Maintain | Overweight | 2025-12-05 |
| BMO Capital | Maintain | Outperform | 2025-12-05 |
| Morgan Stanley | Maintain | Equal Weight | 2025-12-05 |
| BMO Capital | Maintain | Outperform | 2025-11-20 |
| Piper Sandler | Maintain | Overweight | 2025-09-19 |
| Stifel | Maintain | Buy | 2025-09-19 |
| Wells Fargo | Maintain | Overweight | 2025-09-19 |
| Canaccord Genuity | Maintain | Buy | 2025-09-19 |
| Citigroup | Maintain | Neutral | 2025-09-09 |
Overall, ServiceTitan’s grades show a consistent positive trend with multiple “Buy,” “Overweight,” and “Outperform” ratings, indicating generally favorable analyst sentiment.
Asana, Inc. Grades
The following table summarizes recent grades from major grading companies for Asana, Inc.:
| Grading Company | Action | New Grade | Date |
|---|---|---|---|
| Keybanc | Upgrade | Overweight | 2025-12-15 |
| DA Davidson | Maintain | Neutral | 2025-12-04 |
| RBC Capital | Maintain | Underperform | 2025-12-03 |
| UBS | Maintain | Neutral | 2025-12-03 |
| Citigroup | Maintain | Neutral | 2025-12-03 |
| Piper Sandler | Maintain | Overweight | 2025-09-04 |
| Baird | Maintain | Neutral | 2025-09-04 |
| Morgan Stanley | Maintain | Underweight | 2025-09-04 |
| B of A Securities | Maintain | Buy | 2025-06-04 |
| JP Morgan | Maintain | Underweight | 2025-06-04 |
Asana’s grades indicate a mixed analyst perspective with a recent upgrade to “Overweight” but also several “Neutral,” “Underperform,” and “Underweight” ratings, reflecting varying confidence levels.
Which company has the best grades?
ServiceTitan holds a stronger consensus of positive grades, primarily “Buy,” “Overweight,” and “Outperform,” suggesting better analyst confidence. Asana displays a more cautious outlook with mixed ratings, which may imply higher uncertainty and risk for investors.
Strengths and Weaknesses
Below is a comparative overview of key strengths and weaknesses for ServiceTitan, Inc. (TTAN) and Asana, Inc. (ASAN) based on the most recent financial and operational data.
| Criterion | ServiceTitan, Inc. (TTAN) | Asana, Inc. (ASAN) |
|---|---|---|
| Diversification | Moderate, primarily platform and subscription revenue streams (total 1.3B USD in 2025) | Limited diversification, focused on workflow management software |
| Profitability | Negative net margin (-31%), ROIC -14.25%, shedding value but stable ROIC trend | Negative net margin (-35.3%), ROIC -54%, sharply declining profitability |
| Innovation | Moderate innovation supported by platform growth and solid fixed asset turnover (9.57) | Innovation challenged by declining profitability and high PB ratio (21.52) |
| Global presence | Growing but primarily North American focused | Global presence but financials indicate higher risk |
| Market Share | Growing platform adoption in service industries | Competitive market with pressure on margins and value creation |
In summary, ServiceTitan shows more stable profitability metrics and efficient capital use despite current losses, supported by strong platform revenues. Asana faces more significant profitability challenges with declining returns and higher financial leverage, increasing investment risk. Both companies warrant cautious consideration, with ServiceTitan presenting a slightly more favorable risk profile.
Risk Analysis
Below is a comparative table of key risks for ServiceTitan, Inc. (TTAN) and Asana, Inc. (ASAN) based on the most recent 2025 data:
| Metric | ServiceTitan, Inc. (TTAN) | Asana, Inc. (ASAN) |
|---|---|---|
| Market Risk | Moderate (Beta: -0.85) | Higher (Beta: 0.93) |
| Debt level | Low (D/E: 0.11, favorable) | High (D/E: 1.18, unfavorable) |
| Regulatory Risk | Moderate | Moderate |
| Operational Risk | Medium (Negative margins) | High (Negative margins, lower ROE) |
| Environmental Risk | Low/Not significant | Low/Not significant |
| Geopolitical Risk | Moderate (US-focused) | Moderate (US-focused) |
ServiceTitan benefits from low leverage and a strong Altman Z-Score indicating low bankruptcy risk, but its negative profitability and operational efficiency are concerns. Asana faces significant financial distress risk with a negative Z-Score and high debt, increasing vulnerability. Market volatility impacts Asana more due to higher beta. Investors should weigh operational weaknesses and financial risk carefully.
Which Stock to Choose?
ServiceTitan, Inc. (TTAN) shows favorable income growth with a 65% revenue increase over three years and a strong gross margin near 65%. However, profitability ratios remain unfavorable with negative returns on equity and assets, while debt levels and interest coverage display mixed signals. Its overall rating is very favorable despite some financial weaknesses.
Asana, Inc. (ASAN) presents solid revenue growth of 219% over five years and an excellent gross margin above 89%. Profitability metrics are deeply negative with significant losses on equity and invested capital, alongside a concerning debt-to-equity ratio. The rating remains very favorable, but financial stability appears weaker compared to TTAN.
For investors prioritizing growth potential, ASAN’s robust revenue expansion and high gross margin might appear attractive despite value destruction signals. Conversely, risk-averse or quality-focused investors could see TTAN’s more balanced rating and stable, albeit negative, profitability as a more cautious option. Both companies exhibit unfavorable economic moats, suggesting ongoing value challenges.
Disclaimer: Investment carries a risk of loss of initial capital. The past performance is not a reliable indicator of future results. Be sure to understand risks before making an investment decision.
Go Further
I encourage you to read the complete analyses of ServiceTitan, Inc. and Asana, Inc. to enhance your investment decisions: