Home > Comparison > Technology > NOW vs WDAY
The strategic rivalry between ServiceNow, Inc. and Workday, Inc. defines the current trajectory of enterprise software innovation. ServiceNow operates as a workflow automation powerhouse, while Workday excels in cloud-based financial and human capital management solutions. This head-to-head reflects a broader contest between platform scalability and specialized application depth. This analysis will reveal which company offers superior risk-adjusted returns for a diversified portfolio navigating the evolving technology landscape.
Table of contents
Companies Overview
ServiceNow and Workday stand as pivotal players in enterprise cloud software, shaping business workflows and operations globally.
ServiceNow, Inc.: Workflow Automation Leader
ServiceNow dominates enterprise cloud computing with its Now platform, automating workflows across IT, HR, security, and customer service. Its core revenue stems from subscription-based software that integrates AI, machine learning, and robotic process automation. In 2026, ServiceNow focuses on expanding automation capabilities and deepening strategic partnerships to enhance process efficiency for diverse industries.
Workday, Inc.: Human Capital and Financial Management Specialist
Workday provides enterprise cloud applications centered on financial management and human capital management (HCM). Its revenue relies on subscription fees for software that streamlines accounting, workforce management, and spend control. The company prioritizes augmented analytics, machine learning, and expanding its financial and HR suites to deliver actionable insights and streamline operations in 2026.
Strategic Collision: Similarities & Divergences
Both companies offer cloud-based enterprise applications but diverge in focus: ServiceNow emphasizes broad workflow automation while Workday zeroes in on financial and human capital processes. They compete primarily in the enterprise software market, targeting overlapping clients seeking operational efficiency. ServiceNow’s broad automation platform contrasts with Workday’s specialized suites, resulting in distinct investment profiles driven by different growth vectors and market positioning.
Income Statement Comparison
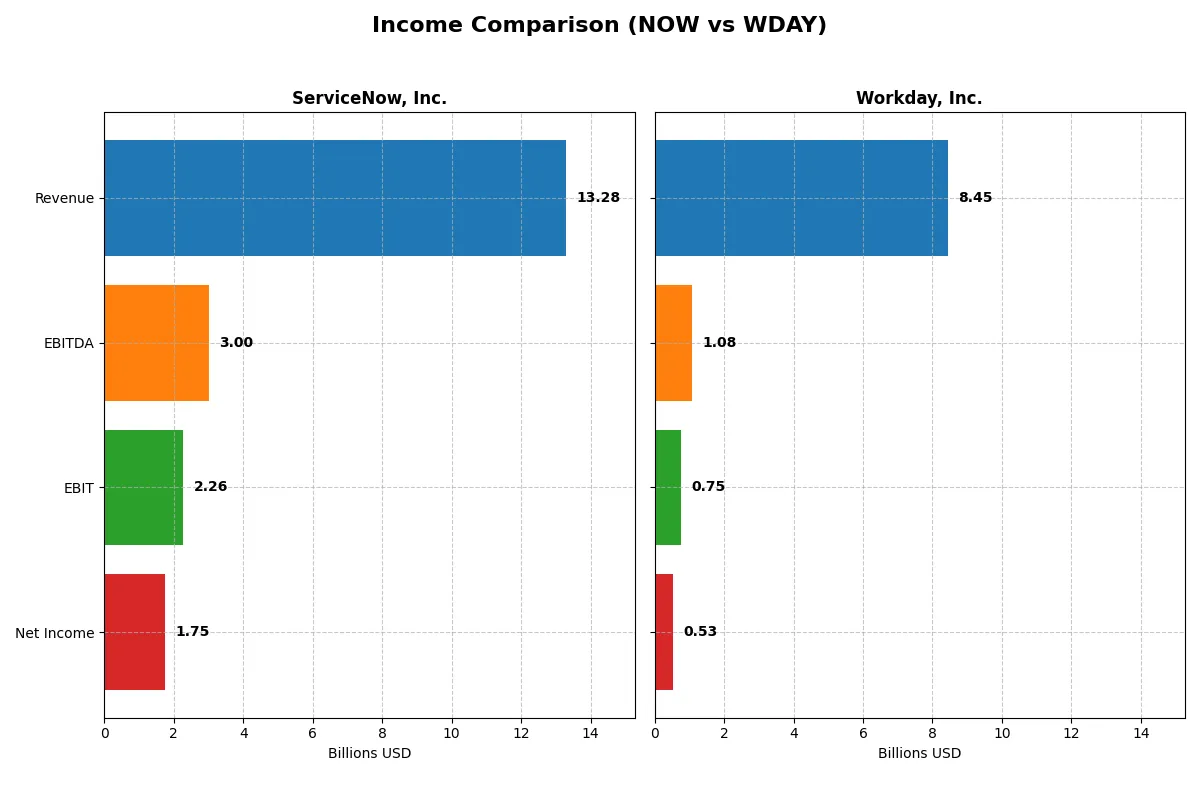
This data dissects the core profitability and scalability of both corporate engines to reveal who dominates the bottom line:
| Metric | ServiceNow, Inc. (NOW) | Workday, Inc. (WDAY) |
|---|---|---|
| Revenue | 13.3B | 8.4B |
| Cost of Revenue | 3.0B | 2.1B |
| Operating Expenses | 8.5B | 6.0B |
| Gross Profit | 10.3B | 6.4B |
| EBITDA | 3.0B | 1.1B |
| EBIT | 2.3B | 752M |
| Interest Expense | 0 | 114M |
| Net Income | 1.7B | 526M |
| EPS | 1.69 | 1.98 |
| Fiscal Year | 2025 | 2025 |
Income Statement Analysis: The Bottom-Line Duel
This income statement comparison exposes the true efficiency and profitability of two leading cloud software companies in 2025.
ServiceNow, Inc. Analysis
ServiceNow posts robust revenue growth, reaching $13.3B in 2025, up 21% year-over-year. Its net income climbs to $1.75B, reflecting strong operational leverage. Gross margin holds at a healthy 77.5%, while net margin stands at 13.2%, signaling disciplined cost control and expanding profitability momentum.
Workday, Inc. Analysis
Workday grows revenue 16% to $8.45B in fiscal 2025, maintaining solid top-line momentum. Gross margin at 75.5% remains favorable, but net margin compresses to 6.2%, impacted by rising interest expense and less efficient bottom-line conversion despite 60% EBIT growth.
Verdict: Margin Power vs. Revenue Scale
ServiceNow clearly outpaces Workday in scale and margin efficiency, delivering superior net income and margin expansion. Workday’s higher EBIT growth is offset by weaker net margin and EPS declines. Investors seeking durable profitability and margin strength will find ServiceNow’s profile more compelling.
Financial Ratios Comparison
These vital ratios act as a diagnostic tool to expose the underlying fiscal health, valuation premiums, and capital efficiency of the companies compared:
| Ratios | ServiceNow, Inc. (NOW) | Workday, Inc. (WDAY) |
|---|---|---|
| ROE | 13.48% | 5.82% |
| ROIC | 8.98% | 2.73% |
| P/E | 90.88 | 132.15 |
| P/B | 12.25 | 7.69 |
| Current Ratio | 0.95 | 1.85 |
| Quick Ratio | 0.95 | 1.85 |
| D/E | 0.25 | 0.37 |
| Debt-to-Assets | 12.30% | 18.70% |
| Interest Coverage | 0 | 3.64 |
| Asset Turnover | 0.51 | 0.47 |
| Fixed Asset Turnover | 4.29 | 5.36 |
| Payout ratio | 0 | 0 |
| Dividend yield | 0 | 0 |
| Fiscal Year | 2025 | 2025 |
Efficiency & Valuation Duel: The Vital Signs
Financial ratios form the company’s DNA, uncovering hidden risks and showcasing operational strengths invisible in raw numbers alone.
ServiceNow, Inc.
ServiceNow reveals solid profitability with a 13.48% ROE and a favorable 13.16% net margin, but trades at a stretched P/E of 90.88. The stock’s valuation appears expensive, reflecting high growth expectations. It returns no dividend, instead reinvesting heavily in R&D, fueling innovation and long-term expansion.
Workday, Inc.
Workday posts lower profitability (5.82% ROE, 6.23% net margin) and faces an even higher P/E of 132.15, signaling a stretched valuation. Despite weaker returns, Workday maintains a strong liquidity position with a 1.85 current ratio. It also eschews dividends, focusing on growth through substantial R&D spending.
Premium Valuation vs. Operational Safety
ServiceNow offers superior profitability but comes at a high valuation risk, while Workday trades even higher relative to earnings despite weaker returns. ServiceNow’s profile fits investors seeking growth with operational strength, whereas Workday suits those prioritizing liquidity and reinvestment potential despite valuation stretch.
Which one offers the Superior Shareholder Reward?
I observe that both ServiceNow (NOW) and Workday (WDAY) do not pay dividends, focusing instead on reinvestment and buybacks. NOW’s free cash flow per share stands at $4.41 with a high payout ratio of zero, while WDAY’s FCF per share is $8.25, also with no dividend payout. NOW’s share buyback activity is modest but consistent, enhancing shareholder value prudently. WDAY exhibits a more aggressive buyback and reinvestment strategy, supported by strong free cash flow and a lower price-to-free cash flow ratio (31.8x vs. NOW’s 34.7x in 2025). However, NOW’s higher operating margins (EBIT margin ~17% vs. WDAY’s 9%) suggest more efficient capital allocation. Considering sustainability and valuation, I find NOW offers a more balanced, reliable total return profile, while WDAY’s aggressive growth may carry higher risk. For 2026, I prefer NOW for superior shareholder reward with disciplined capital deployment.
Comparative Score Analysis: The Strategic Profile
This radar chart reveals the fundamental DNA and trade-offs of ServiceNow and Workday through key financial metrics:
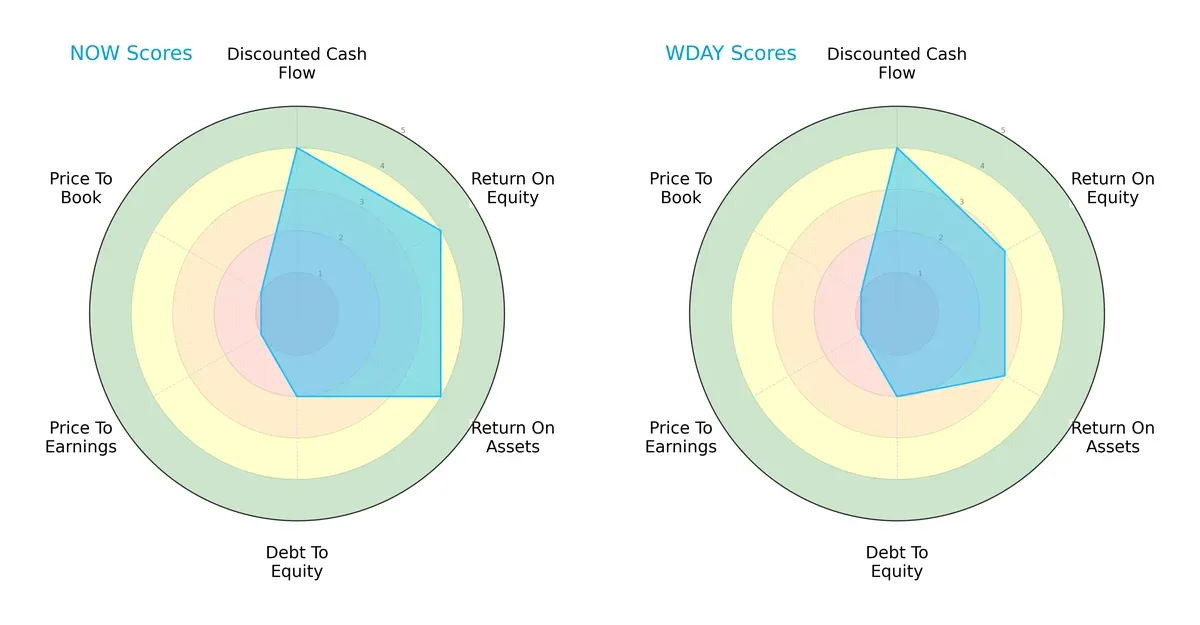
ServiceNow leads with stronger returns (ROE 4 vs. 3, ROA 4 vs. 3) and a more balanced DCF score (4 each). Both share identical moderate debt-to-equity risk (2) and very weak valuation scores (P/E and P/B at 1). ServiceNow shows a more balanced profile, while Workday relies more heavily on cash flow projection strength.
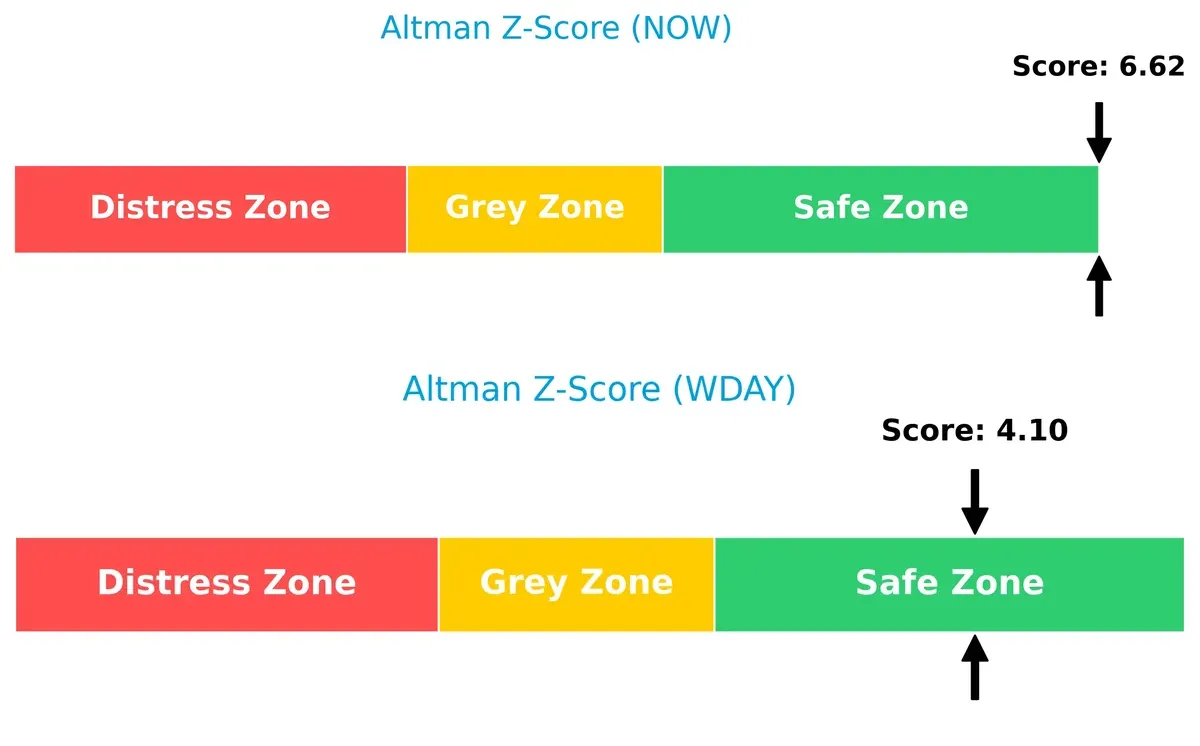
Bankruptcy Risk: Solvency Showdown
ServiceNow’s Altman Z-Score of 6.62 versus Workday’s 4.10 places both safely above distress, but ServiceNow’s superior buffer better insulates it from cyclical shocks:
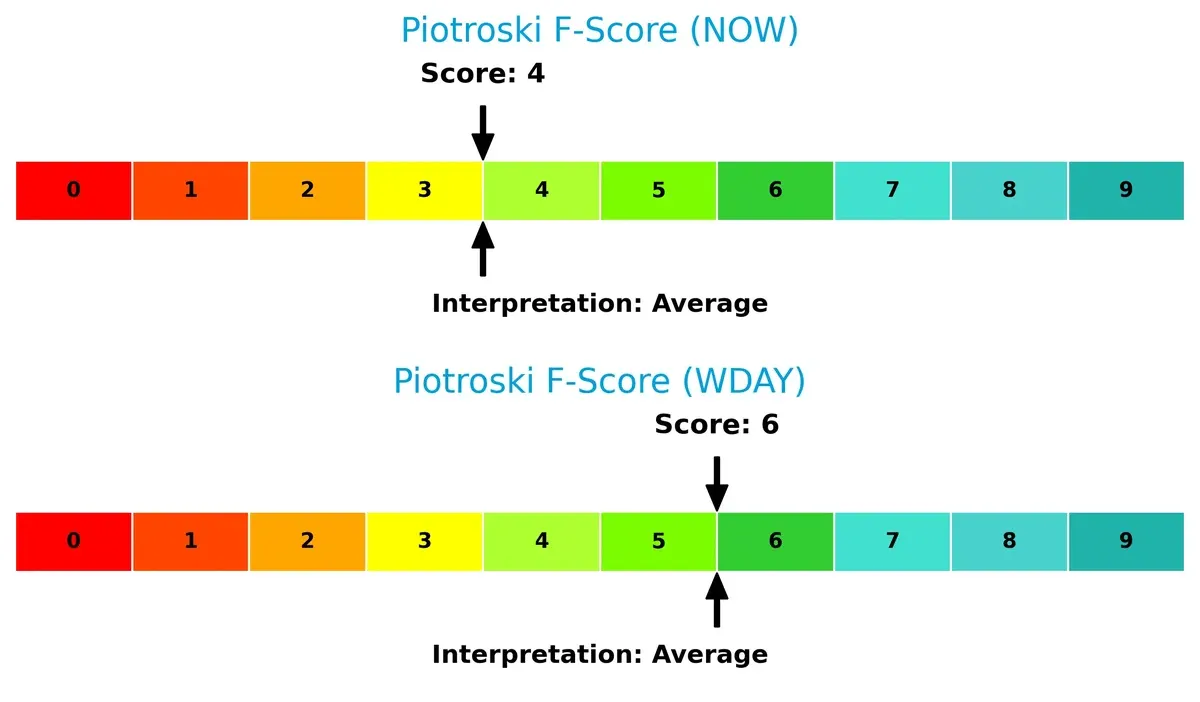
Financial Health: Quality of Operations
Workday’s Piotroski score of 6 outperforms ServiceNow’s 4, signaling stronger internal financial health and fewer red flags in operational metrics despite ServiceNow’s higher returns:
How are the two companies positioned?
This section dissects the operational DNA of ServiceNow and Workday by comparing revenue distribution and internal strengths and weaknesses. The goal is to confront their economic moats and reveal which business model offers the most resilient competitive advantage today.
Revenue Segmentation: The Strategic Mix
This comparison dissects how ServiceNow and Workday diversify their income streams and highlights their primary sector bets:
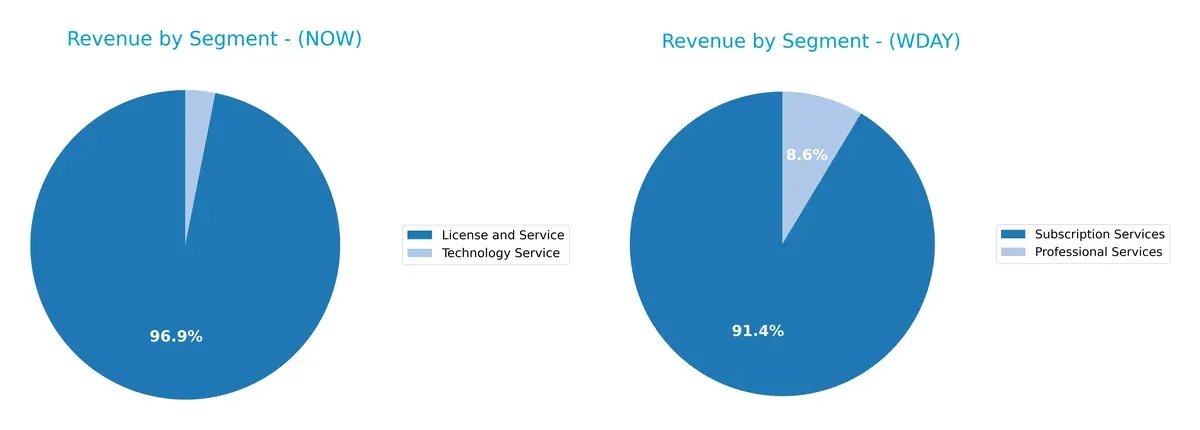
ServiceNow’s revenue in 2025 anchors heavily on License and Service at $12.9B, with minimal Technology Service at $414M, showing strong concentration in digital workflow solutions. Workday’s $7.7B subscription base dwarfs its $728M professional services, but still presents a more balanced split. ServiceNow’s focus signals ecosystem lock-in with less diversification risk, while Workday’s mixed model supports steady recurring revenue with service upsell potential.
Strengths and Weaknesses Comparison
This table compares the Strengths and Weaknesses of ServiceNow, Inc. and Workday, Inc.:
ServiceNow Strengths
- Higher net margin at 13.16% indicating better profitability
- Favorable debt metrics with low debt-to-assets at 12.3%
- Strong fixed asset turnover at 4.29 reflecting efficient asset use
- Larger revenue base including diversified product lines in digital workflow and ITOM
- Extensive global presence with strong North America and EMEA sales
Workday Strengths
- Favorable current and quick ratios above 1.8 showing strong liquidity
- Favorable interest coverage at 6.6 indicating solid ability to service debt
- Higher fixed asset turnover at 5.36 signaling efficient capital use
- Significant revenue from subscription services and professional services
- Global footprint with substantial US and Non-US revenue contributions
ServiceNow Weaknesses
- Unfavorable valuation multiples with PE at 90.88 and PB at 12.25
- Low current ratio below 1 posing liquidity risk
- Zero dividend yield may deter income-focused investors
- Neutral ROIC close to WACC limits value creation
- Neutral asset turnover at 0.51 suggesting moderate operational efficiency
Workday Weaknesses
- Lower profitability metrics with net margin at 6.23% and ROE at 5.82%
- Unfavorable valuation multiples with PE at 132.15 and PB at 7.69
- Unfavorable ROIC at 2.73% below WACC indicates weak capital efficiency
- Unfavorable asset turnover at 0.47 reflects less efficient asset use
- Zero dividend yield and higher debt-to-assets at 18.7% increase financial risk
ServiceNow exhibits stronger profitability and efficient asset use, but its high valuation and liquidity pose concerns. Workday shows better liquidity and capital efficiency but struggles with profitability and valuation metrics. Both must address these factors to optimize long-term strategy.
The Moat Duel: Analyzing Competitive Defensibility
A structural moat is the only reliable shield protecting long-term profits from relentless competitive erosion in software markets:
ServiceNow, Inc.: Workflow Automation Switching Costs
ServiceNow’s moat stems from deep switching costs embedded in enterprise workflow automation. Its robust 17% EBIT margin and 77.5% gross margin confirm margin stability. Expansion into AI-driven automation in 2026 could deepen this moat.
Workday, Inc.: Integrated Human Capital & Financial Management
Workday’s moat relies on integrated HCM and financial suites, creating ecosystem lock-in distinct from ServiceNow’s focus. Despite weaker margins (8.9% EBIT), its accelerating ROIC trend signals improving value creation and growth opportunities.
Workflow Automation vs. Ecosystem Integration: The Moat Face-Off
ServiceNow boasts a wider moat with stronger margin profiles and higher absolute ROIC, while Workday’s moat remains narrower but is gaining depth through platform integration and product expansion. ServiceNow is better positioned to defend market share amid intensifying competition.
Which stock offers better returns?
Over the past year, both ServiceNow and Workday experienced significant price declines, with decelerating bearish trends and dominant selling pressure shaping their trading dynamics.
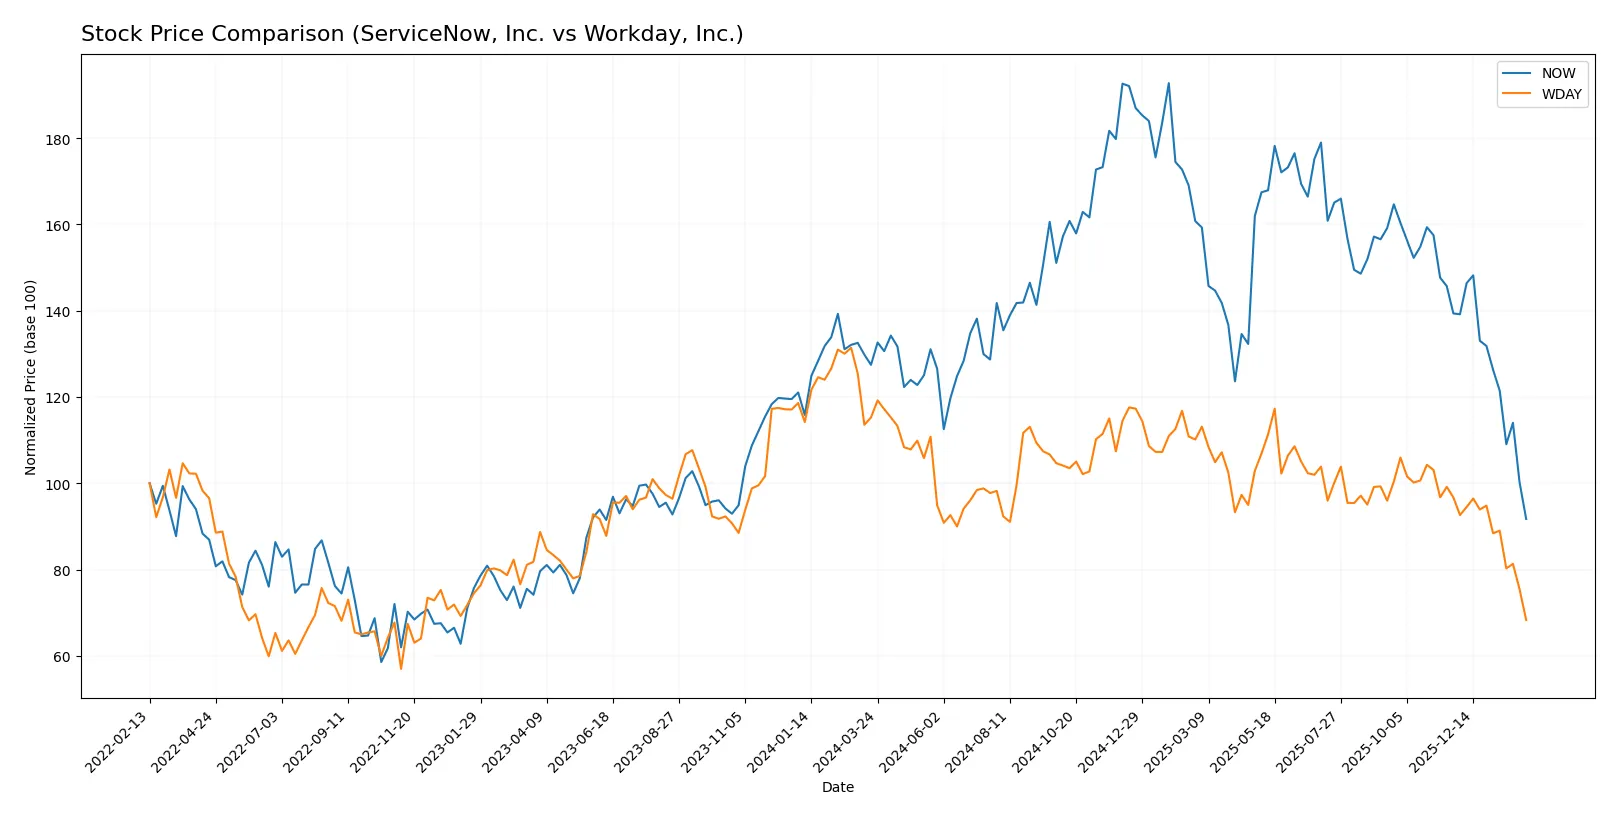
Trend Comparison
ServiceNow, Inc. shows a 28.02% price drop over 12 months, confirming a bearish trend with decelerating momentum and volatility at 25.15%. The stock peaked at 225.0 and bottomed at 107.09.
Workday, Inc. declined 40.73% in the same period, also bearish with decelerating trend acceleration. Volatility measures 21.63%, with a high of 277.5 and a low of 159.0.
Comparing trends, ServiceNow’s smaller decline indicates better relative market performance versus Workday over the past year.
Target Prices
Analysts present mixed but generally optimistic target price consensus for ServiceNow, Inc. and Workday, Inc.
| Company | Target Low | Target High | Consensus |
|---|---|---|---|
| ServiceNow, Inc. | 115 | 1315 | 440.64 |
| Workday, Inc. | 200 | 320 | 272.41 |
The target consensus for ServiceNow suggests a significant upside from the current price of 106.51, reflecting bullish expectations despite a wide range. Workday’s target consensus at 272.41 also indicates potential appreciation from its current 157.24 price, signaling favorable analyst outlooks.

Don’t Let Luck Decide Your Entry Point
Optimize your entry points with our advanced ProRealTime indicators. You’ll get efficient buy signals with precise price targets for maximum performance. Start outperforming now!
How do institutions grade them?
ServiceNow, Inc. Grades
Here are the latest grades assigned by recognized financial institutions for ServiceNow, Inc.:
| Grading Company | Action | New Grade | Date |
|---|---|---|---|
| Citigroup | Maintain | Buy | 2026-01-30 |
| Evercore ISI Group | Maintain | Outperform | 2026-01-29 |
| Macquarie | Maintain | Neutral | 2026-01-29 |
| BTIG | Maintain | Buy | 2026-01-29 |
| RBC Capital | Maintain | Outperform | 2026-01-29 |
| Keybanc | Maintain | Underweight | 2026-01-29 |
| Stifel | Maintain | Buy | 2026-01-29 |
| DA Davidson | Maintain | Buy | 2026-01-29 |
| Cantor Fitzgerald | Maintain | Overweight | 2026-01-29 |
| Needham | Maintain | Buy | 2026-01-29 |
Workday, Inc. Grades
The following table summarizes recent grades given by reputable institutions for Workday, Inc.:
| Grading Company | Action | New Grade | Date |
|---|---|---|---|
| Piper Sandler | Maintain | Neutral | 2026-02-03 |
| Barclays | Maintain | Overweight | 2026-01-12 |
| RBC Capital | Maintain | Outperform | 2026-01-05 |
| TD Cowen | Maintain | Buy | 2025-11-26 |
| Needham | Maintain | Buy | 2025-11-26 |
| Wells Fargo | Maintain | Overweight | 2025-11-26 |
| JP Morgan | Maintain | Overweight | 2025-11-26 |
| Morgan Stanley | Maintain | Equal Weight | 2025-11-26 |
| Guggenheim | Maintain | Buy | 2025-11-26 |
| RBC Capital | Maintain | Outperform | 2025-11-26 |
Which company has the best grades?
ServiceNow has a higher frequency of “Buy” and “Outperform” grades compared to Workday, which shows more “Overweight” and “Neutral” ratings. This suggests stronger analyst confidence in ServiceNow’s near-term prospects. Investors may view ServiceNow’s grades as reflecting greater optimism.
Risks specific to each company
In today’s volatile 2026 market, these categories identify critical pressure points and systemic threats facing both firms:
1. Market & Competition
ServiceNow, Inc.
- Strong market position with strategic partnerships, but faces pricing pressure from competitors.
Workday, Inc.
- Faces intense competition in cloud applications, with slower margin expansion than peers.
2. Capital Structure & Debt
ServiceNow, Inc.
- Low debt-to-equity ratio (0.25) signals prudent leverage and strong interest coverage (infinite).
Workday, Inc.
- Higher debt-to-equity (0.37) but still manageable; interest coverage at 6.6 remains comfortable.
3. Stock Volatility
ServiceNow, Inc.
- Beta near 1 (0.978) indicates stock moves roughly with the market, implying moderate volatility.
Workday, Inc.
- Higher beta (1.124) suggests greater sensitivity to market swings, increasing risk.
4. Regulatory & Legal
ServiceNow, Inc.
- Operates globally with exposure to data privacy regulations; no major legal issues reported.
Workday, Inc.
- Similar regulatory environment; compliance costs could rise with expanding international footprint.
5. Supply Chain & Operations
ServiceNow, Inc.
- Dependence on cloud infrastructure partners creates operational risk but benefits from scale.
Workday, Inc.
- Cloud-based delivery reduces physical supply chain risks but relies heavily on data center providers.
6. ESG & Climate Transition
ServiceNow, Inc.
- Increasing focus on sustainable IT practices; improving ESG disclosures but room to grow.
Workday, Inc.
- ESG initiatives advancing; stronger emphasis on social and governance factors amid investor scrutiny.
7. Geopolitical Exposure
ServiceNow, Inc.
- Moderate exposure through global client base; risks from US-China tensions on tech exports.
Workday, Inc.
- Similar geographic risks; potential impact from trade policy shifts on software services.
Which company shows a better risk-adjusted profile?
ServiceNow’s strongest risk is its stretched valuation, with a P/E exceeding 90, raising concerns about downside if growth slows. Workday struggles with weaker profitability and higher stock volatility, reflecting execution risks. Despite these, ServiceNow’s conservative leverage and stable market position give it a slightly better risk-adjusted profile. Its Altman Z-Score above 6 confirms solid financial health, while Workday’s higher beta and lower returns signal elevated risk. Investors should watch ServiceNow’s valuation compression and Workday’s margin trends closely.
Final Verdict: Which stock to choose?
ServiceNow’s superpower lies in its robust income growth and steadily improving profitability, signaling efficiency in capital allocation. Its point of vigilance is a current ratio just below 1, hinting at liquidity constraints that require monitoring. It suits portfolios aiming for aggressive growth backed by operational momentum.
Workday’s strategic moat is its high current ratio and solid balance sheet, offering a cushion against market volatility. Though its returns trail ServiceNow’s, it provides better liquidity and a more conservative risk profile. This makes it attractive for investors seeking growth at a reasonable price with a safety margin.
If you prioritize aggressive growth with improving profitability, ServiceNow outshines due to its income momentum and capital efficiency. However, if you seek a safer growth play with stronger liquidity, Workday offers better stability despite lower return metrics. Both present analytical scenarios depending on risk tolerance and portfolio goals.
Disclaimer: Investment carries a risk of loss of initial capital. The past performance is not a reliable indicator of future results. Be sure to understand risks before making an investment decision.
Go Further
I encourage you to read the complete analyses of ServiceNow, Inc. and Workday, Inc. to enhance your investment decisions: