Home > Comparison > Technology > NOW vs U
The strategic rivalry between ServiceNow, Inc. and Unity Software Inc. shapes the evolution of the technology sector’s software application landscape. ServiceNow operates as a capital-intensive enterprise cloud solutions provider focused on workflow automation, while Unity delivers a high-growth interactive 3D content platform specializing in real-time visualization. This analysis pits enterprise scalability against innovative content creation to identify the superior risk-adjusted investment outlook for diversified portfolios in 2026.
Table of contents
Companies Overview
ServiceNow and Unity Software stand as pivotal players redefining software application markets globally.
ServiceNow, Inc.: Enterprise Workflow Automation Leader
ServiceNow dominates the enterprise cloud computing space with its Now platform, which automates workflows using AI, machine learning, and robotic process automation. It generates revenue by providing IT service management, business operations, and security products. In 2026, its strategic focus remains on expanding automation capabilities and deepening partnerships to streamline complex enterprise processes.
Unity Software Inc.: Real-Time 3D Content Platform Pioneer
Unity Software commands the interactive 3D content market by delivering a real-time 2D and 3D creation platform for developers across gaming, AR, and VR sectors. Its revenue comes from licensing and monetizing software solutions worldwide. In 2026, Unity prioritizes enhancing its platform’s scalability and monetization tools to support a growing community of creators and enterprises.
Strategic Collision: Similarities & Divergences
ServiceNow and Unity both emphasize software innovation but diverge sharply in approach. ServiceNow focuses on enterprise workflow automation within a closed ecosystem, while Unity champions an open, developer-centric platform for real-time content creation. Their primary battleground is digital transformation—workflow automation versus interactive content generation. Investors face contrasting profiles: ServiceNow offers stability with steady enterprise demand, Unity carries higher volatility tied to creative platform adoption.
Income Statement Comparison
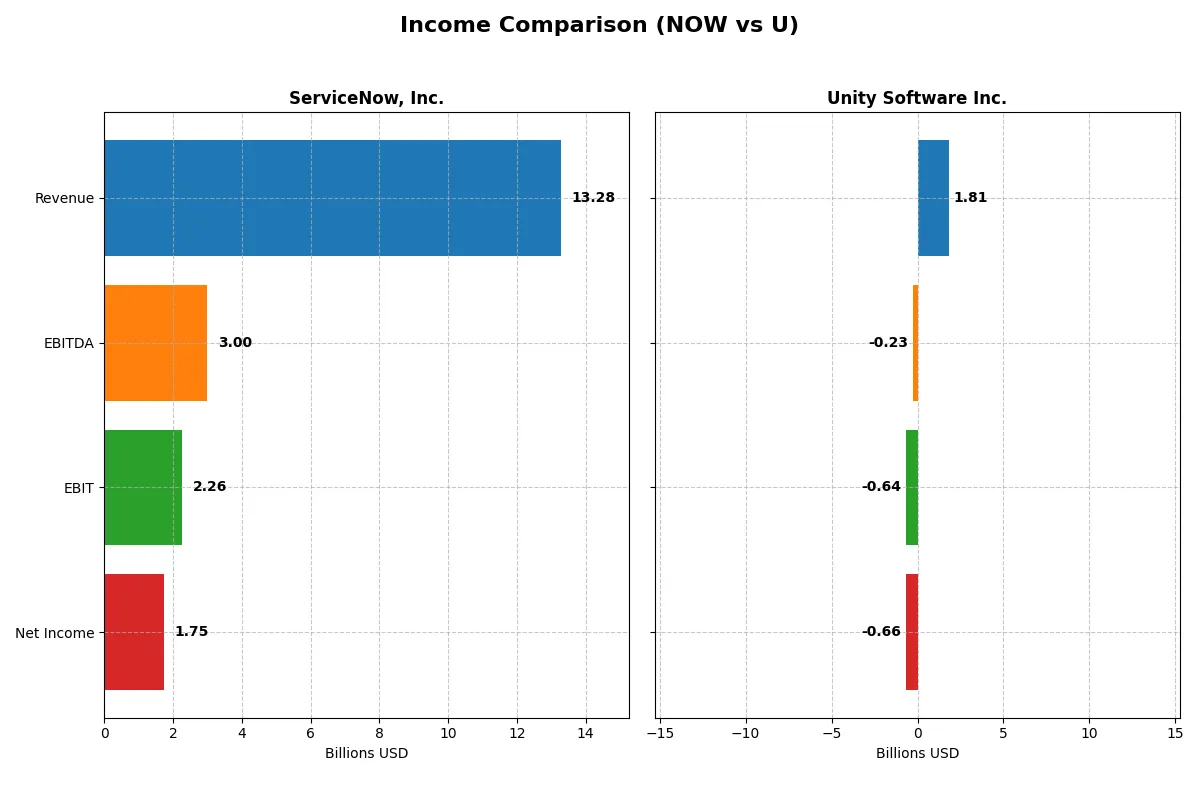
The following data dissects the core profitability and scalability of both corporate engines to reveal who dominates the bottom line:
| Metric | ServiceNow, Inc. (NOW) | Unity Software Inc. (U) |
|---|---|---|
| Revenue | 13.3B | 1.8B |
| Cost of Revenue | 3.0B | 481M |
| Operating Expenses | 8.5B | 2.1B |
| Gross Profit | 10.3B | 1.3B |
| EBITDA | 3.0B | -235M |
| EBIT | 2.3B | -644M |
| Interest Expense | 0 | 23.5M |
| Net Income | 1.7B | -664M |
| EPS | 1.69 | -1.68 |
| Fiscal Year | 2025 | 2024 |
Income Statement Analysis: The Bottom-Line Duel
This income statement comparison uncovers which company drives superior operational efficiency and profitability through its revenue engine.
ServiceNow, Inc. Analysis
ServiceNow posts a strong upward trajectory, with revenue surging from 5.9B in 2021 to 13.3B in 2025. Net income soared from 230M to 1.75B over the same span. Its gross margin remains robust at 77.5%, signaling excellent cost control. The 2025 net margin of 13.2% and EBIT margin of 17% highlight sustained profitability momentum.
Unity Software Inc. Analysis
Unity’s revenue grew from 772M in 2020 to 2.18B in 2023 but dropped to 1.81B in 2024. Net losses widened overall, with a 2024 net loss of 664M despite a slightly improved EBIT and EPS growth. Its gross margin is healthy at 73.5%, yet negative EBIT and net margins around -36% reflect ongoing operational challenges and poor cost absorption.
Margin Strength vs. Growth Challenges
ServiceNow delivers consistent margin expansion and strong profit growth, demonstrating mastery in scaling efficiently. Unity shows revenue volatility and persistent losses despite top-line expansion. For investors, ServiceNow’s profile offers a proven, profitable growth engine, while Unity’s remains a turnaround story with elevated risk.
Financial Ratios Comparison
These vital ratios act as a diagnostic tool to expose the underlying fiscal health, valuation premiums, and capital efficiency of these companies:
| Ratios | ServiceNow, Inc. (NOW) | Unity Software Inc. (U) |
|---|---|---|
| ROE | 13.5% | -20.8% |
| ROIC | 9.0% | -12.8% |
| P/E | 90.9 | -13.4 |
| P/B | 12.3 | 2.8 |
| Current Ratio | 0.95 | 2.50 |
| Quick Ratio | 0.95 | 2.50 |
| D/E | 0.25 | 0.74 |
| Debt-to-Assets | 12.3% | 34.9% |
| Interest Coverage | 0 | -32.1 |
| Asset Turnover | 0.51 | 0.27 |
| Fixed Asset Turnover | 4.29 | 18.35 |
| Payout Ratio | 0 | 0 |
| Dividend Yield | 0% | 0% |
| Fiscal Year | 2025 | 2024 |
Efficiency & Valuation Duel: The Vital Signs
Ratios serve as a company’s DNA, exposing hidden risks and operational strengths that raw numbers often conceal.
ServiceNow, Inc.
ServiceNow maintains a solid 13.5% ROE and an efficient net margin of 13.16%, signaling operational strength. However, its P/E ratio of 90.9 marks the stock as highly stretched and expensive. The company returns no dividends, instead reinvesting heavily in R&D, supporting sustained growth and innovation.
Unity Software Inc.
Unity shows deeply negative profitability with a -20.8% ROE and -36.6% net margin, reflecting ongoing losses. Yet, its low P/E of -13.4 and moderate P/B of 2.79 suggest valuation is not stretched. Unity’s strategy focuses on R&D investment over dividends, aiming to build future competitive advantages despite current challenges.
Premium Valuation vs. Operational Struggles
ServiceNow offers operational efficiency but trades at a premium, increasing investment risk. Unity faces profitability headwinds but carries a more conservative valuation. Investors seeking stability may prefer ServiceNow’s track record, while those tolerant of risk might consider Unity’s growth-oriented profile.
Which one offers the Superior Shareholder Reward?
ServiceNow and Unity Software both forgo dividends, focusing on reinvestment and buybacks. ServiceNow delivers a strong free cash flow yield and steady buybacks, supporting sustainable shareholder value. Unity’s negative earnings and weak margins limit buyback capacity. I find ServiceNow’s disciplined cash return strategy superior for total returns in 2026.
Comparative Score Analysis: The Strategic Profile
The radar chart reveals the fundamental DNA and trade-offs of ServiceNow, Inc. and Unity Software Inc., highlighting their financial strengths and vulnerabilities:
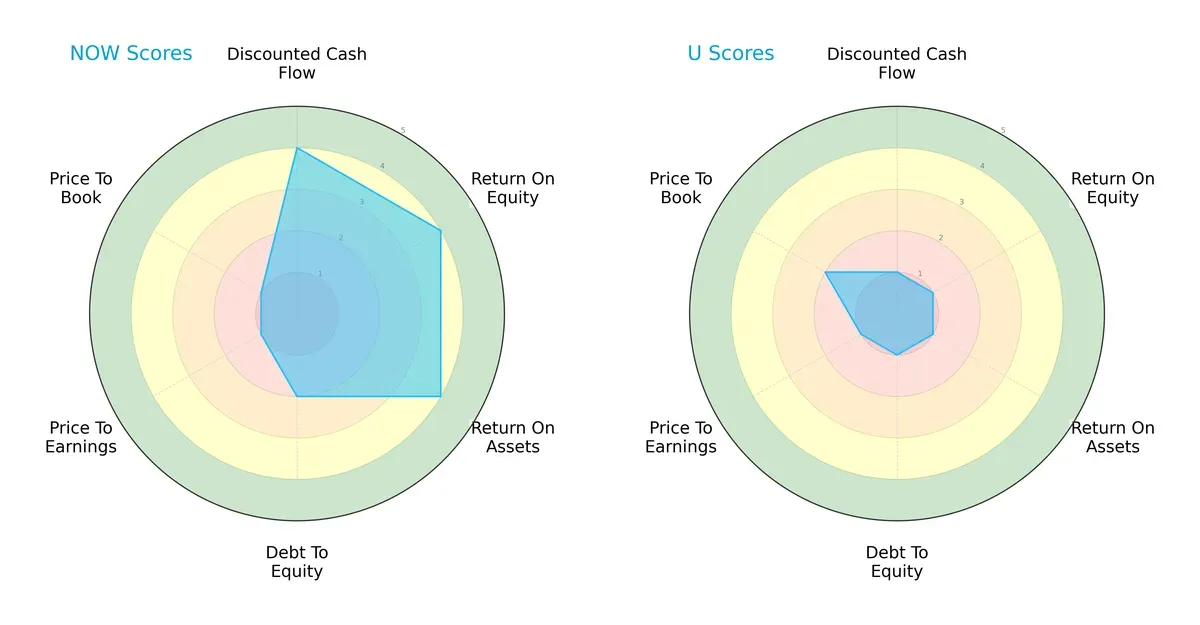
ServiceNow delivers a balanced profile with strong DCF, ROE, and ROA scores, signaling efficient capital allocation and asset use. Its moderate debt-to-equity score indicates manageable leverage, but its valuation metrics (P/E and P/B) suffer, suggesting potential overpricing. Unity, conversely, shows uniformly weak scores, reflecting operational and financial challenges. Its slight edge in price-to-book remains insufficient to offset deep weaknesses. ServiceNow clearly dominates with a more resilient and diversified financial foundation.
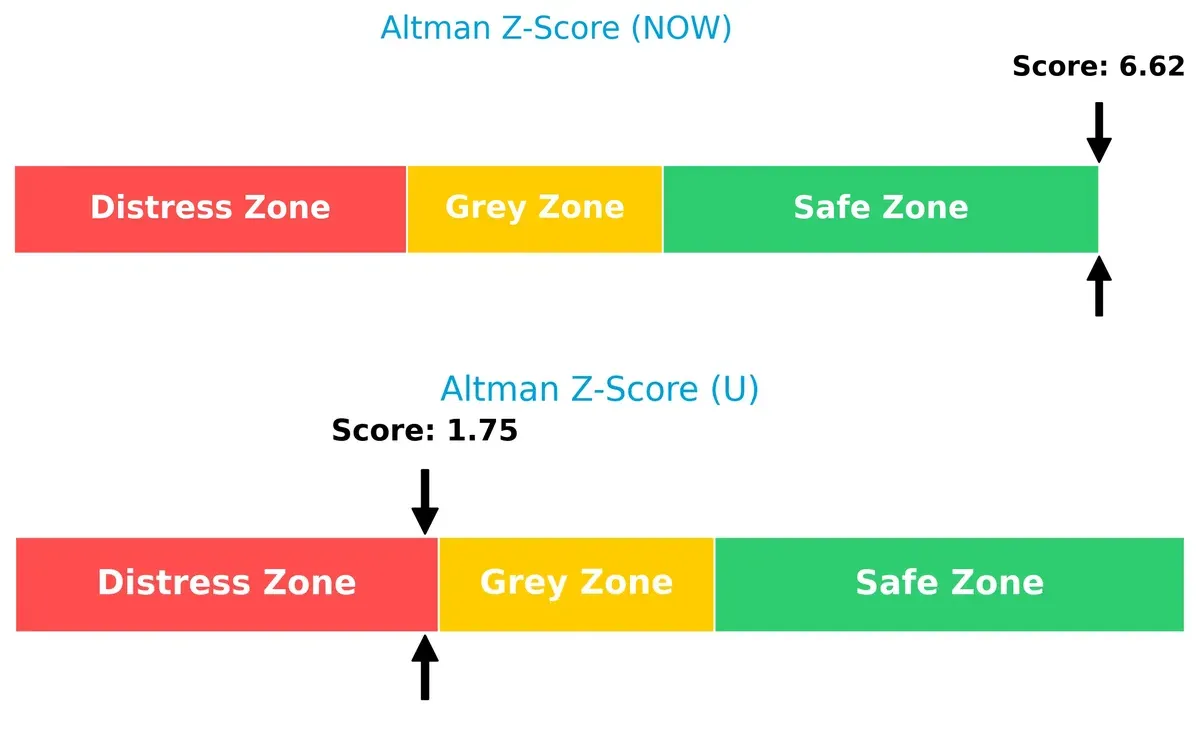
Bankruptcy Risk: Solvency Showdown
ServiceNow’s Altman Z-Score of 6.6 places it comfortably in the safe zone, underscoring robust long-term solvency. Unity’s 1.75 score lands in the distress zone, warning of significant bankruptcy risk if conditions worsen:
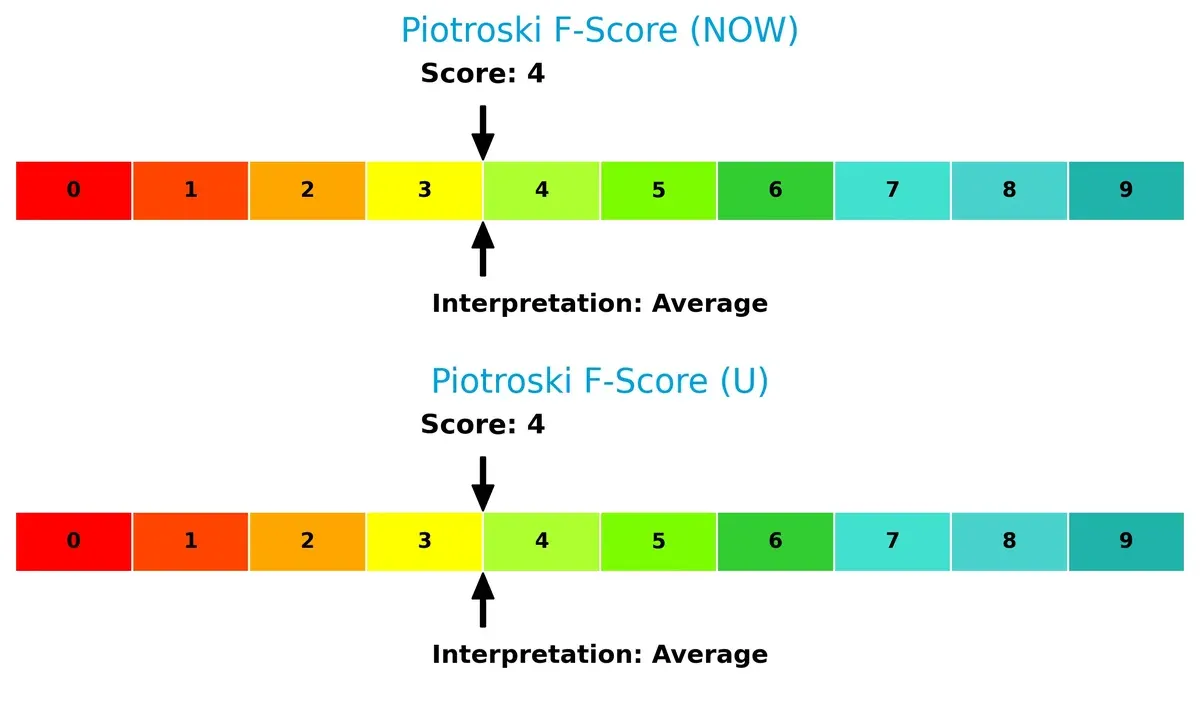
Financial Health: Quality of Operations
Both firms share an average Piotroski F-Score of 4 out of 9, indicating moderate operational health. Neither shows peak financial strength, but Unity’s overall weaker rating compounds concerns about its internal financial metrics:
How are the two companies positioned?
This section dissects the operational DNA of ServiceNow and Unity by comparing their revenue distribution and internal strengths and weaknesses. The goal is to confront their economic moats and identify which model offers the most resilient, sustainable advantage today.
Revenue Segmentation: The Strategic Mix
This visual comparison dissects how ServiceNow and Unity diversify their income streams and where their primary sector bets lie:
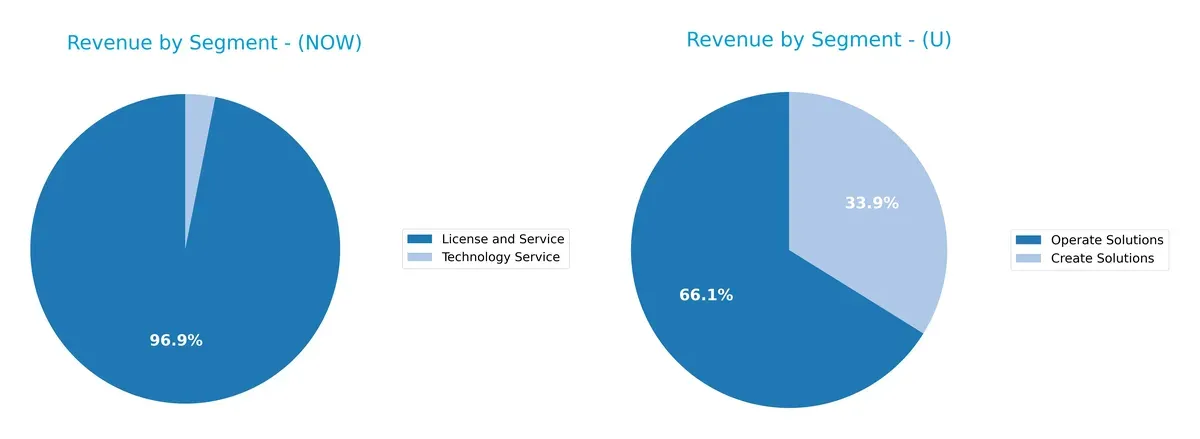
ServiceNow’s revenue anchors heavily on its License and Service segment, with $12.9B in 2025 dwarfing its $414M Technology Service. Unity shows a more balanced split, earning $1.2B from Operate Solutions and $614M from Create Solutions in 2024. ServiceNow’s concentration signals strong ecosystem lock-in but higher concentration risk. Unity’s balanced mix suggests strategic flexibility across creation and operation platforms.
Strengths and Weaknesses Comparison
This table compares the Strengths and Weaknesses of ServiceNow, Inc. (NOW) and Unity Software Inc. (U):
NOW Strengths
- Strong global presence in North America, EMEA, Asia Pacific
- Favorable net margin at 13.16%
- Low debt-to-assets at 12.3%
- High fixed asset turnover at 4.29
- Diversified revenue with License and Service segments
U Strengths
- Favorable current and quick ratios at 2.5 indicating liquidity strength
- High fixed asset turnover at 18.35
- Diversified product revenue between Create and Operate Solutions
- Moderate price-to-book ratio at 2.79
- Global revenue presence including US, EMEA, Asia Pacific
NOW Weaknesses
- Unfavorable valuation metrics with PE at 90.88 and PB at 12.25
- Current ratio below 1 at 0.95 signals liquidity risk
- Zero dividend yield
- Neutral ROIC close to WACC at 8.98% vs 8.31%
- Neutral asset turnover at 0.51
U Weaknesses
- Negative profitability metrics: net margin -36.63%, ROE -20.81%, ROIC -12.78%
- Unfavorable interest coverage at -27.34
- Higher debt-to-assets at 34.94%
- Unfavorable asset turnover at 0.27
- Zero dividend yield
Both companies show diverse revenue streams and global footprints, but NOW demonstrates healthier profitability and balance sheet metrics. U faces significant profitability and liquidity challenges, which could impact its strategic flexibility.
The Moat Duel: Analyzing Competitive Defensibility
A structural moat is the only reliable shield that protects long-term profits from relentless competitive erosion in dynamic markets:
ServiceNow, Inc.: Workflow Automation’s Switching Cost Fortress
ServiceNow leverages high switching costs rooted in enterprise workflow integration. Its 17% EBIT margin and growing ROIC demonstrate margin stability and efficient capital use. Expanding AI-driven automation in 2026 could deepen its moat further.
Unity Software Inc.: Innovation in Real-Time 3D Content Creation
Unity competes on platform innovation and network effects, unlike ServiceNow’s switching cost moat. However, its negative EBIT margin and declining ROIC reflect weak profitability and value destruction. New AR/VR markets offer upside but carry execution risks.
Switching Costs vs. Innovation Platform: Sustaining Profitability Under Pressure
ServiceNow’s wider moat stems from entrenched switching costs and improving ROIC, positioning it better to defend market share. Unity’s innovation moat remains fragile amid profitability challenges and fierce competition in evolving 3D content markets.
Which stock offers better returns?
Over the past year, both stocks declined, with notable price drops and decelerating trends. ServiceNow experienced wide volatility, while Unity showed a more moderate price range.
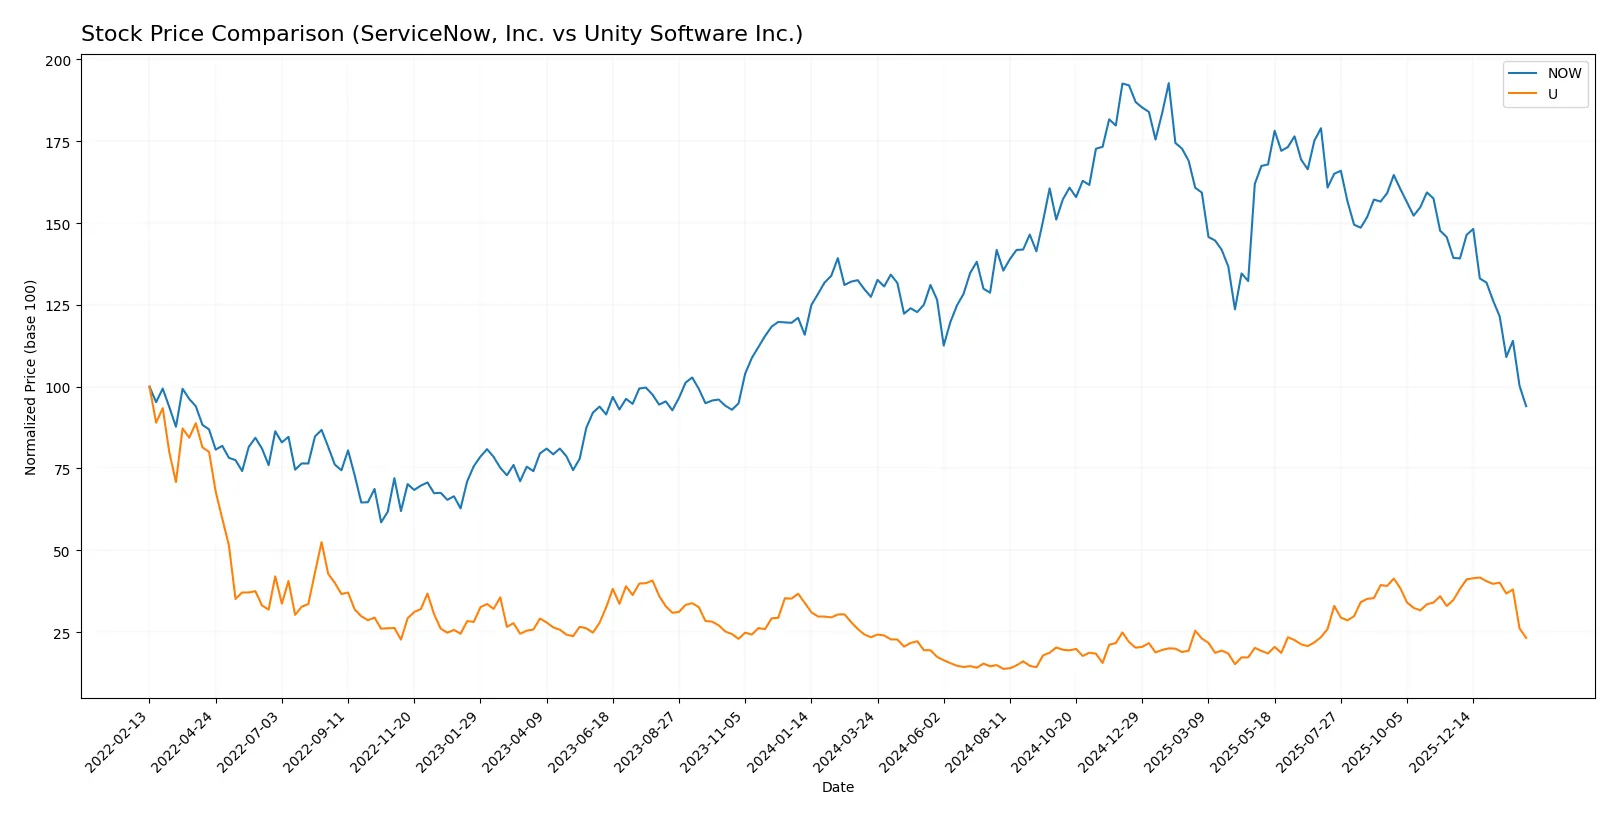
Trend Comparison
ServiceNow’s stock fell 26.22% over the past 12 months, showing a bearish trend with deceleration. The price ranged between 109.77 and 225.0, and volatility remained high (std dev 25.07).
Unity’s stock declined 0.84% in the past year, also bearish with deceleration. The price fluctuated from 15.32 to 46.42, and volatility was lower (std dev 9.17), indicating less dramatic swings.
Comparing these trends, Unity delivered the higher market performance, with a far smaller decline than ServiceNow despite both trending downward.
Target Prices
Analysts present a wide range of target prices, reflecting mixed sentiment and uncertainty about near-term growth prospects.
| Company | Target Low | Target High | Consensus |
|---|---|---|---|
| ServiceNow, Inc. | 115 | 1315 | 440.64 |
| Unity Software Inc. | 39 | 60 | 50.98 |
ServiceNow’s target consensus at $440.64 far exceeds its current price of $109.77, signaling strong long-term growth expectations. Unity Software’s consensus target of $50.98 also doubles its current price of $25.87, suggesting bullish analyst outlook despite recent volatility.

Don’t Let Luck Decide Your Entry Point
Optimize your entry points with our advanced ProRealTime indicators. You’ll get efficient buy signals with precise price targets for maximum performance. Start outperforming now!
How do institutions grade them?
The following grades reflect recent institutional assessments for both companies:
ServiceNow, Inc. Grades
Here are the latest grades from major financial institutions for ServiceNow, Inc.:
| Grading Company | Action | New Grade | Date |
|---|---|---|---|
| Citigroup | Maintain | Buy | 2026-01-30 |
| Evercore ISI Group | Maintain | Outperform | 2026-01-29 |
| Macquarie | Maintain | Neutral | 2026-01-29 |
| BTIG | Maintain | Buy | 2026-01-29 |
| RBC Capital | Maintain | Outperform | 2026-01-29 |
| Keybanc | Maintain | Underweight | 2026-01-29 |
| Stifel | Maintain | Buy | 2026-01-29 |
| DA Davidson | Maintain | Buy | 2026-01-29 |
| Cantor Fitzgerald | Maintain | Overweight | 2026-01-29 |
| Needham | Maintain | Buy | 2026-01-29 |
Unity Software Inc. Grades
The following table summarizes recent institutional grades for Unity Software Inc.:
| Grading Company | Action | New Grade | Date |
|---|---|---|---|
| Morgan Stanley | Maintain | Overweight | 2026-01-13 |
| Goldman Sachs | Maintain | Neutral | 2026-01-13 |
| Wells Fargo | Maintain | Overweight | 2026-01-08 |
| Jefferies | Maintain | Buy | 2026-01-05 |
| BTIG | Upgrade | Buy | 2025-12-11 |
| Piper Sandler | Upgrade | Overweight | 2025-12-11 |
| Wells Fargo | Upgrade | Overweight | 2025-12-05 |
| Arete Research | Upgrade | Buy | 2025-12-01 |
| Citigroup | Maintain | Buy | 2025-11-11 |
| Macquarie | Upgrade | Outperform | 2025-11-07 |
Which company has the best grades?
ServiceNow, Inc. holds a broader consensus of Buy and Outperform ratings from top-tier firms, while Unity Software shows a mix of Buy and Overweight upgrades but fewer Outperform grades. ServiceNow’s stronger institutional support may signal greater confidence among investors.
Risks specific to each company
The following categories identify the critical pressure points and systemic threats facing both firms in the 2026 market environment:
1. Market & Competition
ServiceNow, Inc.
- Operates in a mature enterprise cloud market with steady demand but faces intense competition from large tech firms.
Unity Software Inc.
- Competes in the fast-evolving interactive 3D content space with high innovation risk and aggressive rivals.
2. Capital Structure & Debt
ServiceNow, Inc.
- Maintains a conservative debt load (D/E 0.25) with strong interest coverage, reducing financial risk.
Unity Software Inc.
- Carries higher leverage (D/E 0.74) and negative interest coverage, amplifying solvency concerns.
3. Stock Volatility
ServiceNow, Inc.
- Exhibits low beta (~0.98), indicating moderate volatility aligned with the broader market.
Unity Software Inc.
- Displays high beta (~2.09), signaling elevated stock price swings and investor risk.
4. Regulatory & Legal
ServiceNow, Inc.
- Faces typical software industry regulatory scrutiny, particularly in data privacy and security.
Unity Software Inc.
- Encounters evolving regulations related to digital content, IP rights, and emerging AR/VR standards.
5. Supply Chain & Operations
ServiceNow, Inc.
- Relies on cloud infrastructure and partnerships, with moderate operational risks from service disruptions.
Unity Software Inc.
- Depends on cutting-edge hardware compatibility and developer ecosystem stability, creating operational complexity.
6. ESG & Climate Transition
ServiceNow, Inc.
- Invests in sustainable IT and governance frameworks, aligning with ESG best practices.
Unity Software Inc.
- Faces challenges in reporting ESG metrics amid rapid growth and evolving industry standards.
7. Geopolitical Exposure
ServiceNow, Inc.
- Primarily US-based but serves global clients, exposing it to geopolitical trade and data sovereignty risks.
Unity Software Inc.
- Operates internationally with higher exposure to regulatory and geopolitical volatility in multiple jurisdictions.
Which company shows a better risk-adjusted profile?
ServiceNow’s strongest risk is its sky-high valuation multiples and tight liquidity, which may pressure near-term returns. Unity’s most severe risk lies in its negative profitability and weak financial health, reflected by a distress zone Altman Z-Score. I see ServiceNow offering a better risk-adjusted profile due to its financial stability despite valuation concerns. Notably, Unity’s recent 10% stock drop amid high volatility underscores its elevated market risk.
Final Verdict: Which stock to choose?
ServiceNow’s superpower lies in its growing profitability and operational efficiency, signaling an emerging competitive edge. However, its tight liquidity position remains a point of vigilance that could pressure short-term flexibility. It suits investors with an appetite for steady growth underpinned by improving returns.
Unity’s strategic moat centers on its innovative platform and high intangible assets, but it struggles with consistent profitability and declining capital efficiency. Relative to ServiceNow, Unity offers less stability but could appeal to those seeking speculative exposure in transformative tech with a longer horizon.
If you prioritize reliable earnings growth and improving capital returns, ServiceNow outshines with a clearer path to value creation despite valuation premium. However, if you seek high-risk, high-reward scenarios tied to innovation potential, Unity offers a speculative gateway but demands tolerance for ongoing value destruction.
Disclaimer: Investment carries a risk of loss of initial capital. The past performance is not a reliable indicator of future results. Be sure to understand risks before making an investment decision.
Go Further
I encourage you to read the complete analyses of ServiceNow, Inc. and Unity Software Inc. to enhance your investment decisions: