Home > Comparison > Technology > UBER vs NOW
The strategic rivalry between Uber Technologies, Inc. and ServiceNow, Inc. shapes the Technology sector’s software application landscape. Uber operates a platform-driven mobility and delivery model, emphasizing marketplace scale and logistics. ServiceNow delivers high-margin enterprise cloud solutions focused on workflow automation and IT service management. This analysis pits Uber’s asset-light network against ServiceNow’s software moat to identify which offers superior risk-adjusted returns for a diversified portfolio.

Table of contents
Companies Overview
Uber Technologies and ServiceNow hold pivotal roles in the evolving software application landscape, each redefining market boundaries.
Uber Technologies, Inc.: Mobility and Delivery Powerhouse
Uber dominates as a global ride-sharing and delivery platform connecting consumers with independent drivers and merchants. Its revenue stems from three segments: Mobility, Delivery, and Freight, enabling diversified income streams across transportation and logistics. In 2026, Uber strategically focuses on expanding its delivery ecosystem while refining its mobility offerings to capture more urban market share.
ServiceNow, Inc.: Enterprise Workflow Automation Leader
ServiceNow excels as a cloud-based enterprise software provider specializing in workflow automation and IT service management. Its core revenue comes from subscription sales of the Now platform, integrating AI, machine learning, and robotic process automation to streamline enterprise operations. The company’s 2026 strategy emphasizes deepening automation capabilities and broadening industry-specific solutions through strategic partnerships.
Strategic Collision: Similarities & Divergences
Both companies leverage software innovation to disrupt traditional industries, but Uber targets consumer-driven mobility and delivery, while ServiceNow focuses on enterprise workflow automation. Their primary battleground is digital transformation—Uber reshapes urban logistics, ServiceNow revolutionizes IT and business processes. Investors face distinct profiles: Uber’s growth hinges on market expansion and operational scale, ServiceNow’s on high-margin SaaS and automation depth.
Income Statement Comparison
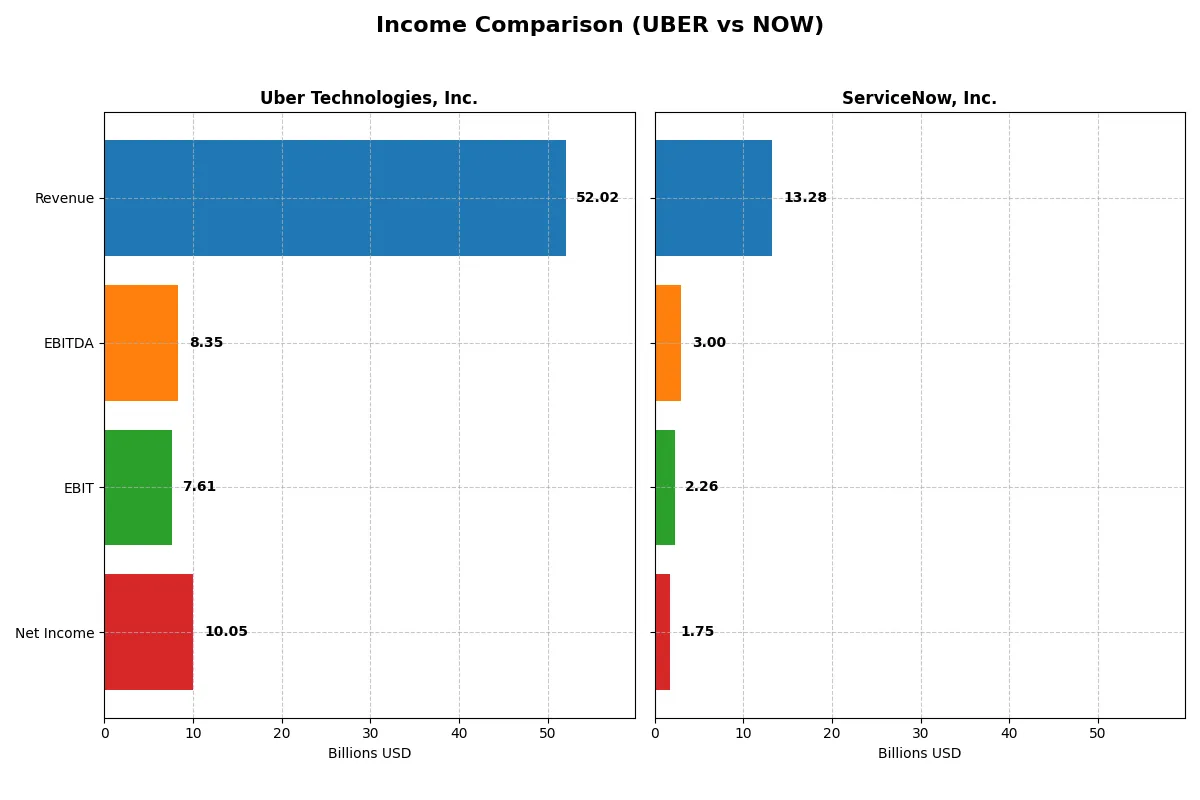
This data dissects the core profitability and scalability of both corporate engines to reveal who dominates the bottom line:
| Metric | Uber Technologies, Inc. (UBER) | ServiceNow, Inc. (NOW) |
|---|---|---|
| Revenue | 52B | 13.3B |
| Cost of Revenue | 31.3B | 3B |
| Operating Expenses | 15.1B | 8.5B |
| Gross Profit | 20.7B | 10.3B |
| EBITDA | 8.3B | 3B |
| EBIT | 7.6B | 2.3B |
| Interest Expense | 440M | 0 |
| Net Income | 10.1B | 1.7B |
| EPS | 4.82 | 1.69 |
| Fiscal Year | 2025 | 2025 |
Income Statement Analysis: The Bottom-Line Duel
This income statement comparison uncovers the true operational efficiency and profitability momentum of each company’s business engine over recent years.
Uber Technologies, Inc. Analysis
Uber’s revenue nearly tripled from 2021 to 2025, reaching $52B in 2025. Net income surged to $10B, driven by improving margins. The 2025 gross margin of 39.75% and net margin of 19.33% highlight strong cost control despite rapid expansion. EBIT jumped 64% year-over-year, signaling accelerating operational efficiency.
ServiceNow, Inc. Analysis
ServiceNow’s revenue doubled from 2021 to $13.3B in 2025, with net income climbing to $1.75B. The company shows robust profitability with a 77.5% gross margin and 13.2% net margin in 2025. EBIT grew 28% year-over-year, reflecting steady margin expansion and disciplined expense management, supporting consistent EPS growth.
Margin Power vs. Revenue Scale
Uber dominates in scale and absolute profitability, boasting higher net income and EBIT margins. ServiceNow excels in gross margin and margin consistency but operates at a smaller scale. For investors, Uber’s rapid expansion paired with improving profitability offers a high-growth profile, while ServiceNow appeals as a margin-focused, steady performer.
Financial Ratios Comparison
These vital ratios act as a diagnostic tool to expose the underlying fiscal health, valuation premiums, and capital efficiency of the companies compared below:
| Ratios | Uber Technologies, Inc. (UBER) | ServiceNow, Inc. (NOW) |
|---|---|---|
| ROE | 45.7% | 13.5% |
| ROIC | 6.8% | 9.0% |
| P/E | 12.8x | 90.9x |
| P/B | 5.9x | 12.3x |
| Current Ratio | 1.07 | 0.95 |
| Quick Ratio | 1.07 | 0.95 |
| D/E (Debt-to-Equity) | 0.53 | 0.25 |
| Debt-to-Assets | 22.3% | 12.3% |
| Interest Coverage | 5.35x | 0 |
| Asset Turnover | 0.86 | 0.51 |
| Fixed Asset Turnover | 14.1 | 4.29 |
| Payout Ratio | 0% | 0% |
| Dividend Yield | 0% | 0% |
| Fiscal Year | 2024 | 2025 |
Efficiency & Valuation Duel: The Vital Signs
Financial ratios act as a company’s DNA, uncovering hidden risks and operational strengths to guide investors’ decisions effectively.
Uber Technologies, Inc.
Uber exhibits robust profitability with a 45.7% ROE and a strong 22.4% net margin, signaling operational excellence. Its P/E ratio of 12.8 indicates an attractively valued stock, though a high P/B ratio of 5.9 raises caution. Uber returns value mainly through reinvestment in R&D, foregoing dividends.
ServiceNow, Inc.
ServiceNow shows moderate profitability with a 13.5% ROE and a 13.2% net margin, reflecting solid but less aggressive returns. However, its P/E of 90.9 and P/B of 12.3 mark the stock as significantly expensive. Like Uber, it pays no dividend, focusing on growth through heavy R&D spending.
Premium Valuation vs. Operational Safety
Uber offers a more balanced risk-reward profile with superior profitability and reasonable valuation multiples. ServiceNow demands a premium valuation for growth potential but carries higher valuation risk. Investors seeking operational safety may prefer Uber’s metrics over ServiceNow’s stretched valuation.
Which one offers the Superior Shareholder Reward?
Uber Technologies, Inc. (UBER) and ServiceNow, Inc. (NOW) both forgo dividends, focusing on reinvestment and buybacks. Uber’s free cash flow per share of 3.29 and near 1.0 FCF conversion suggest solid cash generation but no dividends or buybacks signal a growth-first approach. ServiceNow posts higher free cash flow per share at 4.41 but trades at a steep price-to-free-cash-flow ratio near 35, indicating premium valuation. Both lack dividends, but ServiceNow’s robust operating margins (13.7% EBIT margin in 2025) and consistent buyback intensity create a more sustainable distribution model. I see ServiceNow offering superior total shareholder return in 2026, balancing growth reinvestment with disciplined buybacks, unlike Uber’s slower path to profitability and absence of buybacks.
Comparative Score Analysis: The Strategic Profile
The radar chart reveals the fundamental DNA and trade-offs of Uber Technologies, Inc. and ServiceNow, Inc., highlighting their distinctive financial strengths and weaknesses:
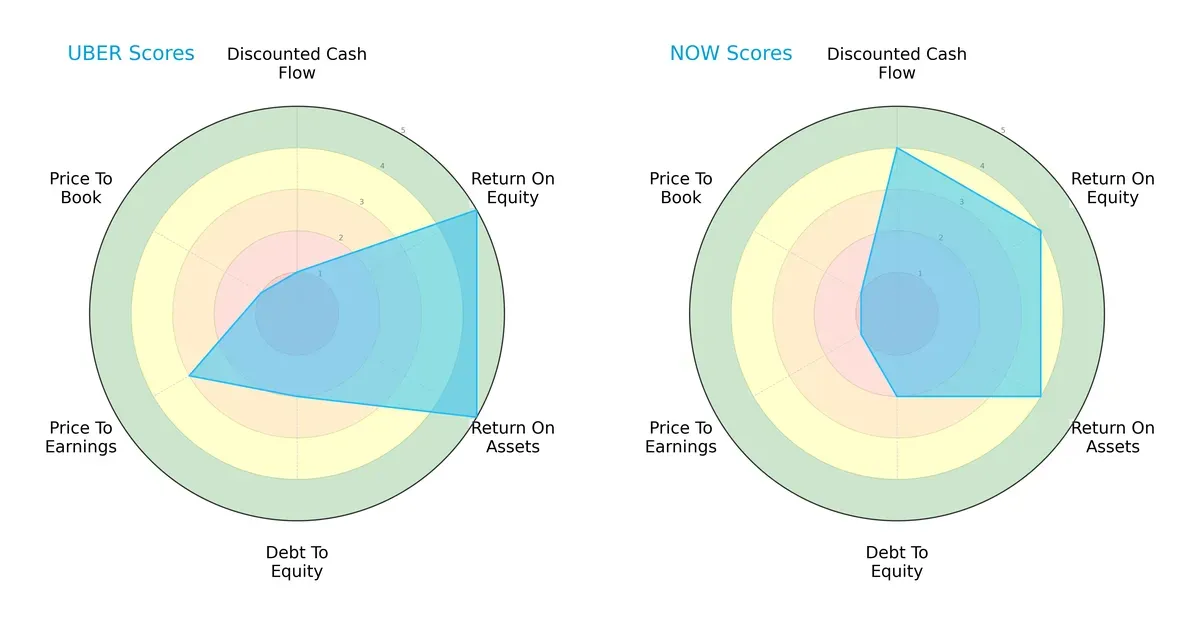
Uber excels in return on equity (5) and return on assets (5), signaling strong profitability and asset efficiency. However, its discounted cash flow score (1) and price-to-book score (1) lag, indicating valuation concerns. ServiceNow scores favorably on discounted cash flow (4) and maintains moderate debt levels (2), but its price-to-earnings (1) and price-to-book (1) scores suggest overvaluation risks. Overall, Uber shows a more concentrated advantage in profitability metrics, whereas ServiceNow presents a balanced profile with valuation challenges.
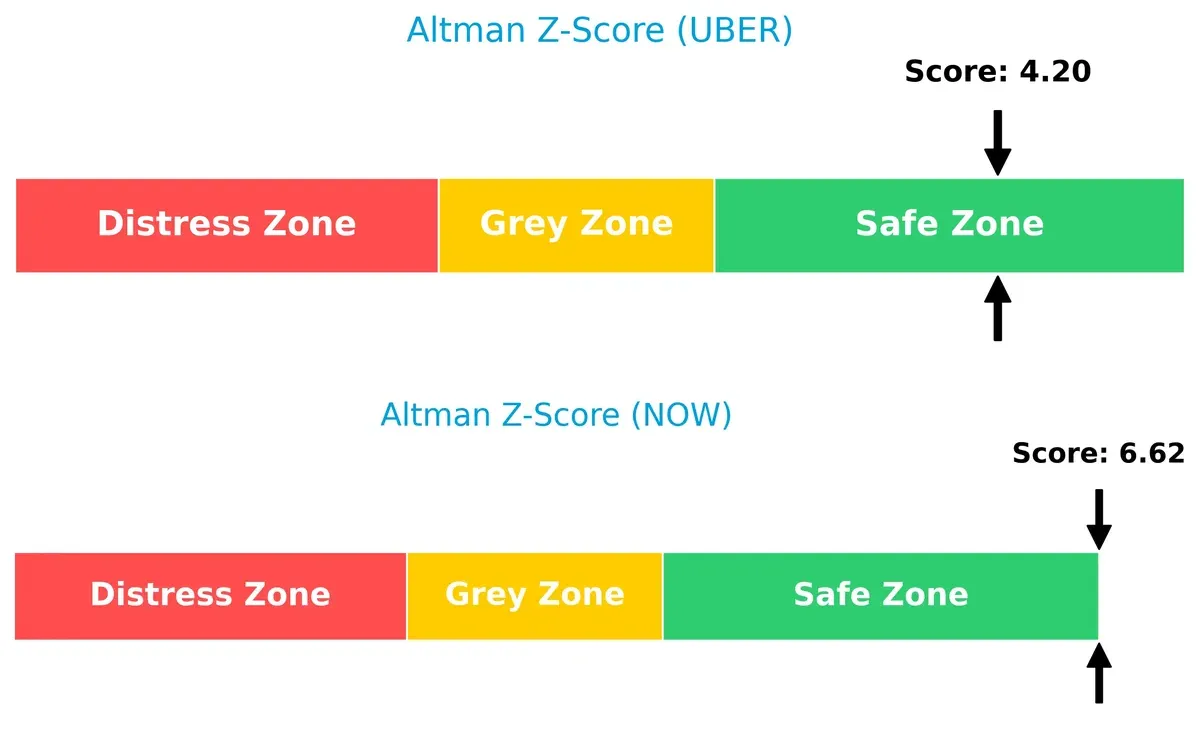
Bankruptcy Risk: Solvency Showdown
The Altman Z-Score gap favors ServiceNow at 6.6 versus Uber’s 4.2, both safely above the distress threshold, implying strong solvency but with ServiceNow better cushioned for long-term stability:
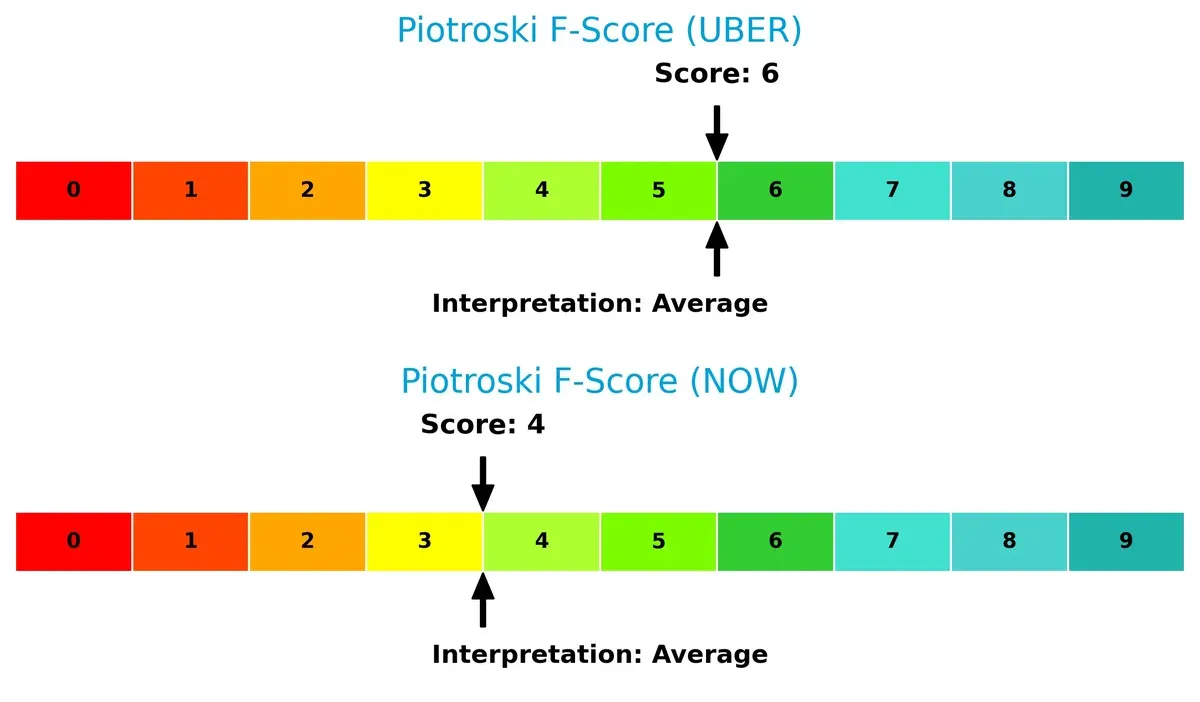
Financial Health: Quality of Operations
Uber’s Piotroski F-Score of 6 outperforms ServiceNow’s 4, indicating Uber’s operational metrics are healthier and less prone to red flags. ServiceNow’s lower score suggests caution on internal financial strength:
How are the two companies positioned?
This section dissects Uber and ServiceNow’s operational DNA by comparing their revenue distribution and internal dynamics. The goal is to confront their economic moats and identify which model offers the most resilient, sustainable competitive advantage today.
Revenue Segmentation: The Strategic Mix
This visual comparison dissects how Uber Technologies and ServiceNow diversify their income streams and reveals where their primary sector bets lie:
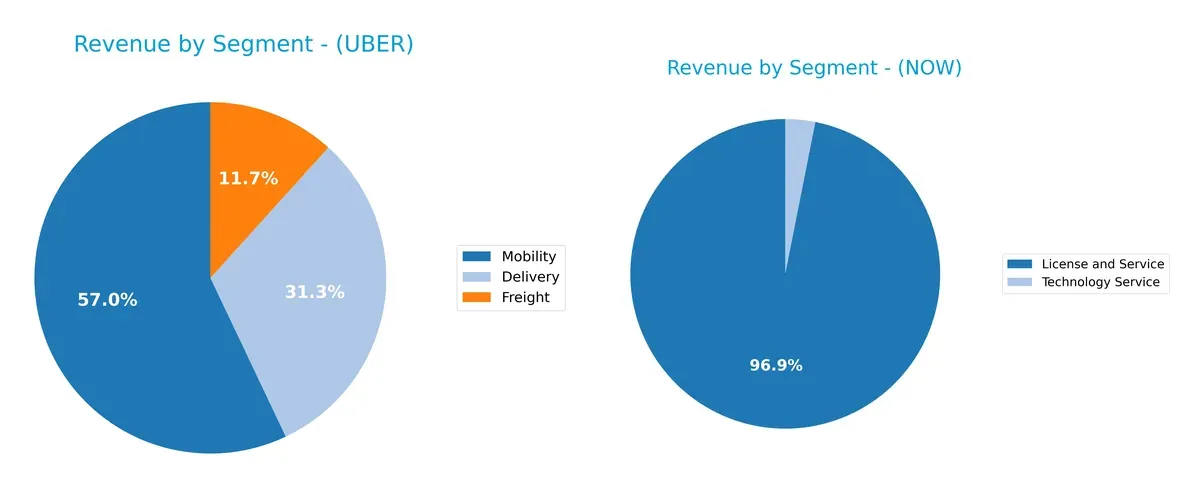
Uber’s revenue pivots heavily on Mobility at $25B, anchoring its portfolio, with Delivery ($13.7B) and Freight ($5.1B) as significant contributors. ServiceNow, by contrast, boasts a more concentrated mix dominated by License and Service segments totaling about $13B in 2025. Uber’s multi-segment approach reduces concentration risk but depends on competitive ride-sharing and logistics markets. ServiceNow’s focus signals deep ecosystem lock-in in digital workflow software, but it bears higher dependency on sustaining product innovation.
Strengths and Weaknesses Comparison
This table compares the Strengths and Weaknesses of Uber Technologies, Inc. and ServiceNow, Inc.:
Uber Strengths
- Diverse revenue streams across Delivery, Freight, and Mobility
- Strong profitability with 22.4% net margin and 45.7% ROE
- Favorable debt metrics with 22.3% debt-to-assets and strong interest coverage
- High fixed asset turnover at 14.14 indicating efficient asset use
- Significant global presence with over $23B revenue in US & Canada and $12.5B in EMEA
ServiceNow Strengths
- Focused revenue in License and Service digital workflow products
- Favorable debt levels with 12.3% debt-to-assets and low debt-to-equity of 0.25
- Infinite interest coverage showing no interest burden
- Moderate profitability with 13.2% net margin
- Solid presence in North America and EMEA with growing Asia Pacific revenues
- Consistent growth in license and service revenue segments
Uber Weaknesses
- Price-to-book ratio at 5.86 is unfavorable, suggesting overvaluation concerns
- Lack of dividend yield limits income investor appeal
- Neutral current ratio at 1.07 could signal liquidity constraints
- ROIC of 6.79% unassessed against unavailable WACC hinders capital efficiency analysis
- Asset turnover at 0.86 is moderate but less efficient than fixed assets
ServiceNow Weaknesses
- High price-to-earnings ratio of 90.9 signals expensive valuation
- Unfavorable current ratio below 1 at 0.95 raises liquidity risks
- Lower ROE of 13.5% compared to Uber’s 45.7% indicates less efficient equity use
- Dividend yield of zero limits shareholder returns
- Asset turnover is moderate at 0.51, suggesting less efficient asset usage
Uber’s strengths lie in its diversified business model and strong profitability, supported by solid global reach. ServiceNow excels in focused product revenue and financial stability but faces valuation and liquidity challenges. Both companies must balance growth ambitions with prudent capital and risk management to sustain their competitive positions.
The Moat Duel: Analyzing Competitive Defensibility
A structural moat is the only reliable shield that protects a company’s long-term profits from relentless competition pressure:
Uber Technologies, Inc.: Network Effects Powerhouse
Uber’s primary moat lies in its vast network effects, connecting millions of riders and drivers globally. This scale drives high utilization and margin stability. In 2026, expanding freight logistics and financial partnerships could deepen this advantage, but regulatory risks loom.
ServiceNow, Inc.: Intangible Assets and Workflow Lock-in
ServiceNow’s moat is built on intangible assets and high switching costs embedded in enterprise workflow automation. Unlike Uber’s network-driven moat, ServiceNow commands strong pricing power and margin expansion. The company’s AI and automation advances fuel steady growth and market penetration opportunities ahead.
Verdict: Network Effects vs. Workflow Lock-In
Uber’s expansive network effects create a wider moat in consumer mobility, but ServiceNow’s deeper enterprise lock-in offers more sustainable profitability. I see ServiceNow better equipped to defend and grow its market share amid intensifying competition.
Which stock offers better returns?
Over the past 12 months, Uber Technologies, Inc. and ServiceNow, Inc. exhibited contrasting price movements, with Uber showing modest gains and ServiceNow facing significant declines amid shifting trading dynamics.
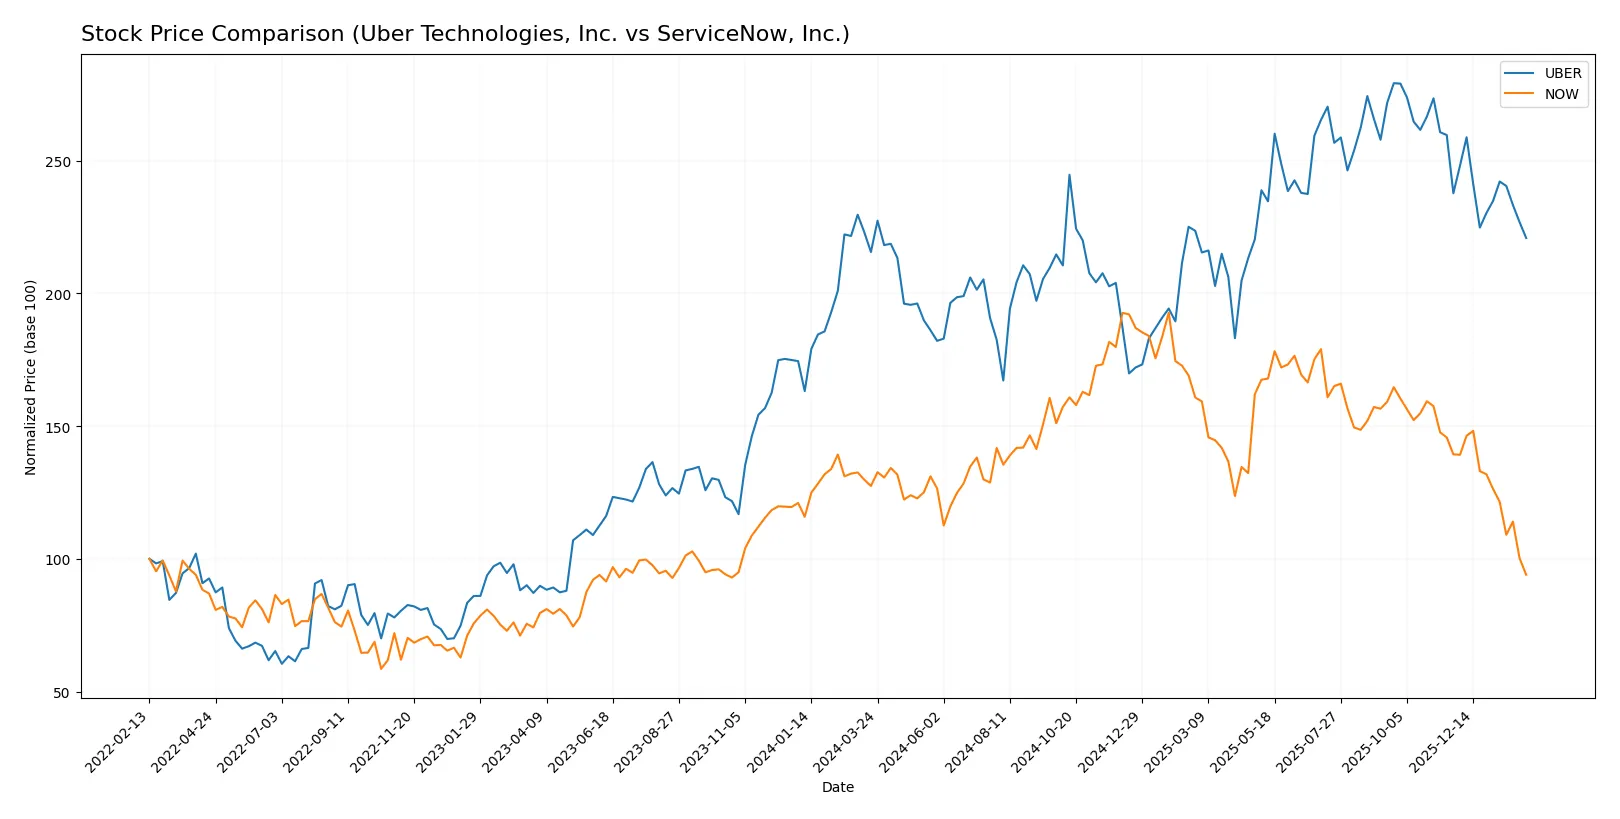
Trend Comparison
Uber Technologies, Inc. posted a 2.45% price increase over the past year, indicating a bullish trend with decelerating momentum. The stock ranged between 59 and 98.51, showing moderate volatility (std dev 10.29).
ServiceNow, Inc. experienced a 26.22% price drop over the same period, demonstrating a bearish trend with decelerating loss. Its price fluctuated widely from 109.77 to 225, reflecting high volatility (std dev 25.07).
Comparing both, Uber delivered the highest market performance with a modest gain, while ServiceNow showed a pronounced decline, marking Uber as the stronger performer in this timeframe.
Target Prices
Analyst consensus indicates varied price targets for Uber Technologies and ServiceNow, reflecting differing growth expectations.
| Company | Target Low | Target High | Consensus |
|---|---|---|---|
| Uber Technologies, Inc. | 73 | 140 | 109.35 |
| ServiceNow, Inc. | 115 | 1315 | 440.64 |
Uber’s target consensus of 109.35 is notably above its current price of 77.93, signaling upside potential. ServiceNow’s wide range and consensus of 440.64 also suggest significant analyst optimism despite recent share weakness.

Don’t Let Luck Decide Your Entry Point
Optimize your entry points with our advanced ProRealTime indicators. You’ll get efficient buy signals with precise price targets for maximum performance. Start outperforming now!
How do institutions grade them?
Uber Technologies, Inc. Grades
Here are the recent grades assigned by reputable financial institutions for Uber Technologies, Inc.:
| Grading Company | Action | New Grade | Date |
|---|---|---|---|
| Needham | Maintain | Buy | 2026-02-03 |
| Stifel | Maintain | Buy | 2026-01-27 |
| Guggenheim | Maintain | Buy | 2026-01-22 |
| Keybanc | Maintain | Overweight | 2026-01-20 |
| BTIG | Maintain | Buy | 2026-01-15 |
| Wells Fargo | Maintain | Overweight | 2026-01-08 |
| Cantor Fitzgerald | Maintain | Overweight | 2026-01-08 |
| Wolfe Research | Maintain | Outperform | 2026-01-06 |
| Wedbush | Maintain | Neutral | 2025-12-19 |
| Morgan Stanley | Maintain | Overweight | 2025-12-08 |
ServiceNow, Inc. Grades
These are the recent institutional grades for ServiceNow, Inc. from recognized analysts:
| Grading Company | Action | New Grade | Date |
|---|---|---|---|
| Citigroup | Maintain | Buy | 2026-01-30 |
| Evercore ISI Group | Maintain | Outperform | 2026-01-29 |
| Macquarie | Maintain | Neutral | 2026-01-29 |
| BTIG | Maintain | Buy | 2026-01-29 |
| RBC Capital | Maintain | Outperform | 2026-01-29 |
| Keybanc | Maintain | Underweight | 2026-01-29 |
| Stifel | Maintain | Buy | 2026-01-29 |
| DA Davidson | Maintain | Buy | 2026-01-29 |
| Cantor Fitzgerald | Maintain | Overweight | 2026-01-29 |
| Needham | Maintain | Buy | 2026-01-29 |
Which company has the best grades?
Both companies receive predominantly positive grades, yet Uber displays more consistent “Buy” and “Overweight” ratings from multiple firms. ServiceNow’s ratings mix “Buy” and “Outperform” with one notable “Underweight,” reflecting slightly more varied analyst sentiment. Investors may view Uber’s steadier consensus as a sign of broader institutional confidence.
Risks specific to each company
The following categories identify critical pressure points and systemic threats facing Uber Technologies, Inc. and ServiceNow, Inc. in the 2026 market environment:
1. Market & Competition
Uber Technologies, Inc.
- Faces intense competition in ridesharing and delivery sectors with low switching costs for consumers.
ServiceNow, Inc.
- Competes in enterprise cloud computing with strong incumbents and high switching costs but faces innovation pressures.
2. Capital Structure & Debt
Uber Technologies, Inc.
- Moderate debt-to-equity ratio at 0.53, manageable interest coverage of 17.29, signaling balanced leverage risk.
ServiceNow, Inc.
- Lower debt-to-equity ratio at 0.25 and infinite interest coverage indicates conservative leverage and strong liquidity.
3. Stock Volatility
Uber Technologies, Inc.
- Beta of 1.206 suggests higher volatility than market, increasing investor risk in turbulent markets.
ServiceNow, Inc.
- Beta of 0.978 implies stock moves roughly in line with market, offering comparatively lower volatility risk.
4. Regulatory & Legal
Uber Technologies, Inc.
- Exposed to regulatory scrutiny on labor classification and ride-sharing laws globally, adding legal uncertainty.
ServiceNow, Inc.
- Faces regulatory risks primarily around data privacy and cloud compliance, which can impact operational flexibility.
5. Supply Chain & Operations
Uber Technologies, Inc.
- Operational complexity across mobility, delivery, and freight segments increases exposure to logistical disruptions.
ServiceNow, Inc.
- Cloud-based platform reduces physical supply chain risks but depends heavily on data center uptime and third-party integrations.
6. ESG & Climate Transition
Uber Technologies, Inc.
- Faces pressure to reduce carbon footprint in transportation and delivery fleets amid rising ESG standards.
ServiceNow, Inc.
- ESG risks focus on responsible data management and sustainable IT operations, with less direct environmental impact.
7. Geopolitical Exposure
Uber Technologies, Inc.
- Operates in multiple regions including emerging markets, vulnerable to geopolitical instability and trade tensions.
ServiceNow, Inc.
- Primarily US and developed markets exposure, limiting geopolitical risk but still sensitive to global cloud regulations.
Which company shows a better risk-adjusted profile?
Uber’s greatest risk lies in regulatory and operational complexity amid a volatile market. ServiceNow’s key challenge is its stretched valuation and regulatory compliance in cloud services. I see ServiceNow as having a more balanced risk-adjusted profile due to stronger capital structure and lower stock volatility. However, Uber’s solid profitability and liquidity metrics provide a cushion against operational headwinds. The widening valuation gap in ServiceNow, with a high P/E of 90.88, highlights investor concerns about future growth sustainability, reinforcing caution.
Final Verdict: Which stock to choose?
Uber Technologies, Inc. shines as a cash machine with strong profitability and efficient capital use. Its rapid ROIC growth suggests improving operational leverage. A point of vigilance remains its relatively high valuation multiples. Uber fits well in aggressive growth portfolios seeking dynamic market capture.
ServiceNow, Inc. commands a strategic moat through its cloud dominance and subscription-based recurring revenue. It offers better balance sheet safety with low debt and consistent free cash flow. ServiceNow suits growth-at-a-reasonable-price (GARP) investors prioritizing stability alongside expansion potential.
If you prioritize aggressive growth and improving returns on capital, Uber is the compelling choice due to its robust profitability and rising operational efficiency. However, if you seek stable cash flow and a durable competitive moat, ServiceNow offers better stability despite its premium valuation. Both present slightly favorable financial profiles but cater to distinct investor appetites.
Disclaimer: Investment carries a risk of loss of initial capital. The past performance is not a reliable indicator of future results. Be sure to understand risks before making an investment decision.
Go Further
I encourage you to read the complete analyses of Uber Technologies, Inc. and ServiceNow, Inc. to enhance your investment decisions: