Home > Comparison > Technology > NOW vs TYL
The strategic rivalry between ServiceNow, Inc. and Tyler Technologies, Inc. shapes the evolving landscape of enterprise software. ServiceNow operates as a broad-based, innovation-driven platform provider in the application software sector. In contrast, Tyler Technologies focuses on specialized, public-sector software solutions with deep vertical integration. This analysis aims to identify which company’s operational model delivers superior risk-adjusted returns for diversified portfolios navigating the competitive technology environment.
Table of contents
Companies Overview
ServiceNow and Tyler Technologies each play pivotal roles in the enterprise software market with distinct public sector and enterprise focuses.
ServiceNow, Inc.: Enterprise Cloud Workflow Leader
ServiceNow dominates enterprise cloud computing by automating workflows through its Now platform. It generates revenue from IT service management, security operations, and business process automation. In 2026, it prioritizes expanding AI-driven automation and strategic partnerships to enhance workflow efficiency.
Tyler Technologies, Inc.: Public Sector Software Specialist
Tyler Technologies specializes in integrated information management for government agencies. It earns revenue through enterprise software, appraisal, tax solutions, and judicial systems. Its 2026 focus centers on cloud migration and enhancing public sector service delivery via collaboration with AWS.
Strategic Collision: Similarities & Divergences
Both companies emphasize software-driven automation but diverge in philosophy: ServiceNow targets broad enterprise workflows while Tyler zeroes in on public sector solutions. Their primary battleground is digital transformation, but ServiceNow’s scale contrasts with Tyler’s niche focus. Investors face distinct profiles—ServiceNow with broad tech exposure, Tyler with specialized government software resilience.
Income Statement Comparison
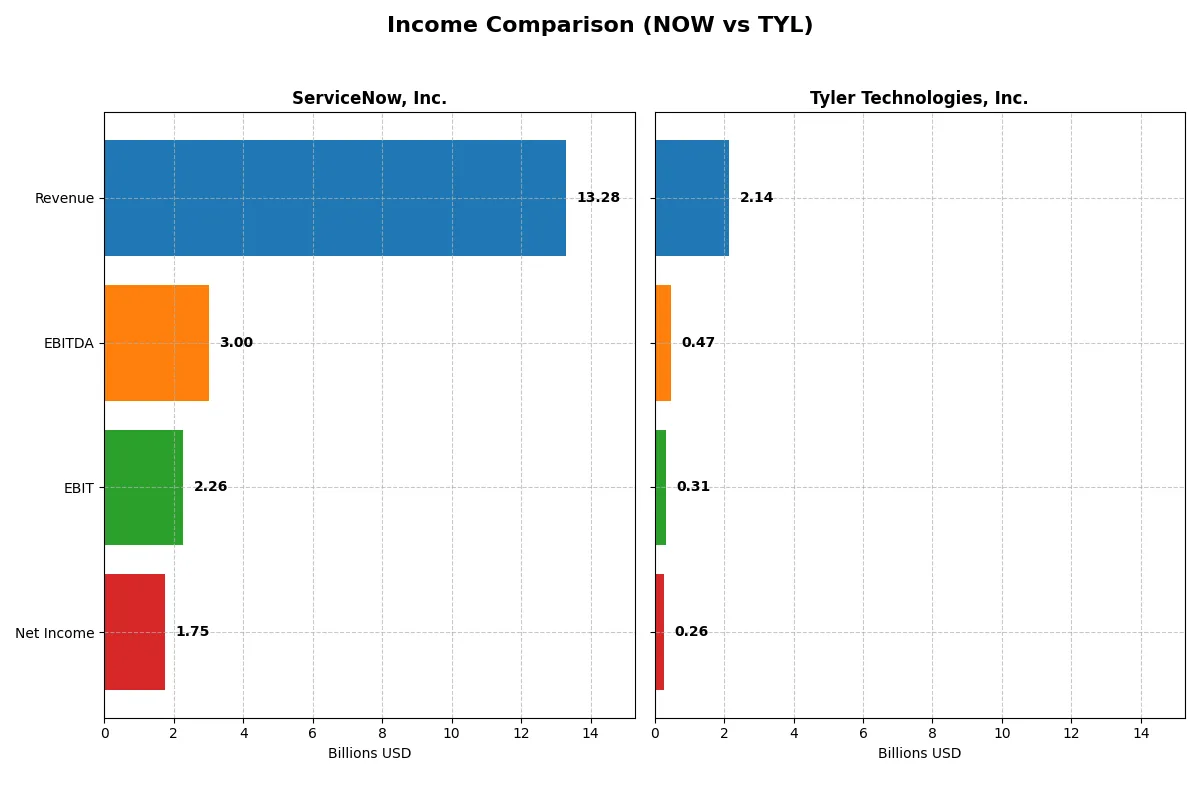
This data dissects the core profitability and scalability of both corporate engines to reveal who dominates the bottom line:
| Metric | ServiceNow, Inc. (NOW) | Tyler Technologies, Inc. (TYL) |
|---|---|---|
| Revenue | 13.3B | 2.14B |
| Cost of Revenue | 3.0B | 1.26B |
| Operating Expenses | 8.47B | 577M |
| Gross Profit | 10.3B | 876M |
| EBITDA | 3.0B | 466M |
| EBIT | 2.26B | 314M |
| Interest Expense | 0 | 5.93M |
| Net Income | 1.75B | 263M |
| EPS | 1.69 | 6.17 |
| Fiscal Year | 2025 | 2024 |
Income Statement Analysis: The Bottom-Line Duel
This income statement comparison reveals which company runs a more efficient and profitable corporate engine through revenue and margin trends.
ServiceNow, Inc. Analysis
ServiceNow’s revenue surged from 5.9B in 2021 to 13.3B in 2025, with net income growing from 230M to 1.75B. Its gross margin remains strong at 77.5%, while net margin hovers around 13%. In 2025, ServiceNow accelerated EBIT by 28%, showing powerful operating leverage and margin expansion amid rising revenues.
Tyler Technologies, Inc. Analysis
Tyler Technologies increased revenue from 1.1B in 2020 to 2.1B in 2024, with net income rising from 195M to 263M. The company maintains a stable gross margin near 41% and a net margin of 12.3%. In 2024, it posted a sharp 42% EBIT increase, reflecting efficient cost control despite slower top-line growth compared to ServiceNow.
Margin Power vs. Revenue Scale
ServiceNow dominates with a 125% revenue increase and 660% net income growth over five years, outperforming Tyler’s 91% and 35% respectively. Its superior gross and net margins underscore stronger profitability and scale. Investors seeking rapid expansion with robust margin gains may find ServiceNow’s profile more compelling than Tyler’s steady but slower growth.
Financial Ratios Comparison
These vital ratios act as a diagnostic tool to expose the underlying fiscal health, valuation premiums, and capital efficiency of the companies analyzed:
| Ratios | ServiceNow, Inc. (NOW) | Tyler Technologies, Inc. (TYL) |
|---|---|---|
| ROE | 13.5% | 7.8% |
| ROIC | 9.0% | 6.2% |
| P/E | 90.9 | 93.4 |
| P/B | 12.3 | 7.3 |
| Current Ratio | 0.95 | 1.35 |
| Quick Ratio | 0.95 | 1.35 |
| D/E (Debt-to-Equity) | 0.25 | 0.19 |
| Debt-to-Assets | 12.3% | 12.3% |
| Interest Coverage | 0 | 50.5 |
| Asset Turnover | 0.51 | 0.41 |
| Fixed Asset Turnover | 4.29 | 10.95 |
| Payout Ratio | 0 | 0 |
| Dividend Yield | 0 | 0 |
| Fiscal Year | 2025 | 2024 |
Efficiency & Valuation Duel: The Vital Signs
Financial ratios act as a company’s DNA, revealing hidden risks and operational excellence that shape investor confidence and valuation.
ServiceNow, Inc.
ServiceNow posts a solid 13.48% ROE and a favorable net margin of 13.16%, signaling decent profitability. However, its P/E ratio at 90.88 and P/B at 12.25 suggest the stock is stretched and expensive. The company pays no dividend, reinvesting heavily in R&D, fueling growth but raising valuation risk.
Tyler Technologies, Inc.
Tyler Technologies shows moderate profitability with a 7.76% ROE and a 12.3% net margin, reflecting efficiency but weaker returns than ServiceNow. Its P/E at 93.42 is also expensive, though the stronger current and quick ratios indicate better liquidity. Like ServiceNow, Tyler foregoes dividends, focusing on growth investments.
Premium Valuation vs. Operational Safety
Both stocks trade at high valuations with P/E ratios near 90, signaling premium pricing. ServiceNow offers higher profitability but weaker liquidity, while Tyler provides a safer short-term balance sheet alongside moderate returns. Investors seeking growth at a premium may prefer ServiceNow’s profile; those valuing operational safety might lean toward Tyler.
Which one offers the Superior Shareholder Reward?
ServiceNow (NOW) and Tyler Technologies (TYL) both forego dividends, reinvesting free cash flow into growth. NOW’s payout ratio is zero, with a robust FCF per share of 4.4 and elevated valuation multiples signaling growth expectations. Buyback activity is limited for both, but Tyler’s free cash flow per share of 14.2 dwarfs NOW, supporting a stronger buyback capacity. Tyler sports a healthier current ratio (1.35 vs. NOW’s 0.95), indicating better short-term financial flexibility. Historically, Tyler’s capital allocation favors stable cash returns via buybacks, while NOW prioritizes aggressive reinvestment, reflected in its sky-high P/E of 90+. For long-term total return in 2026, I favor Tyler’s more balanced capital allocation and sustainable cash flow yield, which better supports shareholder rewards amid market volatility.
Comparative Score Analysis: The Strategic Profile
The radar chart reveals the fundamental DNA and trade-offs of ServiceNow, Inc. and Tyler Technologies, Inc.:
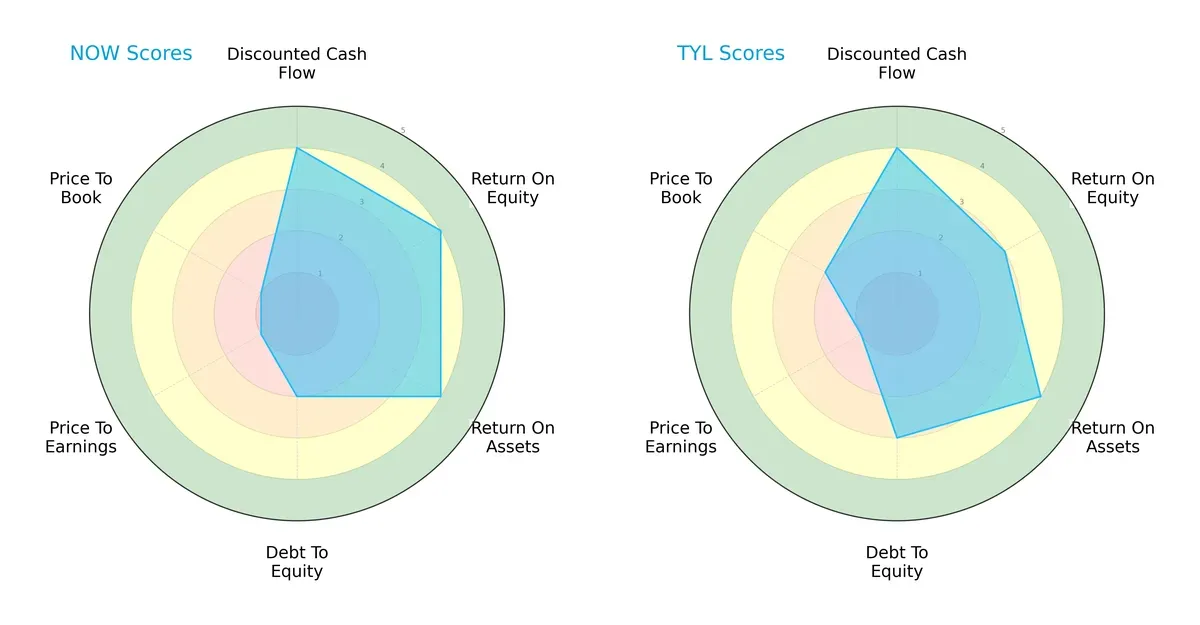
ServiceNow exhibits superior returns on equity and assets (both score 4) but carries higher leverage risk (debt-to-equity score of 2). Tyler Technologies displays a more balanced debt profile (score 3) but slightly lower ROE (3). Both firms share strong discounted cash flow scores (4) and suffer from very unfavorable valuation metrics (P/E score 1). Tyler edges ServiceNow in price-to-book (2 vs. 1), indicating a marginally better market valuation balance.
—
Bankruptcy Risk: Solvency Showdown
The Altman Z-Score gap favors ServiceNow (6.62) over Tyler Technologies (5.83), both safely above the distress threshold, signaling robust long-term solvency in this cycle:
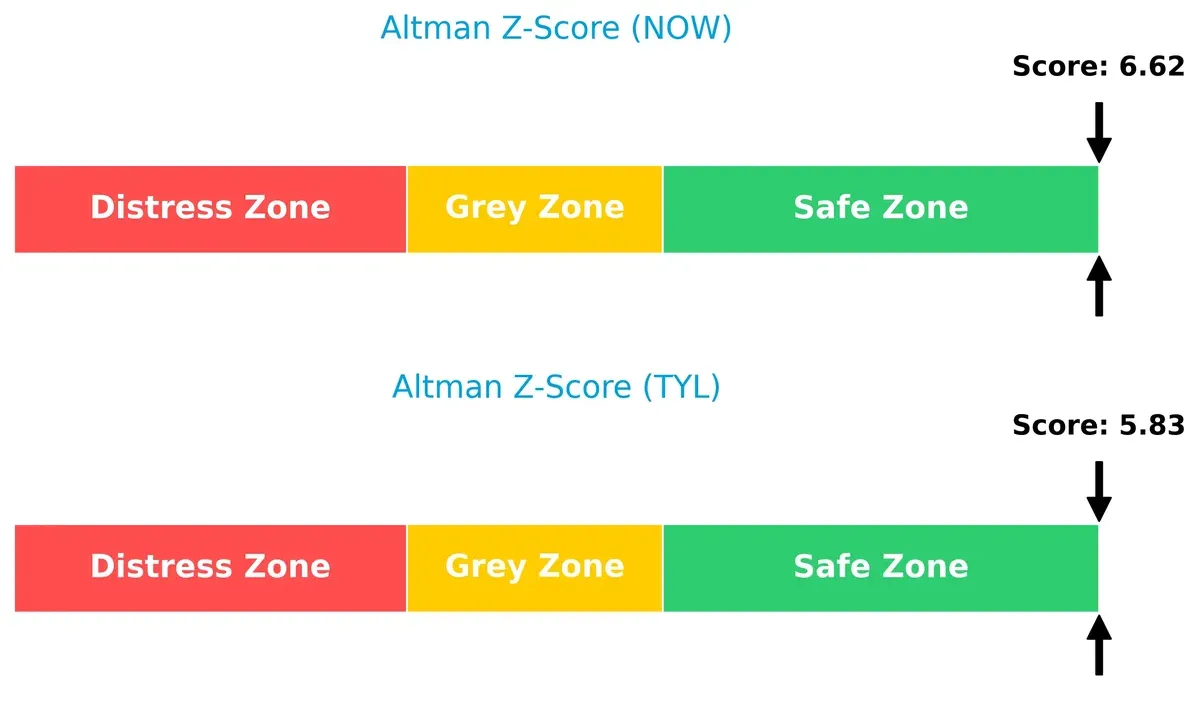
—
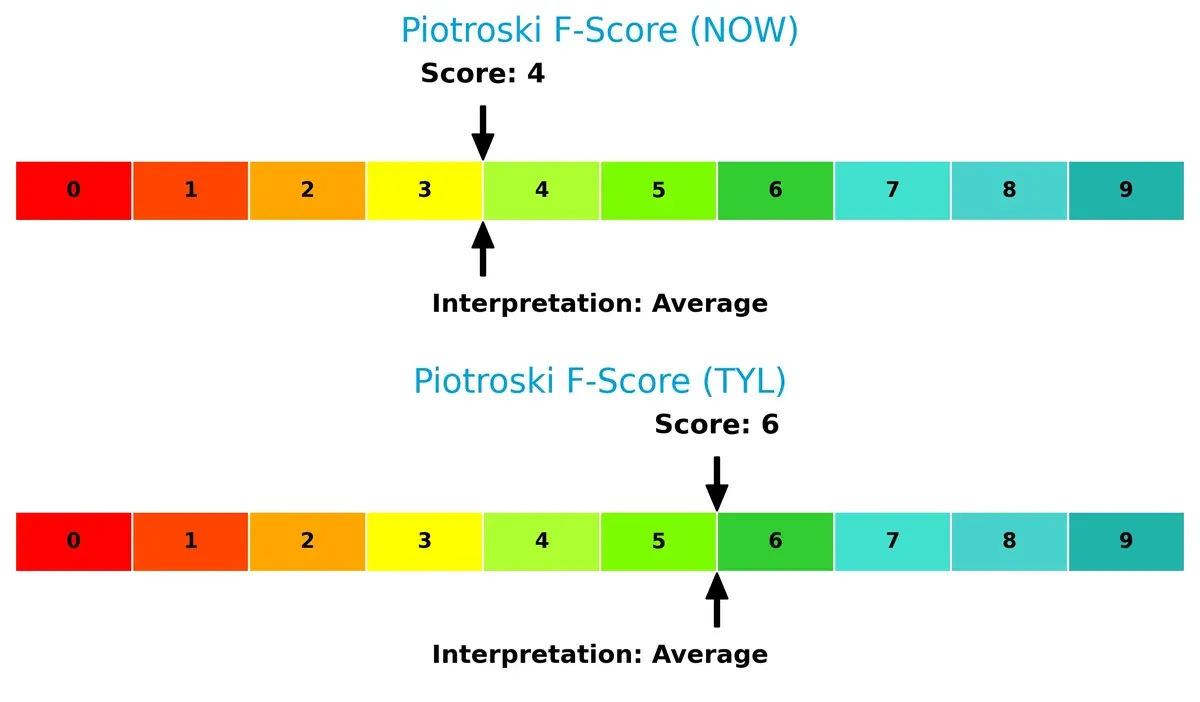
Financial Health: Quality of Operations
ServiceNow’s Piotroski score of 4 trails Tyler’s 6, highlighting stronger operational health and fewer internal red flags for Tyler Technologies:
How are the two companies positioned?
This section dissects the operational DNA of ServiceNow and Tyler Technologies by comparing their revenue distribution and internal dynamics. The goal is to confront their economic moats and identify which business model offers the most resilient competitive advantage today.
Revenue Segmentation: The Strategic Mix
This visual comparison dissects how ServiceNow and Tyler Technologies diversify their income streams and where their primary sector bets lie:
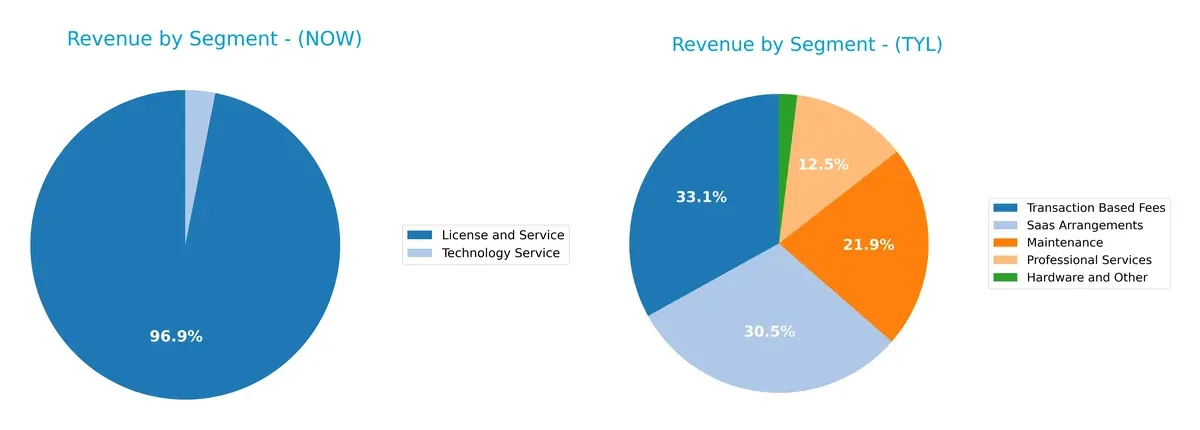
ServiceNow generates $12.9B in License and Service, dominating with a strong focus on digital workflow products plus a smaller $414M in Technology Service. Tyler’s 2024 revenue spreads across five segments, led by $698M in Transaction Based Fees and $645M from SaaS Arrangements, showing broader diversification. ServiceNow’s concentration signals ecosystem lock-in, while Tyler’s mix reduces concentration risk but may lack a singular infrastructure moat.
Strengths and Weaknesses Comparison
This table compares the Strengths and Weaknesses of ServiceNow and Tyler Technologies:
ServiceNow Strengths
- Strong net margin at 13.16%
- Favorable debt-to-equity ratio of 0.25
- Large global presence with $8.35B North America revenue
- Balanced revenue segments with $12.9B License and Service
- Favorable interest coverage with infinite ratio
- Favorable fixed asset turnover at 4.29
Tyler Technologies Strengths
- Favorable net margin at 12.3%
- Strong interest coverage at 52.96
- Favorable current and quick ratios at 1.35
- Favorable debt-to-assets at 12.32%
- Higher fixed asset turnover of 10.95
- Diverse revenue streams including SaaS and transaction fees
ServiceNow Weaknesses
- Unfavorable high valuation metrics: PE 90.88, PB 12.25
- Low current ratio at 0.95
- Zero dividend yield
- Neutral ROE and ROIC near WACC levels
- Moderate asset turnover at 0.51
Tyler Technologies Weaknesses
- Unfavorable PE at 93.42 and PB at 7.25
- Unfavorable lower ROE at 7.76%
- Unfavorable asset turnover at 0.41
- Zero dividend yield
- Limited geographic diversification data
ServiceNow shows robust global revenue and a strong balance sheet with moderate profitability and valuation concerns. Tyler excels in liquidity and asset efficiency but faces valuation and profitability challenges. These profiles imply distinct strategic priorities in financial management and market expansion.
The Moat Duel: Analyzing Competitive Defensibility
A structural moat protects long-term profits from competition erosion. Only durable competitive advantages withstand relentless market pressures:
ServiceNow, Inc.: Workflow Automation with Intangible Asset Moat
ServiceNow leverages a strong intangible asset moat through its Now platform, reflected in a rising ROIC and margin stability. Expansion into AI-driven automation deepens this moat in 2026.
Tyler Technologies, Inc.: Niche Public Sector Expertise with Cost Advantage
Tyler’s moat stems from specialized public sector solutions and cost efficiency. However, its declining ROIC signals weakening profitability, posing risks to its competitive edge in 2026.
Workflow Automation vs. Public Sector Specialization: The Moat Showdown
ServiceNow holds a deeper, growing moat backed by scalable AI automation and strong financials. Tyler’s niche focus is narrower with shrinking returns, making ServiceNow better equipped to defend market share.
Which stock offers better returns?
The past year shows both ServiceNow and Tyler Technologies declining notably, with increasing volume but seller dominance intensifying in recent months.
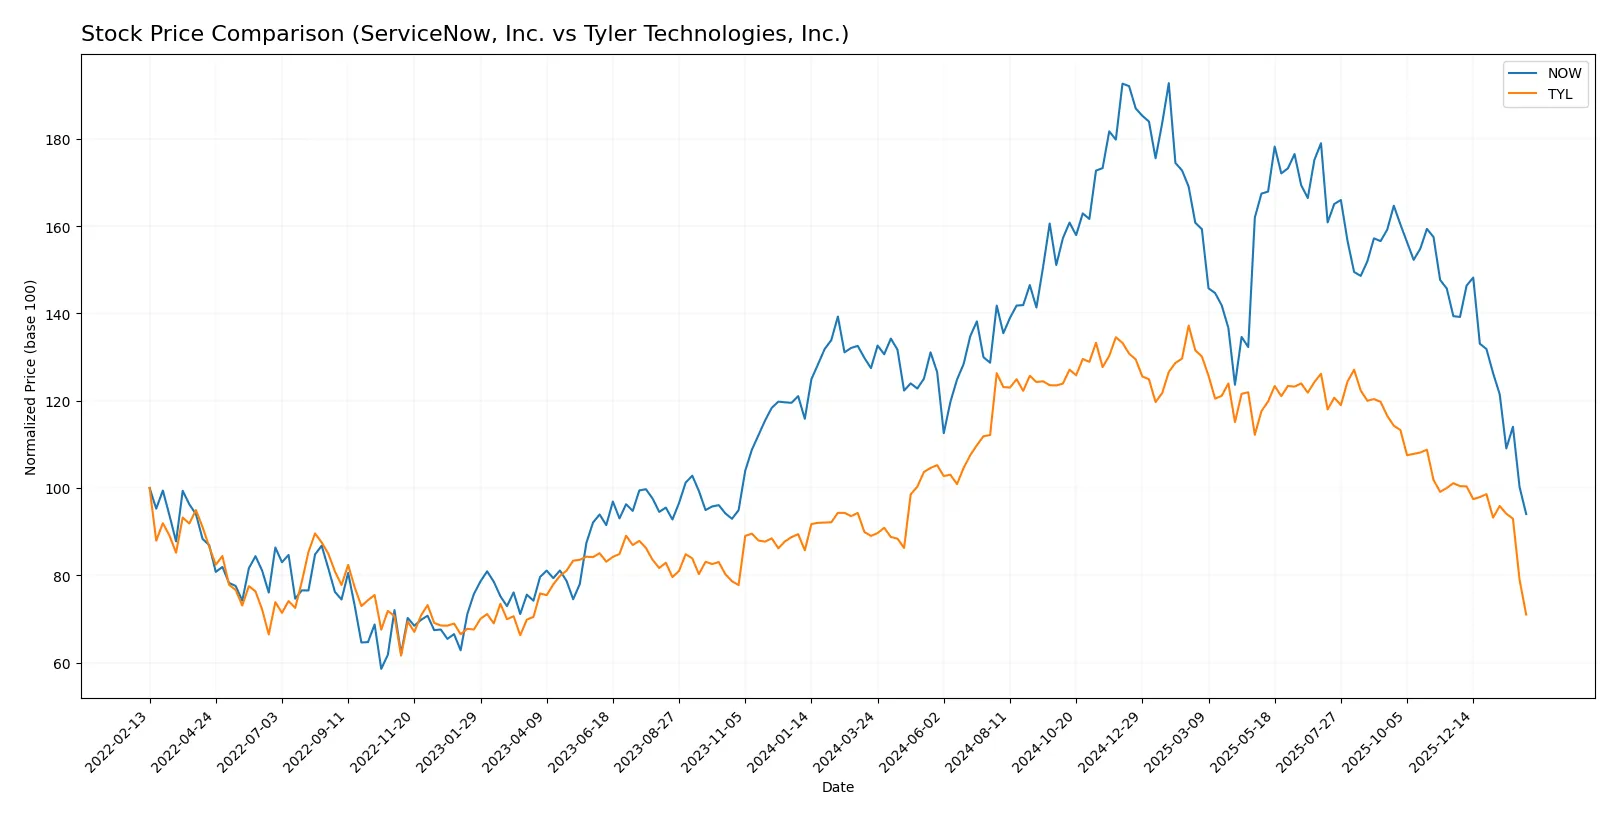
Trend Comparison
ServiceNow’s stock fell 26.22% over the past 12 months, a clear bearish trend with decelerating losses. Its price ranged between 225.0 and 109.77, showing high volatility (std dev 25.07). Recent months worsened with a 32.53% drop.
Tyler Technologies declined 20.24% over the same period, also bearish with deceleration. It exhibited greater volatility (std dev 65.55), ranging from 641.7 to 332.05. The recent trend deepened, with a 29.77% fall and sharper slope.
Tyler Technologies outperformed ServiceNow, delivering a smaller overall loss and less severe recent decline, despite higher price volatility and decelerating negative momentum.
Target Prices
Analyst consensus shows wide-ranging target prices but points to significant upside for both companies.
| Company | Target Low | Target High | Consensus |
|---|---|---|---|
| ServiceNow, Inc. | 115 | 1315 | 440.64 |
| Tyler Technologies, Inc. | 470 | 675 | 574 |
ServiceNow’s target consensus of 440.64 far exceeds its current price near 110, suggesting analysts expect a strong rebound. Tyler Technologies’ consensus target of 574 also implies substantial growth from its 332 current price.

Don’t Let Luck Decide Your Entry Point
Optimize your entry points with our advanced ProRealTime indicators. You’ll get efficient buy signals with precise price targets for maximum performance. Start outperforming now!
How do institutions grade them?
The following tables summarize recent institutional grades for ServiceNow, Inc. and Tyler Technologies, Inc.:
ServiceNow, Inc. Grades
This table shows the latest grades from recognized financial institutions for ServiceNow, Inc.
| Grading Company | Action | New Grade | Date |
|---|---|---|---|
| Citigroup | Maintain | Buy | 2026-01-30 |
| Evercore ISI Group | Maintain | Outperform | 2026-01-29 |
| Macquarie | Maintain | Neutral | 2026-01-29 |
| BTIG | Maintain | Buy | 2026-01-29 |
| RBC Capital | Maintain | Outperform | 2026-01-29 |
| Keybanc | Maintain | Underweight | 2026-01-29 |
| Stifel | Maintain | Buy | 2026-01-29 |
| DA Davidson | Maintain | Buy | 2026-01-29 |
| Cantor Fitzgerald | Maintain | Overweight | 2026-01-29 |
| Needham | Maintain | Buy | 2026-01-29 |
Tyler Technologies, Inc. Grades
This table presents the latest grades from established financial firms for Tyler Technologies, Inc.
| Grading Company | Action | New Grade | Date |
|---|---|---|---|
| Needham | Maintain | Buy | 2026-02-03 |
| DA Davidson | Maintain | Neutral | 2026-02-03 |
| Oppenheimer | Maintain | Outperform | 2026-01-23 |
| Piper Sandler | Maintain | Overweight | 2026-01-13 |
| Wells Fargo | Maintain | Equal Weight | 2026-01-08 |
| DA Davidson | Maintain | Neutral | 2025-12-09 |
| DA Davidson | Maintain | Neutral | 2025-10-31 |
| Evercore ISI Group | Maintain | In Line | 2025-10-31 |
| DA Davidson | Maintain | Neutral | 2025-10-10 |
| DA Davidson | Maintain | Neutral | 2025-08-05 |
Which company has the best grades?
ServiceNow, Inc. has received more “Buy” and “Outperform” ratings compared to Tyler Technologies, Inc., which shows more “Neutral” and “Equal Weight” grades. Investors may interpret ServiceNow’s stronger consensus as a sign of higher confidence from analysts.
Risks specific to each company
The following categories identify the critical pressure points and systemic threats facing both firms in the 2026 market environment:
1. Market & Competition
ServiceNow, Inc.
- Faces intense competition in enterprise cloud software, with high valuation pressure and innovation demands.
Tyler Technologies, Inc.
- Competes in public sector software with slower growth but stable contracts; faces valuation and market share challenges.
2. Capital Structure & Debt
ServiceNow, Inc.
- Maintains low debt-to-equity (0.25), favorable leverage, and infinite interest coverage, indicating strong debt management.
Tyler Technologies, Inc.
- Also holds low leverage (0.19 debt-to-equity) with robust interest coverage (53x), showing prudent capital structure.
3. Stock Volatility
ServiceNow, Inc.
- Exhibits moderate beta (0.978) and wide price range, reflecting sensitivity to tech sector swings.
Tyler Technologies, Inc.
- Shows slightly lower beta (0.897) but larger price range, indicating vulnerability to market fluctuations.
4. Regulatory & Legal
ServiceNow, Inc.
- Subject to global data privacy laws and cybersecurity regulations impacting cloud services.
Tyler Technologies, Inc.
- Faces public sector compliance and government procurement regulations, with legal risks in software contracts.
5. Supply Chain & Operations
ServiceNow, Inc.
- Relies heavily on cloud infrastructure partnerships, exposed to operational disruptions in tech ecosystem.
Tyler Technologies, Inc.
- Dependent on AWS cloud collaboration; operational risks tied to software deployment and public sector IT budgets.
6. ESG & Climate Transition
ServiceNow, Inc.
- Increasing pressure to improve governance and reduce carbon footprint in data centers and operations.
Tyler Technologies, Inc.
- Faces ESG scrutiny in public contracts and sustainability demands from government clients.
7. Geopolitical Exposure
ServiceNow, Inc.
- Global footprint exposes it to geopolitical tensions affecting cross-border data flow and cloud services.
Tyler Technologies, Inc.
- Primarily US-focused, limiting geopolitical risk but sensitive to federal spending shifts.
Which company shows a better risk-adjusted profile?
ServiceNow’s biggest risk is market valuation and competitive pressure in a fast-evolving cloud software sector. Tyler’s most impactful risk lies in slower growth tied to public sector dependency and price volatility. Tyler’s stronger liquidity and lower beta suggest a better risk-adjusted profile. However, ServiceNow’s higher Altman Z-score (6.6 vs. 5.8) signals solid financial stability despite valuation risks. The recent steep price drops for both call for cautious positioning.
Final Verdict: Which stock to choose?
ServiceNow’s superpower lies in its robust growth engine fueled by expanding profitability and reinvested capital. Its slightly stretched liquidity position is a point of vigilance but reflects aggressive expansion. It suits portfolios targeting aggressive growth with a tolerance for elevated valuation multiples.
Tyler Technologies commands a strategic moat through its entrenched public sector software dominance and solid recurring revenue base. It offers better liquidity and a safer financial profile relative to ServiceNow, appealing to investors favoring GARP—growth at a reasonable price—with more stability.
If you prioritize high-growth momentum and are comfortable with valuation premiums, ServiceNow outshines as a compelling choice due to its accelerating income and improving profitability. However, if you seek steadier cash flows and lower financial risk, Tyler Technologies offers better stability despite a declining profitability trend.
Disclaimer: Investment carries a risk of loss of initial capital. The past performance is not a reliable indicator of future results. Be sure to understand risks before making an investment decision.
Go Further
I encourage you to read the complete analyses of ServiceNow, Inc. and Tyler Technologies, Inc. to enhance your investment decisions: