Home > Comparison > Technology > NOW vs SNOW
The strategic rivalry between ServiceNow, Inc. and Snowflake Inc. shapes the future of enterprise software applications. ServiceNow operates as a comprehensive workflow automation powerhouse, while Snowflake specializes in cloud-based data platforms. This head-to-head pits broad operational scale against focused innovation in data management. This analysis aims to identify which company’s strategy offers superior risk-adjusted returns for a diversified portfolio in the evolving technology sector.
Table of contents
Companies Overview
ServiceNow and Snowflake are pivotal players shaping enterprise software and cloud data markets.
ServiceNow, Inc.: Workflow Automation Powerhouse
ServiceNow leads as a workflow automation platform for enterprises worldwide. It generates revenue by delivering cloud-based IT service management, security operations, and business process automation. In 2026, the company intensified its strategic focus on expanding AI-driven automation and integration capabilities, leveraging partnerships like Celonis to accelerate customer process optimization.
Snowflake Inc.: Cloud Data Platform Innovator
Snowflake stands out with its cloud-based data platform, enabling businesses to unify and analyze data across multiple environments. Its core revenue stems from subscription services on its Data Cloud, which supports data consolidation and sharing. The firm’s 2026 strategy centers on broadening its data ecosystem and enhancing multi-cloud interconnectivity to deepen customer adoption and expand market reach.
Strategic Collision: Similarities & Divergences
Both companies prioritize cloud innovation but diverge in approach: ServiceNow focuses on end-to-end workflow automation while Snowflake champions open, scalable data collaboration. Their competition intensifies in enterprise digital transformation, where integrated data and automated processes overlap. Investors face contrasting profiles—ServiceNow offers a mature, diversified SaaS model, whereas Snowflake presents high-growth potential anchored in data infrastructure expansion.
Income Statement Comparison
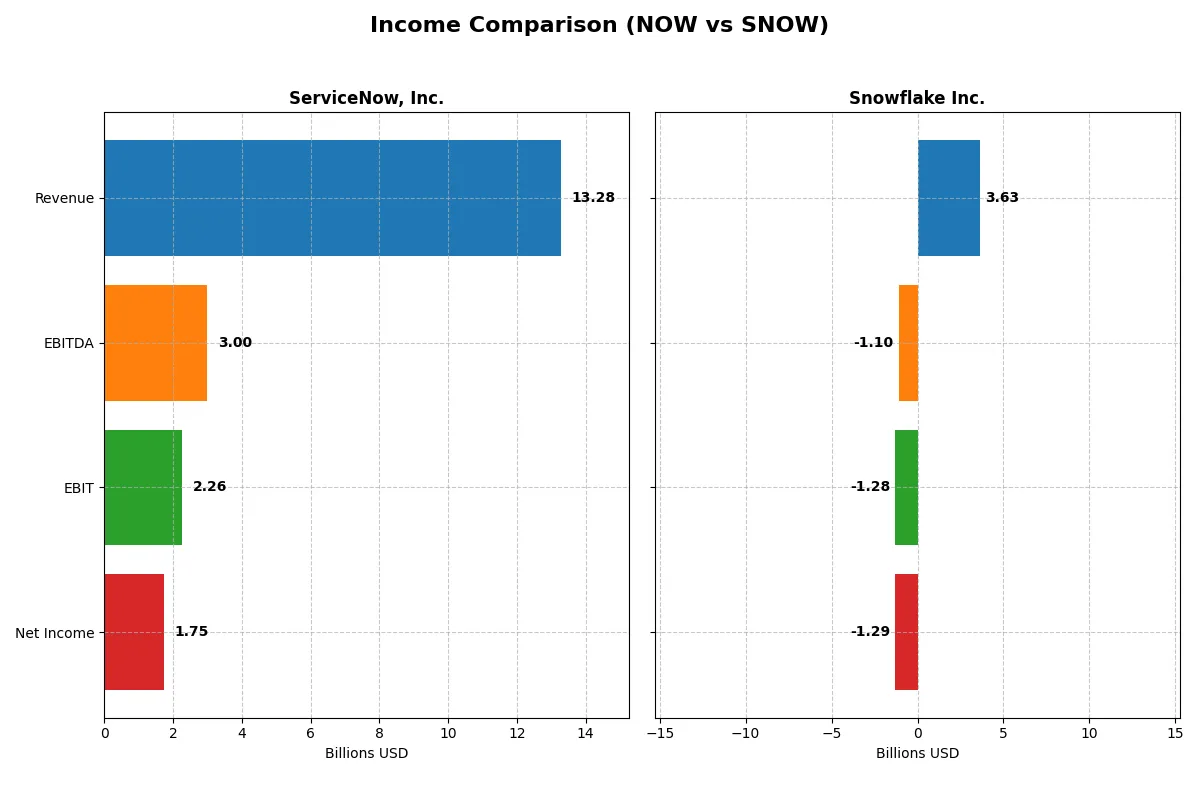
This data dissects the core profitability and scalability of both corporate engines to reveal who dominates the bottom line:
| Metric | ServiceNow, Inc. (NOW) | Snowflake Inc. (SNOW) |
|---|---|---|
| Revenue | 13.3B | 3.6B |
| Cost of Revenue | 3.0B | 1.2B |
| Operating Expenses | 8.5B | 3.9B |
| Gross Profit | 10.3B | 2.4B |
| EBITDA | 3.0B | -1.1B |
| EBIT | 2.3B | -1.3B |
| Interest Expense | 0 | 3M |
| Net Income | 1.7B | -1.3B |
| EPS | 1.69 | -3.86 |
| Fiscal Year | 2025 | 2025 |
Income Statement Analysis: The Bottom-Line Duel
This income statement comparison reveals the true efficiency and profitability of ServiceNow, Inc. and Snowflake Inc. over recent years.
ServiceNow, Inc. Analysis
ServiceNow’s revenue soared from 5.9B in 2021 to 13.3B in 2025, with net income rising sixfold to 1.75B. The company sustains robust gross margins near 77.5%, and a net margin of 13.2% in 2025, signaling strong cost control. Its EBIT margin improved sharply, reflecting operational momentum and efficient capital allocation.
Snowflake Inc. Analysis
Snowflake’s revenue expanded impressively from 592M in 2021 to 3.63B in 2025, outpacing many peers. However, it posts sustained net losses, with a negative net margin near -35.5% in 2025. Despite favorable gross margins of 66.5%, operating losses deepened, and EPS plunged, highlighting ongoing challenges in scaling profitably.
Profitability Strength vs. Growth Struggles
ServiceNow clearly outperforms Snowflake on profitability and margin sustainability. While Snowflake leads in rapid top-line growth, its persistent operating losses and negative net margins undermine earnings quality. Investors seeking solid profit generation favor ServiceNow’s efficient, margin-rich profile over Snowflake’s high-growth but unprofitable model.
Financial Ratios Comparison
These vital ratios act as a diagnostic tool to expose the underlying fiscal health, valuation premiums, and capital efficiency of the companies compared below:
| Ratios | ServiceNow (NOW) | Snowflake (SNOW) |
|---|---|---|
| ROE | 13.5% | -42.9% |
| ROIC | 9.0% | -25.2% |
| P/E | 90.9 | -47.0 |
| P/B | 12.3 | 20.1 |
| Current Ratio | 0.95 | 1.75 |
| Quick Ratio | 0.95 | 1.75 |
| D/E | 0.25 | 0.90 |
| Debt-to-Assets | 12.3% | 29.7% |
| Interest Coverage | 0 | -528 |
| Asset Turnover | 0.51 | 0.40 |
| Fixed Asset Turnover | 4.29 | 5.53 |
| Payout ratio | 0% | 0% |
| Dividend yield | 0% | 0% |
| Fiscal Year | 2025 | 2025 |
Efficiency & Valuation Duel: The Vital Signs
Financial ratios serve as a company’s DNA, uncovering hidden risks and revealing operational strengths that shape investment decisions.
ServiceNow, Inc.
ServiceNow shows solid profitability with a 13.5% ROE and a favorable 13.2% net margin, signaling operational efficiency. However, its valuation appears stretched, marked by a high P/E of 90.9 and P/B of 12.3. The company returns no dividends, reinvesting heavily in R&D to fuel growth, reflecting a long-term value creation strategy.
Snowflake Inc.
Snowflake struggles with deeply negative profitability: a -42.9% ROE and -35.5% net margin indicate operational challenges. Its valuation is mixed, with a negative P/E but an expensive P/B of 20.1. Snowflake does not pay dividends, prioritizing aggressive R&D spending, which underscores a high-risk, growth-focused profile amid ongoing losses.
Premium Valuation vs. Operational Safety
ServiceNow balances moderate profitability and a stretched valuation, while Snowflake exhibits weak profitability despite high growth investment. ServiceNow offers a more stable risk-reward profile. Investors seeking operational safety may prefer ServiceNow; those targeting growth at high risk may consider Snowflake.
Which one offers the Superior Shareholder Reward?
ServiceNow (NOW) and Snowflake (SNOW) both forgo dividends, focusing shareholder returns on growth and buybacks. NOW delivers stronger free cash flow per share (~4.4 vs. 2.7 for SNOW) and maintains a moderate buyback strategy, reflecting healthier operating cash flow coverage (~1.7 vs. 0.36). SNOW’s heavy reinvestment in growth burdens profitability, indicated by negative net margins and negative EBIT margins. NOW’s capital allocation balances growth with shareholder returns more sustainably. I conclude NOW offers a superior total return profile for 2026 investors, blending cash generation and prudent buybacks.
Comparative Score Analysis: The Strategic Profile
The radar chart reveals the fundamental DNA and trade-offs of ServiceNow, Inc. and Snowflake Inc., highlighting their distinct financial and valuation patterns:
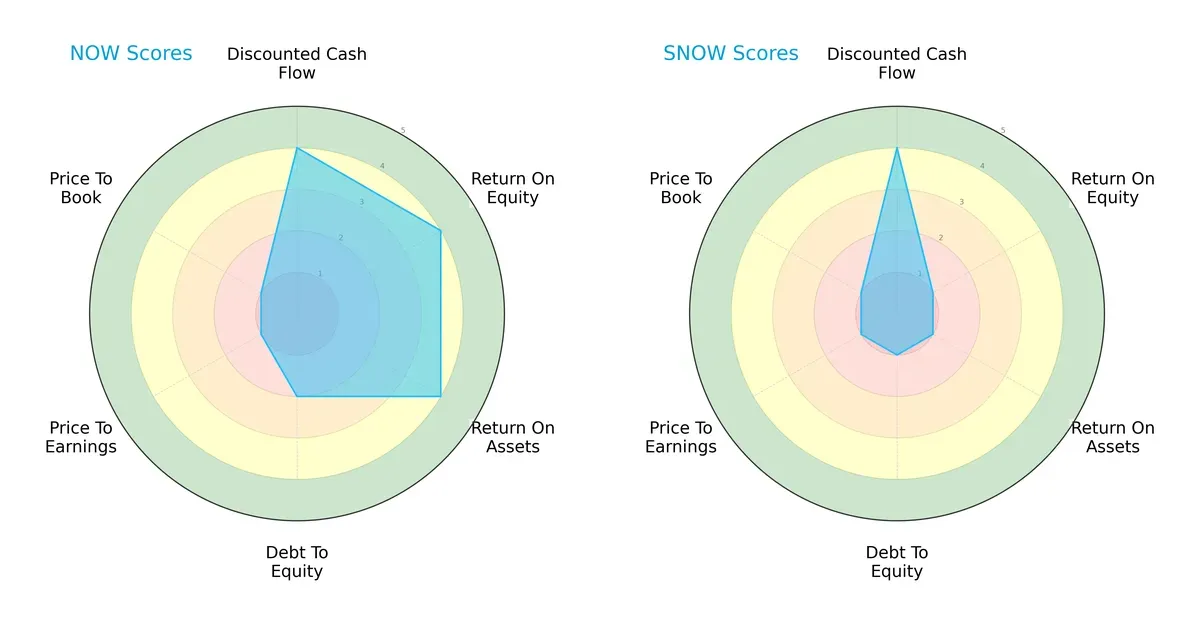
ServiceNow exhibits a balanced strength in DCF, ROE, and ROA scores, reflecting efficient asset and equity utilization. However, its moderate debt-to-equity and very unfavorable valuation scores signal caution. Snowflake matches ServiceNow’s DCF score but trails sharply in profitability and leverage metrics, relying heavily on growth prospects without financial stability. Overall, ServiceNow offers a more balanced profile while Snowflake depends on a singular valuation edge.
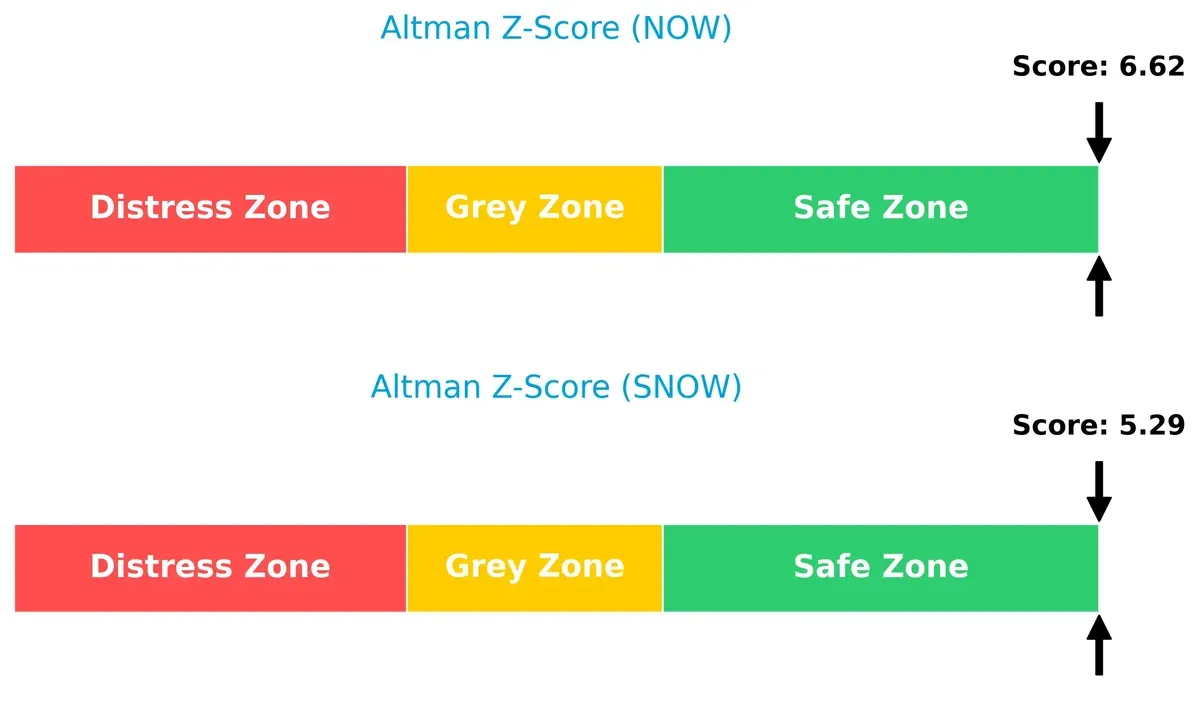
Bankruptcy Risk: Solvency Showdown
ServiceNow’s Altman Z-Score of 6.62 surpasses Snowflake’s 5.29, signaling superior solvency and a lower bankruptcy risk in the current market cycle:
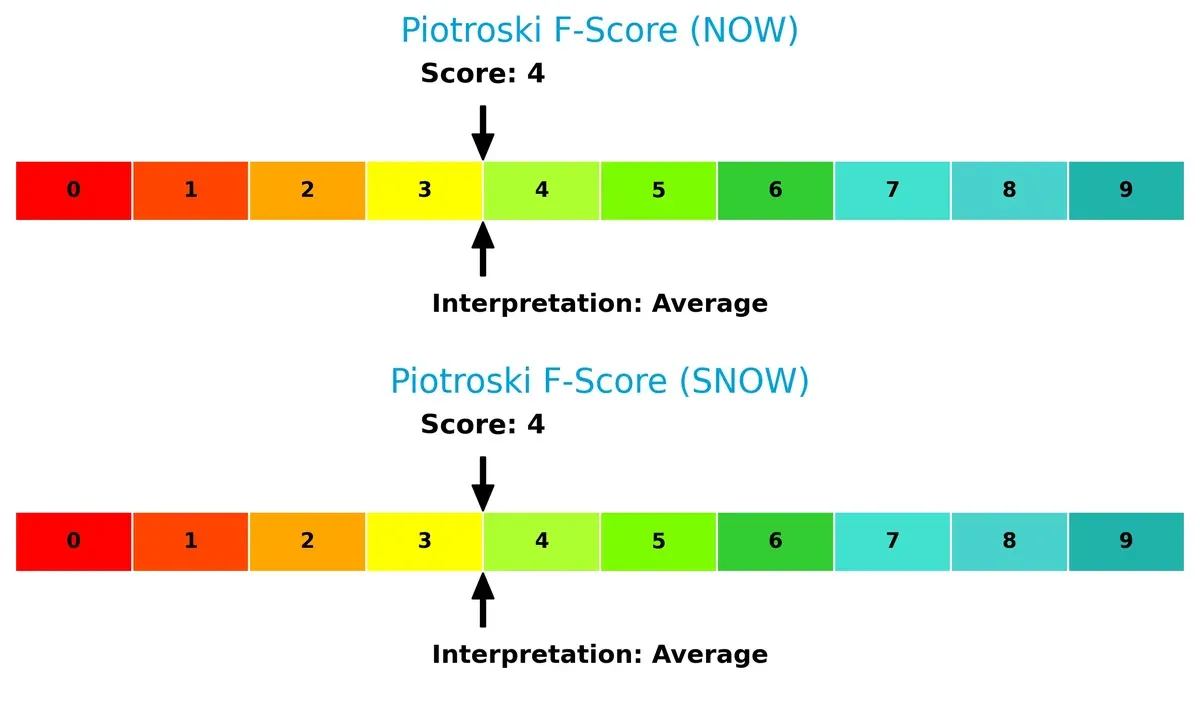
Financial Health: Quality of Operations
Both companies score a 4 on the Piotroski F-Score, indicating average financial health. Neither shows critical red flags, but neither excels in operational quality either:
How are the two companies positioned?
This section dissects the operational DNA of ServiceNow and Snowflake by comparing their revenue distribution and internal dynamics. The goal is to confront their economic moats and identify which model offers the most resilient competitive advantage today.
Revenue Segmentation: The Strategic Mix
This visual comparison dissects how ServiceNow and Snowflake diversify their income streams and where their primary sector bets lie:
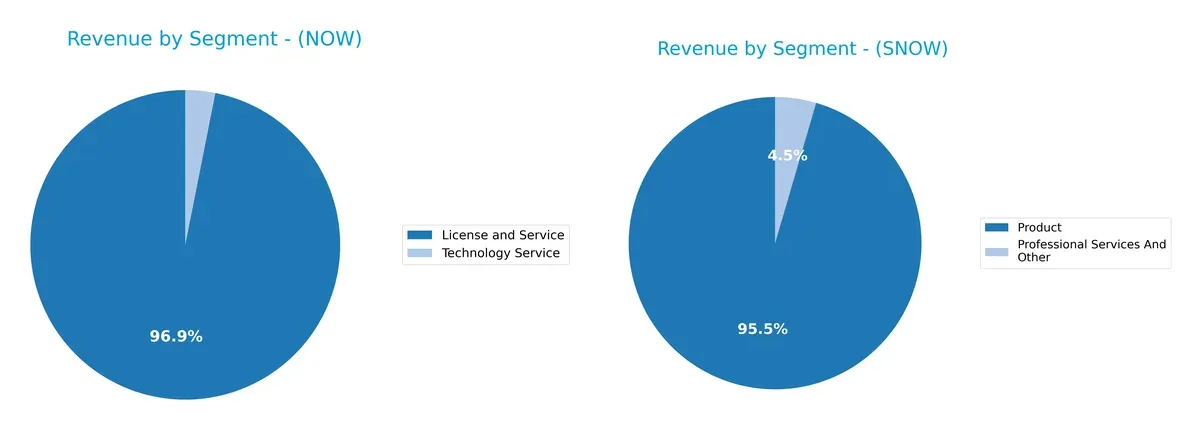
ServiceNow dwarfs Snowflake in total revenue, anchored by $12.9B in License and Service, with a minor $414M Technology Service slice. Snowflake’s $3.46B Product revenue dominates its mix, with a small $164M Professional Services segment. ServiceNow’s heavy reliance on License and Service signals ecosystem lock-in, while Snowflake’s narrower focus on Product highlights concentration risk but underscores infrastructure dominance in cloud data.
Strengths and Weaknesses Comparison
This table compares the strengths and weaknesses of ServiceNow and Snowflake based on diversification, profitability, financials, innovation, global presence, and market share:
ServiceNow Strengths
- Strong revenue growth in License and Service segments
- Favorable debt-to-equity and interest coverage
- High fixed asset turnover
- Growing global presence across North America, EMEA, Asia Pacific
Snowflake Strengths
- Favorable current and quick ratios indicate good liquidity
- Favorable debt-to-assets ratio supports financial stability
- High fixed asset turnover
- Expanding product revenue and professional services
ServiceNow Weaknesses
- Unfavorable valuation multiples (PE, PB)
- Current ratio below 1 signals liquidity risk
- No dividend yield
- Neutral profitability ratios (ROE, ROIC)
- High PE suggests market expectations pressure
Snowflake Weaknesses
- Negative profitability metrics (net margin, ROE, ROIC)
- Unfavorable interest coverage with negative value
- Unfavorable asset turnover
- High PB ratio and no dividend yield
- Greater proportion of unfavorable ratios overall
ServiceNow’s strengths lie in solid operational metrics and manageable leverage, though valuation and liquidity raise caution. Snowflake shows liquidity strength but struggles with profitability and coverage metrics, reflecting challenges in translating growth into earnings.
The Moat Duel: Analyzing Competitive Defensibility
A structural moat is the only protection for long-term profits against relentless competition erosion. Let’s examine two tech giants’ moats in 2026:
ServiceNow, Inc.: Workflow Automation Lock-in
ServiceNow’s moat stems from high switching costs via its Now Platform, deeply embedded in enterprise IT workflows. This drives stable 77.5% gross margins and growing ROIC, signaling improving capital efficiency. Expansion into AI-enhanced automation promises to deepen its competitive edge further.
Snowflake Inc.: Data Cloud Network Effects
Snowflake leverages network effects by consolidating enterprise data into its cloud platform, creating a data-sharing ecosystem. However, it struggles with negative EBIT margins and declining ROIC, reflecting challenges in converting growth into profit. Opportunities lie in international market expansion and product diversification.
Workflow Automation Lock-in vs. Data Cloud Network Effects
ServiceNow’s slightly favorable moat contrasts sharply with Snowflake’s very unfavorable moat. ServiceNow’s improving profitability and capital efficiency indicate a deeper moat. Snowflake’s value destruction and shrinking ROIC weaken its competitive defenses. ServiceNow is better positioned to defend market share in 2026.
Which stock offers better returns?
Over the past 12 months, ServiceNow, Inc. shares declined sharply, while Snowflake Inc. posted moderate gains, despite both experiencing recent downward pressure in trading dynamics.
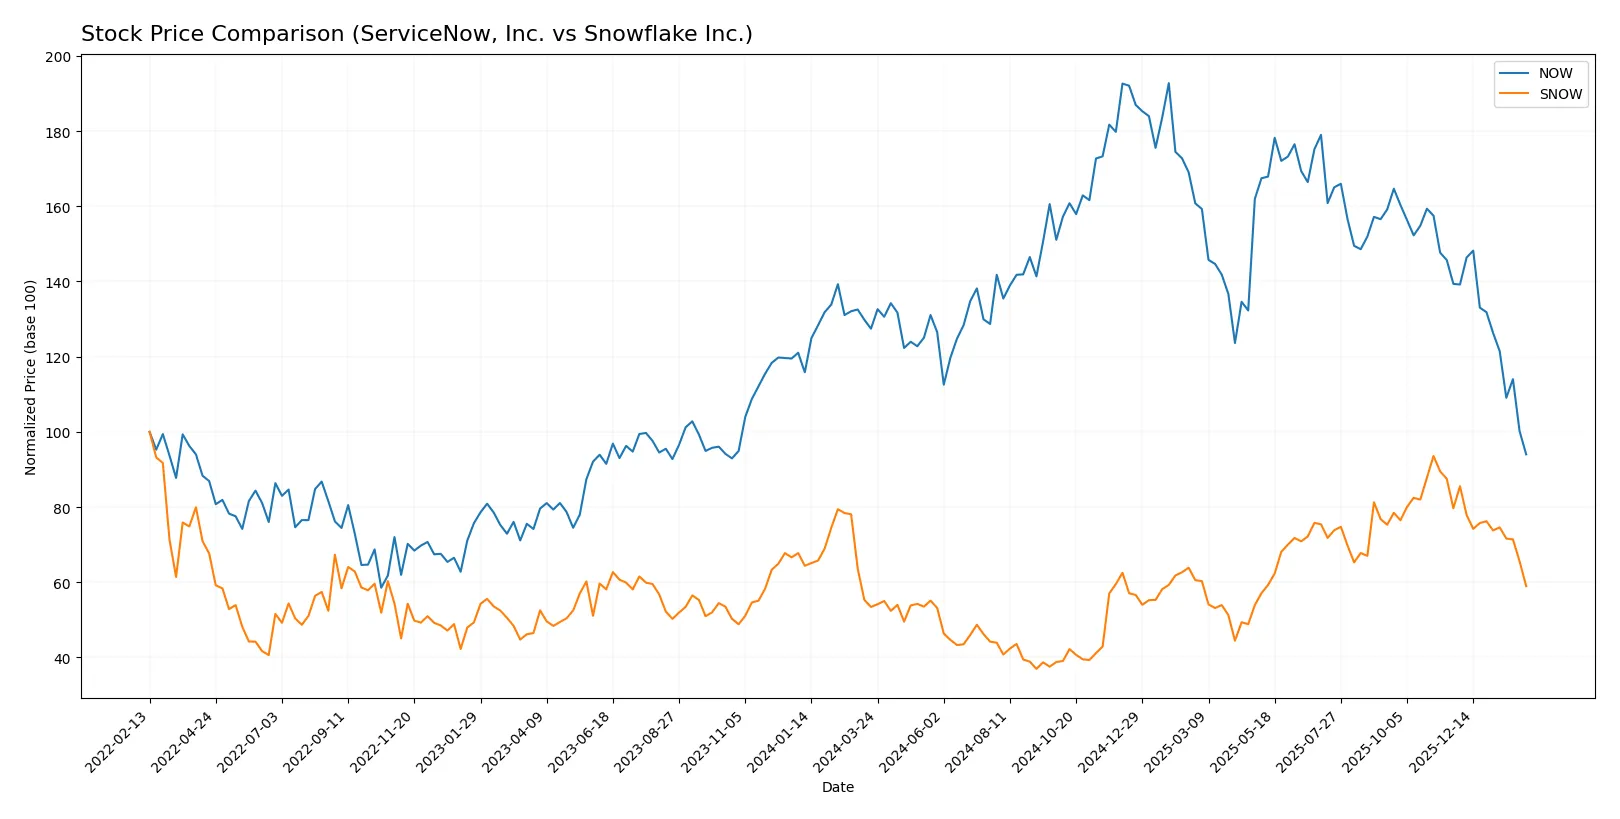
Trend Comparison
ServiceNow, Inc. stock fell 26.22% over the past year, marking a bearish trend with decelerating losses. It peaked at $225.0 and bottomed at $109.77.
Snowflake Inc. shares gained 10.37% over the same period, reflecting a bullish but decelerating trend. The price ranged between $108.56 and $274.88.
Snowflake delivered higher market returns versus ServiceNow, despite both stocks facing recent declines between late 2025 and early 2026.
Target Prices
Analysts present a wide range of targets for these tech leaders, reflecting diverse outlooks.
| Company | Target Low | Target High | Consensus |
|---|---|---|---|
| ServiceNow, Inc. | 115 | 1315 | 440.64 |
| Snowflake Inc. | 237 | 325 | 281.86 |
ServiceNow’s consensus target of 440.64 implies significant upside from its current 109.77 price. Snowflake’s consensus at 281.86 suggests a strong growth expectation above today’s 173.24 price.

Don’t Let Luck Decide Your Entry Point
Optimize your entry points with our advanced ProRealTime indicators. You’ll get efficient buy signals with precise price targets for maximum performance. Start outperforming now!
How do institutions grade them?
ServiceNow, Inc. Grades
The following table summarizes recent grades from leading financial institutions for ServiceNow, Inc.:
| Grading Company | Action | New Grade | Date |
|---|---|---|---|
| Citigroup | Maintain | Buy | 2026-01-30 |
| Evercore ISI Group | Maintain | Outperform | 2026-01-29 |
| Macquarie | Maintain | Neutral | 2026-01-29 |
| BTIG | Maintain | Buy | 2026-01-29 |
| RBC Capital | Maintain | Outperform | 2026-01-29 |
| Keybanc | Maintain | Underweight | 2026-01-29 |
| Stifel | Maintain | Buy | 2026-01-29 |
| DA Davidson | Maintain | Buy | 2026-01-29 |
| Cantor Fitzgerald | Maintain | Overweight | 2026-01-29 |
| Needham | Maintain | Buy | 2026-01-29 |
Snowflake Inc. Grades
Below is the recent grading data from reputable institutions for Snowflake Inc.:
| Grading Company | Action | New Grade | Date |
|---|---|---|---|
| DA Davidson | Maintain | Buy | 2026-01-30 |
| Morgan Stanley | Maintain | Overweight | 2026-01-27 |
| Barclays | Downgrade | Equal Weight | 2026-01-12 |
| Argus Research | Upgrade | Buy | 2026-01-08 |
| Citigroup | Maintain | Buy | 2025-12-08 |
| Keybanc | Maintain | Overweight | 2025-12-04 |
| Needham | Maintain | Buy | 2025-12-04 |
| Cantor Fitzgerald | Maintain | Overweight | 2025-12-04 |
| Stifel | Maintain | Buy | 2025-12-04 |
| BTIG | Maintain | Buy | 2025-12-04 |
Which company has the best grades?
ServiceNow holds a broader consensus of “Buy” and “Outperform” ratings, while Snowflake shows mixed signals with a notable downgrade to “Equal Weight.” ServiceNow’s stronger grades may signal more institutional confidence, potentially affecting investor sentiment.
Risks specific to each company
The following categories identify the critical pressure points and systemic threats facing both firms in the 2026 market environment:
1. Market & Competition
ServiceNow, Inc.
- Faces intense competition in enterprise cloud software with pressure on pricing and innovation.
Snowflake Inc.
- Competes in a rapidly evolving cloud data platform market with high customer acquisition costs and competitive pressure.
2. Capital Structure & Debt
ServiceNow, Inc.
- Maintains a conservative debt-to-equity ratio of 0.25, signaling low financial risk.
Snowflake Inc.
- Higher leverage with a debt-to-equity ratio near 0.9, increasing financial vulnerability.
3. Stock Volatility
ServiceNow, Inc.
- Beta close to 1.0 (0.978), indicating market-level volatility.
Snowflake Inc.
- Higher beta at 1.15, revealing greater stock price sensitivity to market swings.
4. Regulatory & Legal
ServiceNow, Inc.
- Operates globally, subject to data privacy and cybersecurity regulations, with strong compliance focus.
Snowflake Inc.
- Also faces stringent regulatory scrutiny, especially regarding data security and cross-border data flow.
5. Supply Chain & Operations
ServiceNow, Inc.
- Relies on robust cloud infrastructure partnerships; operational efficiency is stable.
Snowflake Inc.
- Dependent on cloud providers and data center availability, with some operational leverage risks.
6. ESG & Climate Transition
ServiceNow, Inc.
- Increasingly integrates ESG goals into business strategy; moderate exposure to climate risks.
Snowflake Inc.
- ESG initiatives progressing but faces challenges due to high energy consumption in data processing.
7. Geopolitical Exposure
ServiceNow, Inc.
- Exposure to US-China tensions and global trade uncertainties due to international operations.
Snowflake Inc.
- Similar geopolitical risks, with additional sensitivity due to data sovereignty laws in key markets.
Which company shows a better risk-adjusted profile?
ServiceNow’s conservative leverage and stable profitability provide a safer financial footing. Snowflake’s elevated debt and negative margins heighten risk, despite strong growth potential. The most impactful risk for ServiceNow is market competition compressing margins. For Snowflake, it is capital structure stress amid operating losses. ServiceNow’s lower beta and higher Altman Z-Score reinforce its better risk-adjusted profile in 2026.
Final Verdict: Which stock to choose?
ServiceNow, Inc. (NOW) excels as a cash-generating powerhouse with steadily improving profitability and a growing ROIC, signaling increasing operational efficiency. Its main point of vigilance is a weak current ratio, which suggests liquidity constraints. NOW suits investors targeting aggressive growth with tolerance for near-term balance sheet risks.
Snowflake Inc. (SNOW) commands a strategic moat through cloud data platform dominance and recurring revenue streams, offering a safer liquidity profile than NOW. However, it currently struggles with profitability and declining returns on invested capital. SNOW fits investors focused on growth at a reasonable price, accepting volatility for long-term market leadership.
If you prioritize consistent cash generation and improving profitability, ServiceNow outshines Snowflake due to its operational strength and margin growth. However, if you seek exposure to cloud innovation with better liquidity safety, Snowflake offers superior strategic moat despite current profitability challenges. Both present distinct analytical scenarios depending on your risk tolerance and growth horizon.
Disclaimer: Investment carries a risk of loss of initial capital. The past performance is not a reliable indicator of future results. Be sure to understand risks before making an investment decision.
Go Further
I encourage you to read the complete analyses of ServiceNow, Inc. and Snowflake Inc. to enhance your investment decisions: