Home > Comparison > Technology > SHOP vs NOW
The strategic rivalry between Shopify Inc. and ServiceNow, Inc. shapes the trajectory of the technology sector. Shopify operates as a commerce platform enabling merchants to sell across multiple channels, emphasizing scalability and merchant services. In contrast, ServiceNow focuses on enterprise cloud software automating workflow and IT service management with broad industry applications. This analysis will clarify which business model delivers superior risk-adjusted returns for a diversified portfolio in an evolving digital economy.

Table of contents
Companies Overview
Shopify Inc. and ServiceNow, Inc. stand as pivotal innovators in the technology sector, shaping digital commerce and enterprise automation.
Shopify Inc.: Commerce Platform Powerhouse
Shopify dominates as a commerce platform provider enabling merchants worldwide to sell across web, mobile, social, and physical channels. Its core revenue stems from subscription solutions and merchant services like payments and fulfillment. In 2026, Shopify sharply focuses on expanding its ecosystem to boost merchant success through enhanced analytics and financing options.
ServiceNow, Inc.: Enterprise Workflow Automator
ServiceNow leads in enterprise cloud computing by delivering workflow automation and IT service management solutions globally. Its revenue engine revolves around subscription licenses for its Now platform, integrating AI, machine learning, and automation tools. The company’s 2026 strategy targets deepening automation capabilities and expanding partnerships to streamline complex enterprise processes.
Strategic Collision: Similarities & Divergences
Both companies leverage software to empower customers, yet Shopify centers on open commerce ecosystems while ServiceNow builds closed enterprise workflow platforms. Their primary battleground is digital transformation—Shopify in retail commerce, ServiceNow in IT and operations automation. Investors face distinct profiles: Shopify’s growth hinges on merchant expansion, ServiceNow’s on enterprise digital adoption.
Income Statement Comparison
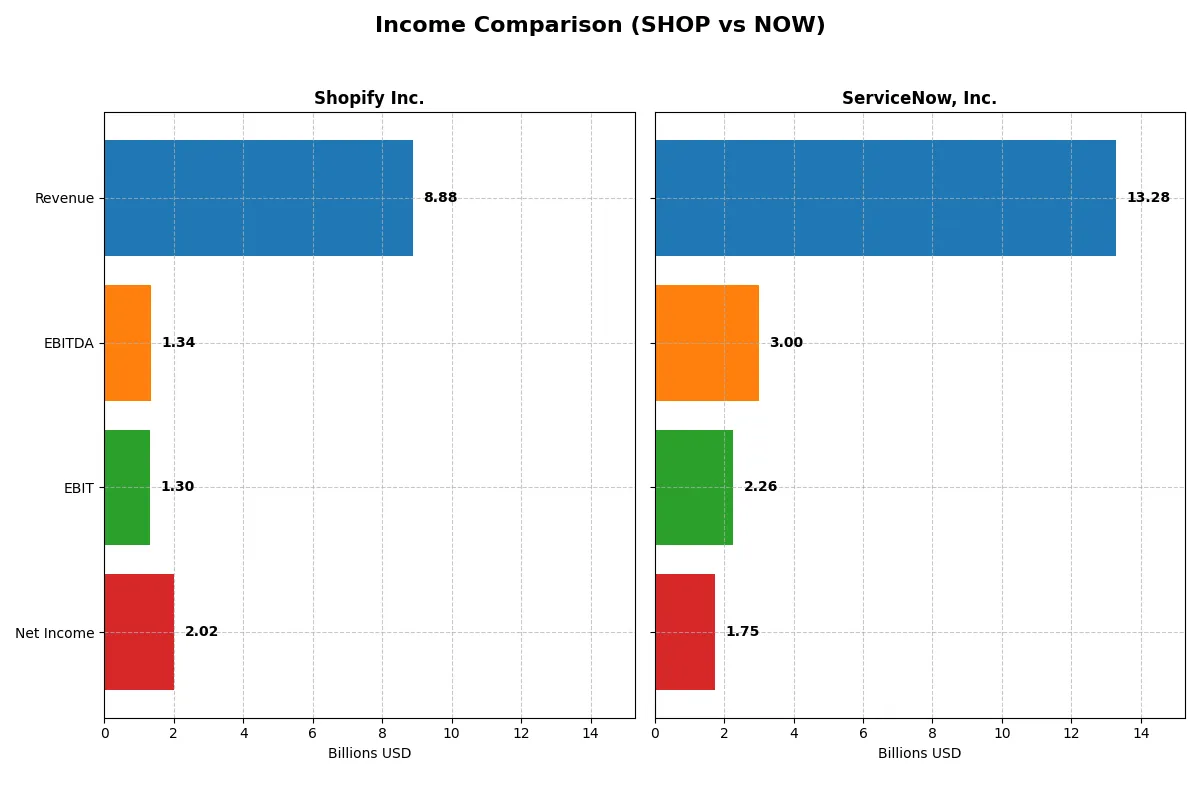
This data dissects the core profitability and scalability of both corporate engines to reveal who dominates the bottom line:
| Metric | Shopify Inc. (SHOP) | ServiceNow, Inc. (NOW) |
|---|---|---|
| Revenue | 8.88B | 13.28B |
| Cost of Revenue | 4.41B | 2.98B |
| Operating Expenses | 3.40B | 8.47B |
| Gross Profit | 4.47B | 10.30B |
| EBITDA | 1.34B | 3.00B |
| EBIT | 1.30B | 2.26B |
| Interest Expense | 0 | 0 |
| Net Income | 2.02B | 1.75B |
| EPS | 1.56 | 1.69 |
| Fiscal Year | 2024 | 2025 |
Income Statement Analysis: The Bottom-Line Duel
This income statement comparison reveals which company converts revenue into profit with superior efficiency and sustainable momentum.
Shopify Inc. Analysis
Shopify’s revenue surged from 2.9B in 2020 to 8.9B in 2024, reflecting strong growth momentum. Net income swung from a 3.5B loss in 2022 to a 2.0B profit in 2024, signaling a powerful turnaround. Gross and net margins improved to 50.4% and 22.7%, respectively, demonstrating enhanced operational efficiency and margin expansion.
ServiceNow, Inc. Analysis
ServiceNow grew revenue steadily from 5.9B in 2021 to 13.3B in 2025. Net income increased from 230M to 1.75B over this period, maintaining consistent profitability. Gross margin remains robust at 77.5%, with net margin at 13.2%, reflecting strong pricing power and cost control. EBIT and EPS growth confirm healthy operational momentum.
Margin Efficiency vs. Growth Momentum
Shopify leads in net margin and recent profit acceleration, showcasing a dramatic recovery with improving cost structure. ServiceNow outpaces in gross margin and scale, delivering steadier revenue and profit growth. Investors seeking rapid margin expansion may favor Shopify, while those prioritizing consistent scale and profitability may lean toward ServiceNow.
Financial Ratios Comparison
These vital ratios act as a diagnostic tool to expose the underlying fiscal health, valuation premiums, and capital efficiency of the companies compared:
| Ratios | Shopify Inc. (SHOP) | ServiceNow, Inc. (NOW) |
|---|---|---|
| ROE | 17.5% | 13.5% |
| ROIC | 7.5% | 9.0% |
| P/E | 68.2 | 90.9 |
| P/B | 11.9 | 12.3 |
| Current Ratio | 3.71 | 0.95 |
| Quick Ratio | 3.70 | 0.95 |
| D/E (Debt-to-Equity) | 0.10 | 0.25 |
| Debt-to-Assets | 8.1% | 12.3% |
| Interest Coverage | 0 | 0 |
| Asset Turnover | 0.64 | 0.51 |
| Fixed Asset Turnover | 63.4 | 4.29 |
| Payout Ratio | 0 | 0 |
| Dividend Yield | 0 | 0 |
| Fiscal Year | 2024 | 2025 |
Efficiency & Valuation Duel: The Vital Signs
Financial ratios act as a company’s DNA, unveiling hidden risks and operational strengths that shape investment outcomes.
Shopify Inc.
Shopify posts a strong ROE of 17.47% and a favorable net margin of 22.74%, signaling solid profitability. However, its P/E ratio is stretched at 68.18, reflecting expensive valuation. The company reinvests heavily in R&D, with no dividends, indicating a growth-focused capital allocation strategy despite some liquidity concerns.
ServiceNow, Inc.
ServiceNow delivers a respectable ROE of 13.48% and a net margin of 13.16%, showing efficient operations but lower profitability than Shopify. Its P/E ratio of 90.88 appears stretched, suggesting overvaluation risks. The firm also eschews dividends, opting to fuel growth via R&D investments, balancing innovation with moderate leverage.
Premium Valuation vs. Operational Safety
Shopify offers higher profitability but at a costly valuation and with liquidity red flags. ServiceNow trades even more expensively but maintains steadier capital structure metrics. Investors seeking growth might prefer Shopify’s returns; those valuing operational safety could lean toward ServiceNow’s marginally safer profile.
Which one offers the Superior Shareholder Reward?
Shopify Inc. (SHOP) and ServiceNow, Inc. (NOW) both skip dividends, focusing on growth and buybacks. Shopify shows zero dividend yield and payout, reinvesting heavily in R&D and expansion. Its buyback program is modest but growing. ServiceNow also pays no dividend but executes more intense buybacks, supported by stronger free cash flow margins (84% FCF to operating cash flow) and higher profitability. Shopify’s payout ratio is zero, reflecting reinvestment priority, while NOW’s buybacks enhance shareholder value directly. Considering sustainability, NOW’s superior operating margins and disciplined capital allocation suggest a more attractive total return profile in 2026. I favor ServiceNow for stronger shareholder reward via buybacks and durable cash flow generation.
Comparative Score Analysis: The Strategic Profile
The radar chart reveals the fundamental DNA and trade-offs of Shopify Inc. and ServiceNow, Inc., highlighting their operational strengths and valuation challenges:
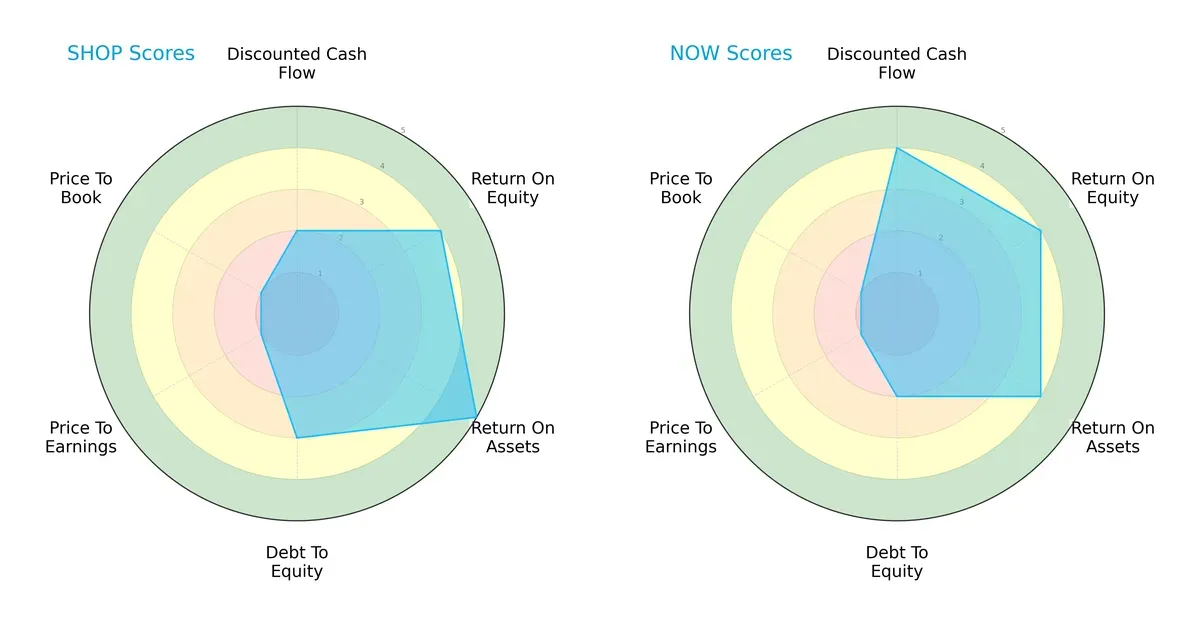
Shopify shows superior asset efficiency (ROA 5 vs. 4) and better equity returns (ROE equal at 4), but ServiceNow leads in discounted cash flow (DCF 4 vs. 2). Shopify carries moderately higher financial risk (Debt/Equity 3 vs. 2). Both suffer from very unfavorable valuation scores (P/E and P/B at 1). ServiceNow presents a more balanced profile, while Shopify relies on operational efficiency as its edge.
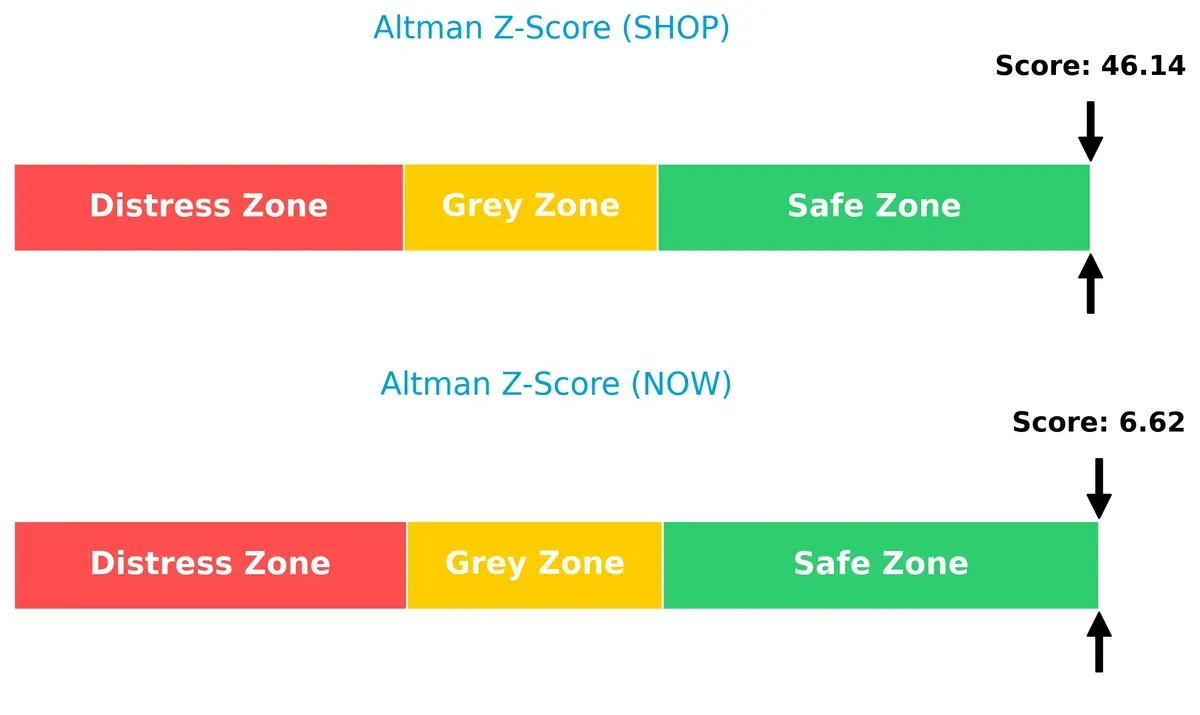
Bankruptcy Risk: Solvency Showdown
Shopify’s Altman Z-Score of 46.1 versus ServiceNow’s 6.6 places both comfortably in the safe zone, but Shopify’s extraordinary margin suggests stronger long-term survival resilience in this cycle:
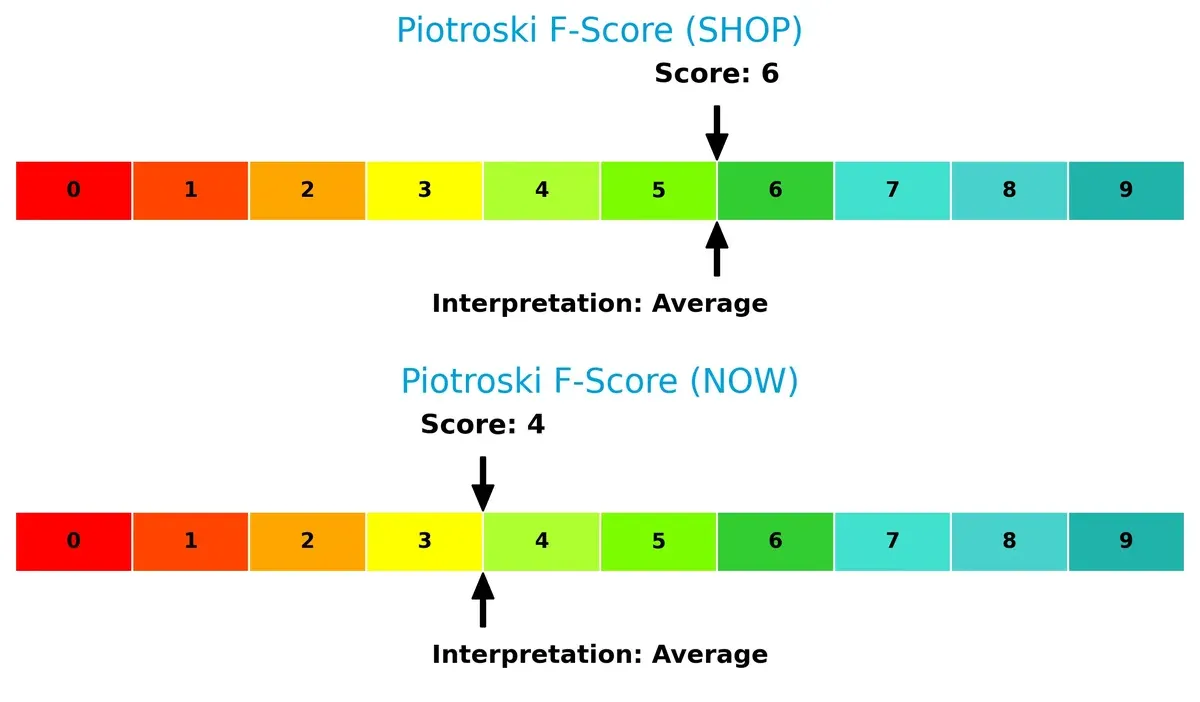
Financial Health: Quality of Operations
Shopify’s Piotroski F-Score of 6 outperforms ServiceNow’s 4, indicating better internal financial health. Neither is in peak shape, but ServiceNow shows more red flags in profitability and efficiency metrics:
How are the two companies positioned?
This section dissects the operational DNA of Shopify and ServiceNow by comparing their revenue distribution and internal dynamics. The goal is to confront their economic moats to reveal which model offers a more resilient, sustainable competitive edge today.
Revenue Segmentation: The Strategic Mix
This comparison dissects how Shopify Inc. and ServiceNow, Inc. diversify their income streams and reveals where each company places its primary sector bets:
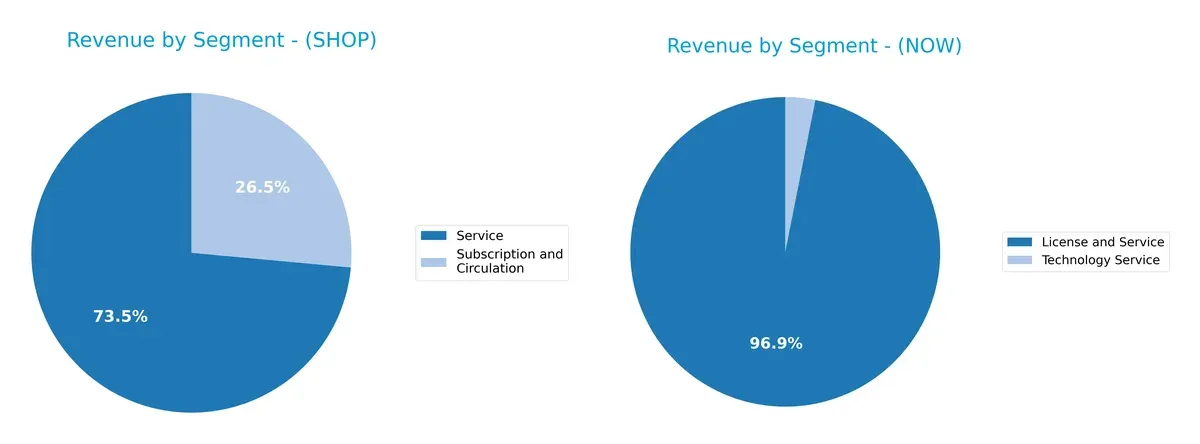
Shopify anchors its revenue in Merchant Solutions, generating $6.5B in 2024, complemented by $2.35B from Subscription services. This mix shows moderate diversification but heavy reliance on merchant transaction fees. ServiceNow dwarfs Shopify with $12.9B mainly from License and Service, and a smaller $414M from Technology Services, indicating a strong focus on enterprise software licensing. Shopify faces concentration risk in payments, while ServiceNow capitalizes on infrastructure dominance in digital workflows.
Strengths and Weaknesses Comparison
This table compares the Strengths and Weaknesses of Shopify Inc. and ServiceNow, Inc.:
Shopify Inc. Strengths
- Strong net margin at 22.74%
- High ROE at 17.47%
- Very low debt-to-equity at 0.1
- High fixed asset turnover of 63.43
- Solid quick ratio at 3.7
- Diverse revenue streams including services and subscriptions
- Large US market presence of 5.4B USD
ServiceNow, Inc. Strengths
- Favorable net margin at 13.16%
- Interest coverage infinite
- Moderate debt-to-equity at 0.25
- High fixed asset turnover of 4.29
- Significant global presence with 8.3B USD in North America
- Revenue driven by License and Service products totaling 12.9B USD
Shopify Inc. Weaknesses
- WACC at 17.05% exceeds ROIC at 7.55%, indicating poor capital efficiency
- Overvalued with PE of 68.18 and PB of 11.91
- High current ratio at 3.71 may signal inefficient asset use
- Zero dividend yield
- Neutral asset turnover at 0.64
ServiceNow, Inc. Weaknesses
- High PE of 90.88 and PB of 12.25 suggest stretched valuation
- Low current ratio at 0.95 raises liquidity concerns
- Zero dividend yield
- Neutral ROE at 13.48% and neutral ROIC at 8.98% suggest moderate profitability
- Neutral quick ratio at 0.95
Overall, Shopify demonstrates strong profitability and liquidity but faces capital efficiency and valuation challenges. ServiceNow shows solid revenue scale and interest coverage yet contends with liquidity constraints and high valuation multiples. These factors shape each company’s strategic focus on balancing growth with financial discipline.
The Moat Duel: Analyzing Competitive Defensibility
A structural moat is the only true shield preserving long-term profits against relentless competitive erosion in dynamic markets:
Shopify Inc.: Platform Ecosystem Moat
Shopify’s moat stems from powerful network effects connecting merchants and buyers. Its high revenue growth and margin stability reflect strong platform economics. Expansion into global markets in 2026 could deepen this advantage but rising competition remains a threat.
ServiceNow, Inc.: Workflow Automation Moat
ServiceNow relies on workflow automation and IT integration as its moat, differing from Shopify’s merchant-centric platform. It commands higher gross margins and steadily growing ROIC, signaling efficient capital use. Continued AI integration and enterprise adoption may widen its moat further.
Moat Battle: Network Effects vs. Automation Efficiency
Shopify’s platform ecosystem offers a broader moat through extensive merchant networks, yet weak ROIC relative to WACC signals value destruction risk. ServiceNow shows a narrower but deeper moat with improving ROIC and superior margin efficiency, positioning it better to defend market share in 2026.
Which stock offers better returns?
The past year saw Shopify Inc. soar with strong gains, while ServiceNow, Inc. declined notably, reflecting contrasting trading dynamics and market sentiment.
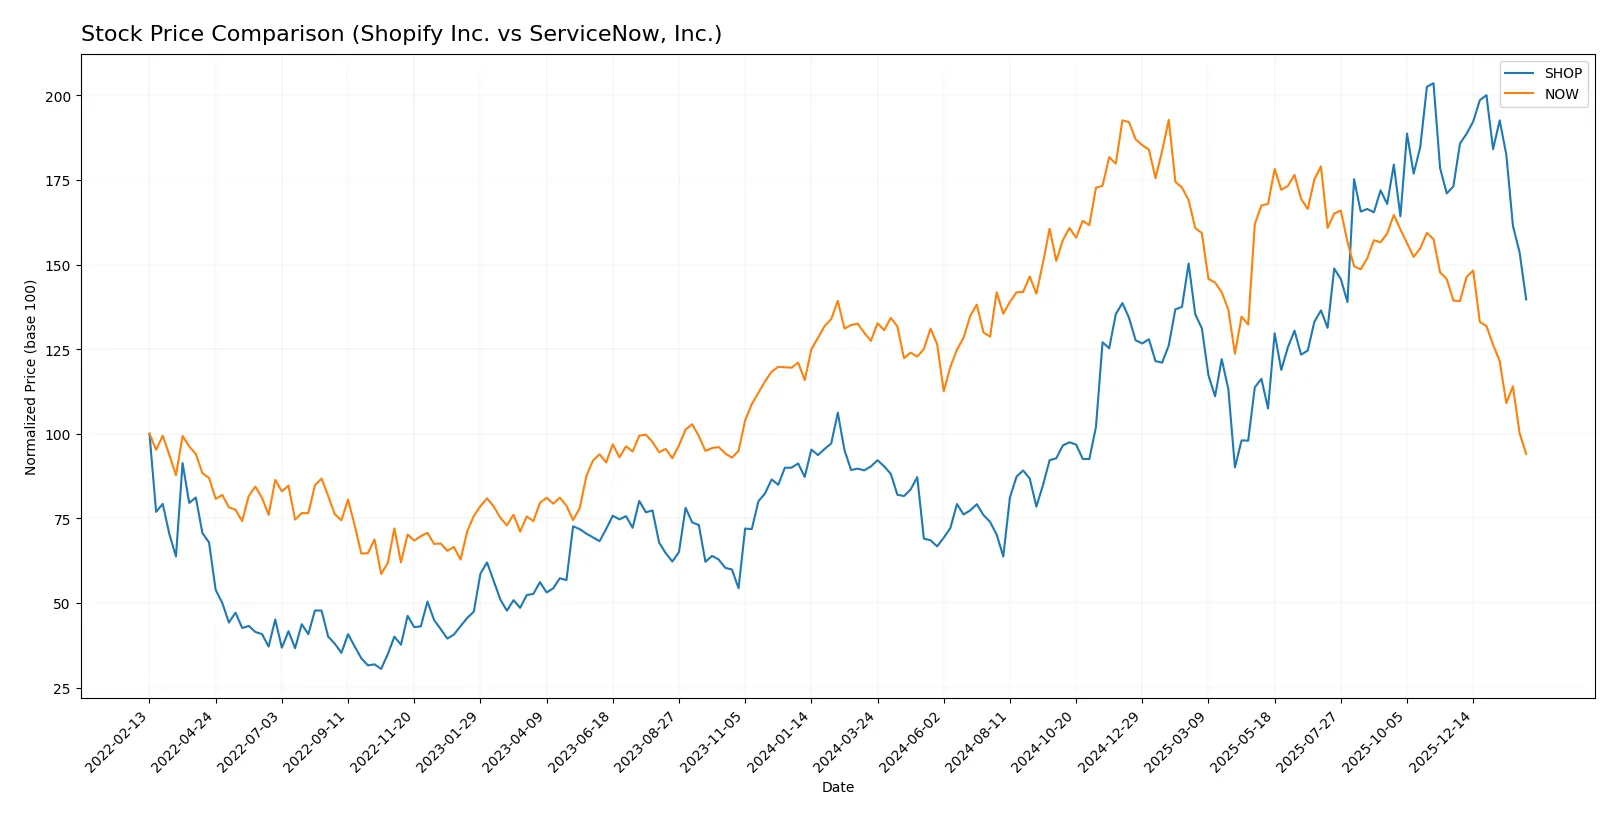
Trend Comparison
Shopify Inc. recorded a 54.62% price increase over 12 months, signaling a bullish trend with decelerating momentum, peaking at 173.86 and bottoming at 54.43.
ServiceNow, Inc. showed a 26.22% loss over the same period, confirming a bearish trend with deceleration, hitting a high of 225.0 and a low of 109.77.
Shopify’s bullish trend contrasts with ServiceNow’s bearish performance, delivering the highest market returns during the analyzed period.
Target Prices
Analysts present a mixed but generally optimistic target consensus for Shopify and ServiceNow.
| Company | Target Low | Target High | Consensus |
|---|---|---|---|
| Shopify Inc. | 140 | 200 | 185.61 |
| ServiceNow, Inc. | 115 | 1315 | 440.64 |
Shopify’s target consensus at 185.61 significantly exceeds its current price of 119.29, signaling strong upside potential. ServiceNow’s wide target range reflects uncertainty, but the consensus of 440.64 far surpasses the current price of 109.77, indicating bullish analyst expectations despite high volatility.

Don’t Let Luck Decide Your Entry Point
Optimize your entry points with our advanced ProRealTime indicators. You’ll get efficient buy signals with precise price targets for maximum performance. Start outperforming now!
How do institutions grade them?
Shopify Inc. Grades
The following table summarizes recent grades issued by reputable institutions for Shopify Inc.:
| Grading Company | Action | New Grade | Date |
|---|---|---|---|
| Scotiabank | Upgrade | Sector Outperform | 2026-01-08 |
| Wolfe Research | Downgrade | Peer Perform | 2026-01-06 |
| Wells Fargo | Maintain | Overweight | 2025-12-17 |
| Barclays | Maintain | Equal Weight | 2025-11-05 |
| UBS | Maintain | Neutral | 2025-11-05 |
| CIBC | Maintain | Outperform | 2025-11-05 |
| JP Morgan | Maintain | Overweight | 2025-11-05 |
| DA Davidson | Maintain | Buy | 2025-11-05 |
| Needham | Maintain | Buy | 2025-11-05 |
| Scotiabank | Maintain | Sector Perform | 2025-11-05 |
ServiceNow, Inc. Grades
Below is a summary of recent grades from recognized grading firms for ServiceNow, Inc.:
| Grading Company | Action | New Grade | Date |
|---|---|---|---|
| Citigroup | Maintain | Buy | 2026-01-30 |
| Evercore ISI Group | Maintain | Outperform | 2026-01-29 |
| Macquarie | Maintain | Neutral | 2026-01-29 |
| BTIG | Maintain | Buy | 2026-01-29 |
| RBC Capital | Maintain | Outperform | 2026-01-29 |
| Keybanc | Maintain | Underweight | 2026-01-29 |
| Stifel | Maintain | Buy | 2026-01-29 |
| DA Davidson | Maintain | Buy | 2026-01-29 |
| Cantor Fitzgerald | Maintain | Overweight | 2026-01-29 |
| Needham | Maintain | Buy | 2026-01-29 |
Which company has the best grades?
ServiceNow, Inc. holds a more consistent Buy and Outperform consensus among major firms. Shopify Inc. shows mixed ratings with recent upgrades and downgrades. Investors may interpret ServiceNow’s steadier positive grades as stronger confidence from institutions.
Risks specific to each company
The following categories identify the critical pressure points and systemic threats facing both firms in the 2026 market environment:
1. Market & Competition
Shopify Inc.
- Faces intense competition in e-commerce software with high beta (2.82) indicating sensitivity to market swings.
ServiceNow, Inc.
- Competes in enterprise cloud computing but shows lower beta (0.98), suggesting more stable market positioning.
2. Capital Structure & Debt
Shopify Inc.
- Low debt-to-equity ratio (0.1) and debt-to-assets (8.1%) indicate conservative leverage and financial strength.
ServiceNow, Inc.
- Higher debt-to-equity (0.25) and debt-to-assets (12.3%) but still manageable, with strong interest coverage.
3. Stock Volatility
Shopify Inc.
- High stock volatility, reflected by a wide trading range ($69.84-$182.19) and beta above 2.8, signals elevated risk.
ServiceNow, Inc.
- More stable stock behavior; narrower range ($108.1-$211.48) and beta near 1.0 reflect moderate volatility.
4. Regulatory & Legal
Shopify Inc.
- Operates globally, exposing it to complex ecommerce regulations and data privacy laws across multiple regions.
ServiceNow, Inc.
- Faces regulatory scrutiny mainly in US enterprise software and data security compliance, a known sector challenge.
5. Supply Chain & Operations
Shopify Inc.
- Relies on third-party logistics and merchant solutions, vulnerable to supply chain disruptions and cost inflation.
ServiceNow, Inc.
- Focuses on cloud infrastructure and software delivery, less exposed to traditional supply chain risks.
6. ESG & Climate Transition
Shopify Inc.
- Faces pressure to reduce carbon footprint in fulfillment and payment processing operations.
ServiceNow, Inc.
- Invests in sustainability through cloud efficiency and governance, potentially better positioned for climate transition.
7. Geopolitical Exposure
Shopify Inc.
- Global footprint includes emerging markets with political risk and currency fluctuations.
ServiceNow, Inc.
- Primarily US-based with exposure to international enterprise clients, mitigates some geopolitical risks.
Which company shows a better risk-adjusted profile?
Shopify’s largest risk is its high stock volatility and exposure to global regulatory complexity. ServiceNow’s key risk lies in higher leverage and valuation multiples. Despite Shopify’s aggressive market stance, ServiceNow’s steadier fundamentals and lower beta confer a better risk-adjusted profile. Notably, Shopify’s beta above 2.8 signals heightened sensitivity to market shocks, a critical concern in 2026’s volatile tech sector.
Final Verdict: Which stock to choose?
Shopify Inc. excels as a growth powerhouse with a rapid expansion in profitability and an impressive ability to convert revenue into cash flow. Its superpower lies in dynamic scalability and innovation, fueling aggressive growth. However, its elevated valuation multiples and weaker liquidity ratios call for vigilance. Shopify fits best in aggressive growth portfolios willing to tolerate volatility.
ServiceNow, Inc. commands a strategic moat through strong recurring revenue and robust operational efficiency. Its consistent ROIC growth signals improving capital allocation, offering relatively better financial stability than Shopify. ServiceNow appeals to investors favoring GARP—growth at a reasonable price—with a focus on sustainable profitability and moderate risk exposure.
If you prioritize rapid expansion and market disruption, Shopify presents a compelling case due to its aggressive growth trajectory and improving profitability. However, if you seek better stability and an evolving competitive moat with steady cash flow, ServiceNow offers a more balanced profile. Both stocks carry valuation risks that warrant careful risk management aligned with your investment horizon.
Disclaimer: Investment carries a risk of loss of initial capital. The past performance is not a reliable indicator of future results. Be sure to understand risks before making an investment decision.
Go Further
I encourage you to read the complete analyses of Shopify Inc. and ServiceNow, Inc. to enhance your investment decisions: