Home > Comparison > Technology > NOW vs PD
The strategic rivalry between ServiceNow, Inc. and PagerDuty, Inc. shapes the trajectory of the enterprise software sector. ServiceNow operates as a capital-intensive technology giant with a broad, integrated cloud platform. PagerDuty, by contrast, focuses on a specialized, high-margin digital operations management service. This analysis explores their contrasting growth vectors and operational models to determine which offers superior risk-adjusted returns for a diversified portfolio in 2026.
Table of contents
Companies Overview
ServiceNow and PagerDuty stand as pivotal players in the enterprise software landscape, each shaping digital workflows and operational efficiency.
ServiceNow, Inc.: Enterprise Workflow Automation Leader
ServiceNow dominates enterprise cloud computing with its Now platform, automating workflows across IT, HR, security, and customer service. Its core revenue stems from subscription-based software solutions that integrate AI, machine learning, and robotic process automation. In 2026, ServiceNow sharpens its focus on expanding automation capabilities and strategic partnerships, notably with Celonis, to optimize process identification and prioritization.
PagerDuty, Inc.: Digital Operations Management Innovator
PagerDuty operates a digital operations management platform that collects and analyzes real-time data signals using machine learning to predict system issues. Its revenue primarily comes from SaaS subscriptions targeting incident and event management. In 2026, PagerDuty intensifies its emphasis on enhancing predictive analytics and broadening its footprint across telecommunications, retail, and financial services sectors.
Strategic Collision: Similarities & Divergences
Both firms excel in software-driven operational efficiency but diverge in philosophy: ServiceNow embraces a broad workflow automation ecosystem, while PagerDuty specializes in focused incident management using predictive analytics. Their primary battleground is the enterprise IT operations market, where automation and real-time responsiveness define success. This contrast yields distinct investment profiles—ServiceNow with its scale and ecosystem breadth, PagerDuty with its niche precision and growth potential.
Income Statement Comparison
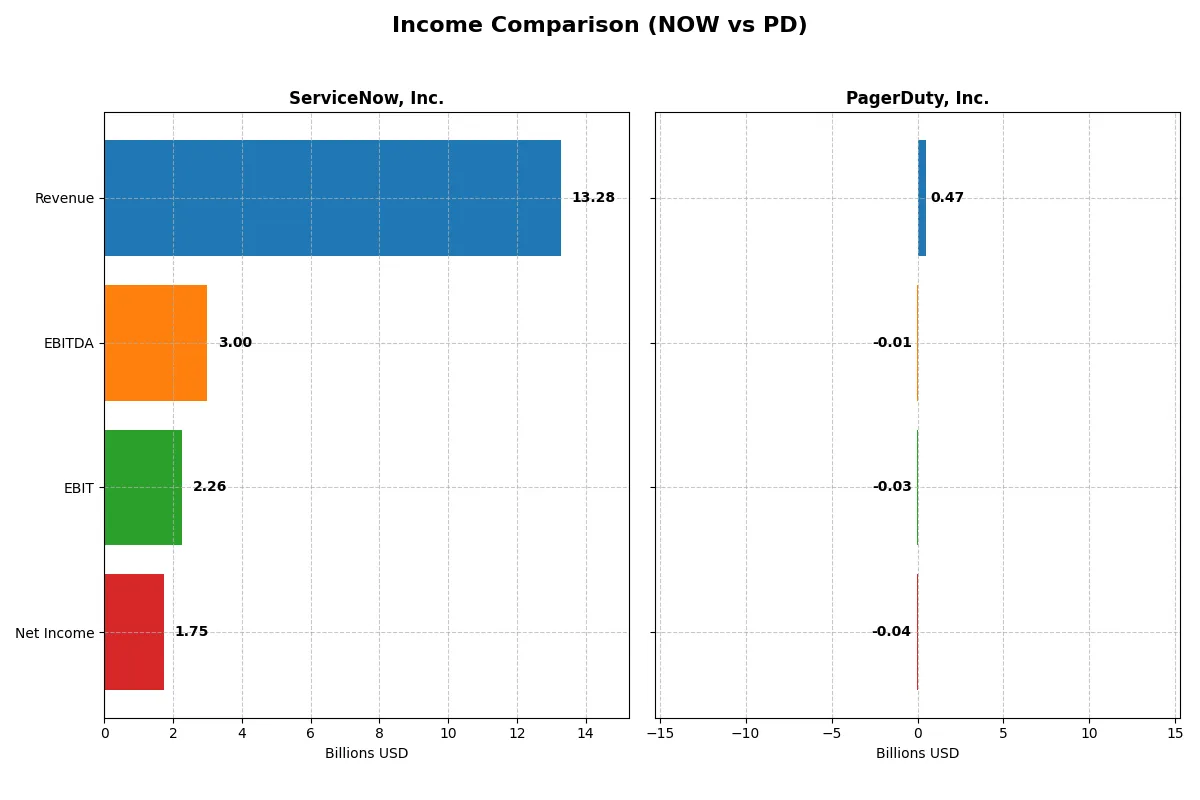
This data dissects the core profitability and scalability of both corporate engines to reveal who dominates the bottom line:
| Metric | ServiceNow, Inc. (NOW) | PagerDuty, Inc. (PD) |
|---|---|---|
| Revenue | 13.3B | 467M |
| Cost of Revenue | 3.0B | 80M |
| Operating Expenses | 8.5B | 448M |
| Gross Profit | 10.3B | 388M |
| EBITDA | 3.0B | -12M |
| EBIT | 2.3B | -32M |
| Interest Expense | 0 | 9M |
| Net Income | 1.7B | -43M |
| EPS | 1.69 | -0.59 |
| Fiscal Year | 2025 | 2025 |
Income Statement Analysis: The Bottom-Line Duel
The income statement comparison reveals which company operates with superior efficiency and profitability momentum in a competitive sector.
ServiceNow, Inc. Analysis
ServiceNow’s revenue soared from 5.9B in 2021 to 13.3B in 2025, with net income expanding from 230M to 1.75B. Gross margins hold firm at 77.5%, reflecting strong cost control. The 2025 figures show a healthy 13.2% net margin and a 21.9% EPS growth, signaling robust operational momentum and margin sustainability.
PagerDuty, Inc. Analysis
PagerDuty’s revenue climbed steadily from 214M in 2021 to 467M in 2025, but it remains unprofitable with a net loss of 54M in 2025. Despite a strong gross margin of 83%, negative EBIT and net margins (-6.95% and -9.14%) persist. However, recent improvements include a 55.5% EBIT growth and 33.7% EPS growth, indicating progress towards profitability.
Margin Power vs. Growth Struggles
ServiceNow dominates with superior scale, consistent profitability, and expanding margins, making it the clear fundamental winner. PagerDuty’s revenue growth is commendable, yet persistent losses and negative margins temper its appeal. Investors seeking a proven profit engine will find ServiceNow’s profile more attractive.
Financial Ratios Comparison
These vital ratios act as a diagnostic tool to expose the underlying fiscal health, valuation premiums, and capital efficiency of the companies compared below:
| Ratios | ServiceNow, Inc. (NOW) | PagerDuty, Inc. (PD) |
|---|---|---|
| ROE | 13.48% | -32.92% |
| ROIC | 8.98% | -9.66% |
| P/E | 90.88 | -39.87 |
| P/B | 12.25 | 13.12 |
| Current Ratio | 0.95 | 1.87 |
| Quick Ratio | 0.95 | 1.87 |
| D/E | 0.25 | 3.57 |
| Debt-to-Assets | 12.30% | 50.00% |
| Interest Coverage | 0 | -6.46 |
| Asset Turnover | 0.51 | 0.50 |
| Fixed Asset Turnover | 4.29 | 16.61 |
| Payout ratio | 0 | 0 |
| Dividend yield | 0 | 0 |
| Fiscal Year | 2025 | 2025 |
Efficiency & Valuation Duel: The Vital Signs
Financial ratios serve as a company’s DNA, uncovering hidden risks and revealing operational excellence behind headline figures.
ServiceNow, Inc.
ServiceNow delivers solid profitability with a 13.48% ROE and a favorable 13.16% net margin, signaling efficient core operations. However, the stock trades at a stretched 90.88 P/E, indicating high market expectations. The company reinvests heavily in R&D, forgoing dividends to fuel sustained growth and innovation.
PagerDuty, Inc.
PagerDuty reports deeply negative profitability metrics, including a -32.92% ROE and -9.14% net margin, reflecting ongoing operational challenges. Its valuation is more reasonable with a negative P/E, but heavy debt and no dividends raise concerns. The firm focuses on aggressive R&D investments to turn losses into future growth.
Premium Valuation vs. Operational Struggles
ServiceNow balances robust profitability and disciplined reinvestment despite its premium valuation, while PagerDuty struggles with losses and debt despite cheaper multiples. Investors seeking growth with operational stability may favor ServiceNow’s profile. PagerDuty suits those willing to accept higher risk for potential turnaround upside.
Which one offers the Superior Shareholder Reward?
ServiceNow, Inc. (NOW) and PagerDuty, Inc. (PD) both forgo dividends, focusing on growth reinvestment. NOW’s robust free cash flow of 4.4B and moderate buybacks underpin a sustainable return model. PD, burdened by losses and heavy debt, shows weaker cash flow (1.2B) and minimal buybacks. I conclude NOW offers the superior total return potential in 2026.
Comparative Score Analysis: The Strategic Profile
The radar chart reveals the fundamental DNA and trade-offs of ServiceNow, Inc. and PagerDuty, Inc., highlighting their core financial strengths and valuation challenges:
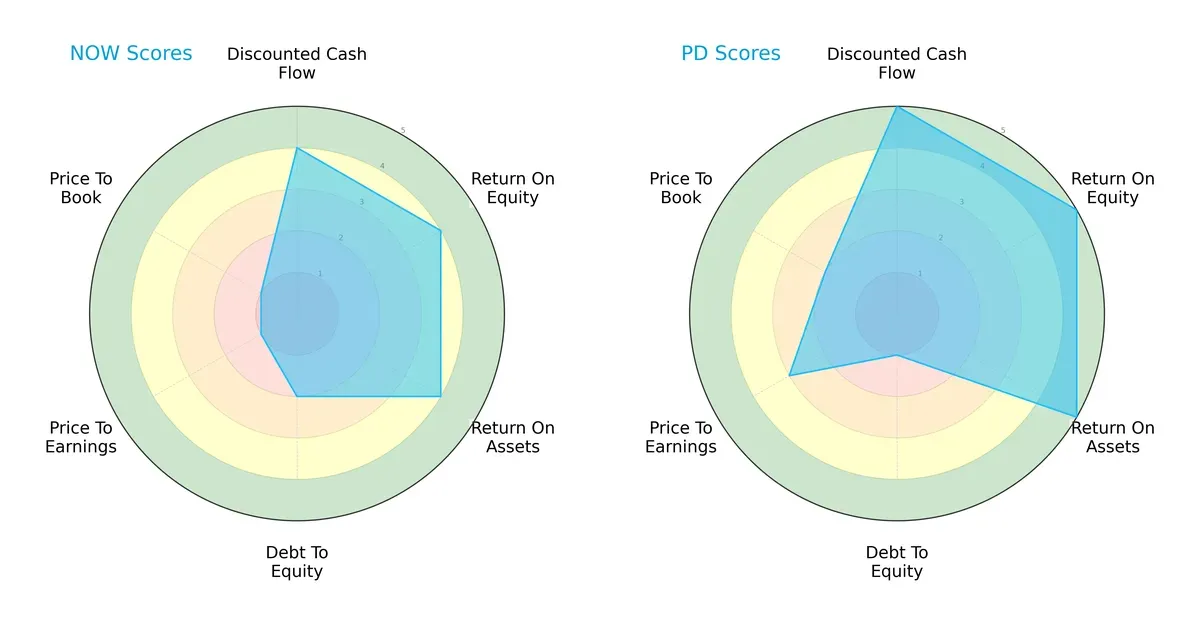
PagerDuty leads with superior scores in discounted cash flow (5 vs. 4), return on equity (5 vs. 4), and return on assets (5 vs. 4), signaling more efficient profit generation and asset use. ServiceNow holds a moderate advantage in debt-to-equity (2 vs. 1), indicating slightly better leverage management. However, both companies face valuation headwinds, with ServiceNow scoring very low in price-to-earnings and price-to-book ratios (1 each), suggesting potential overvaluation. PagerDuty’s more balanced profile stems from its strong operational metrics, while ServiceNow relies heavily on moderate leverage and weaker valuation scores.
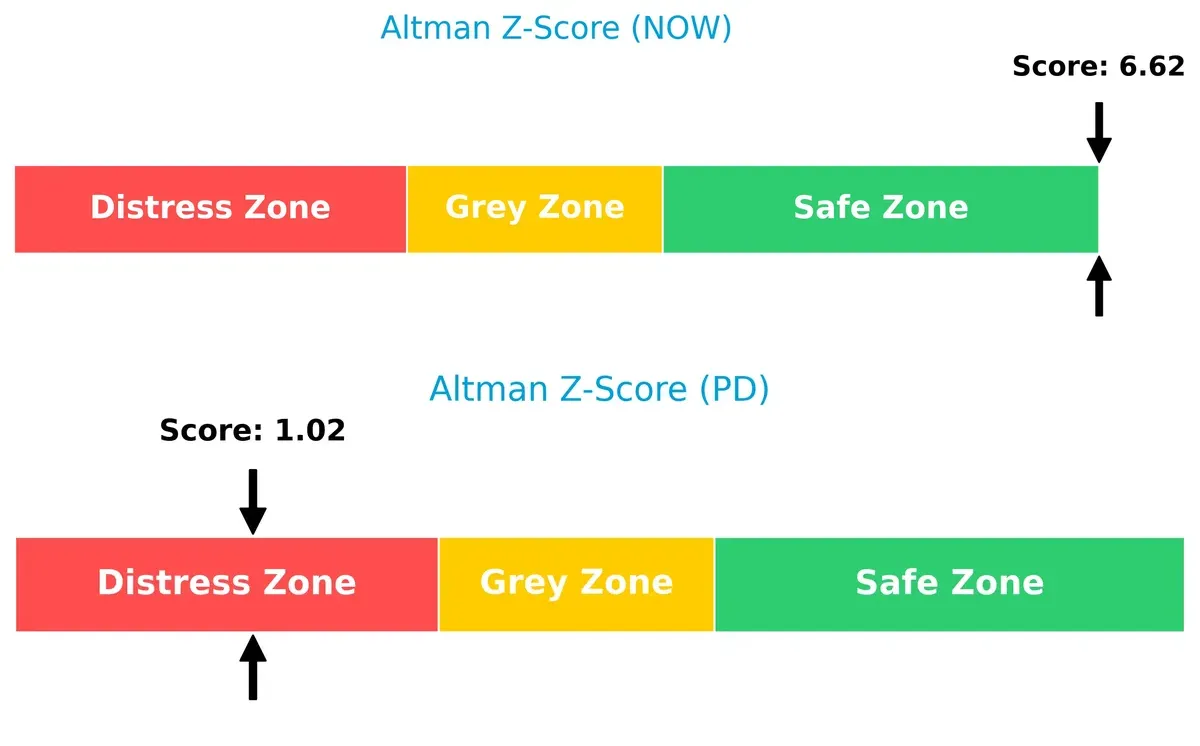
Bankruptcy Risk: Solvency Showdown
PagerDuty’s Altman Z-Score of 1.0 places it in the distress zone, raising red flags about its long-term solvency in this cycle. In contrast, ServiceNow’s robust 6.6 score firmly situates it in the safe zone, signaling strong financial stability and low bankruptcy risk:
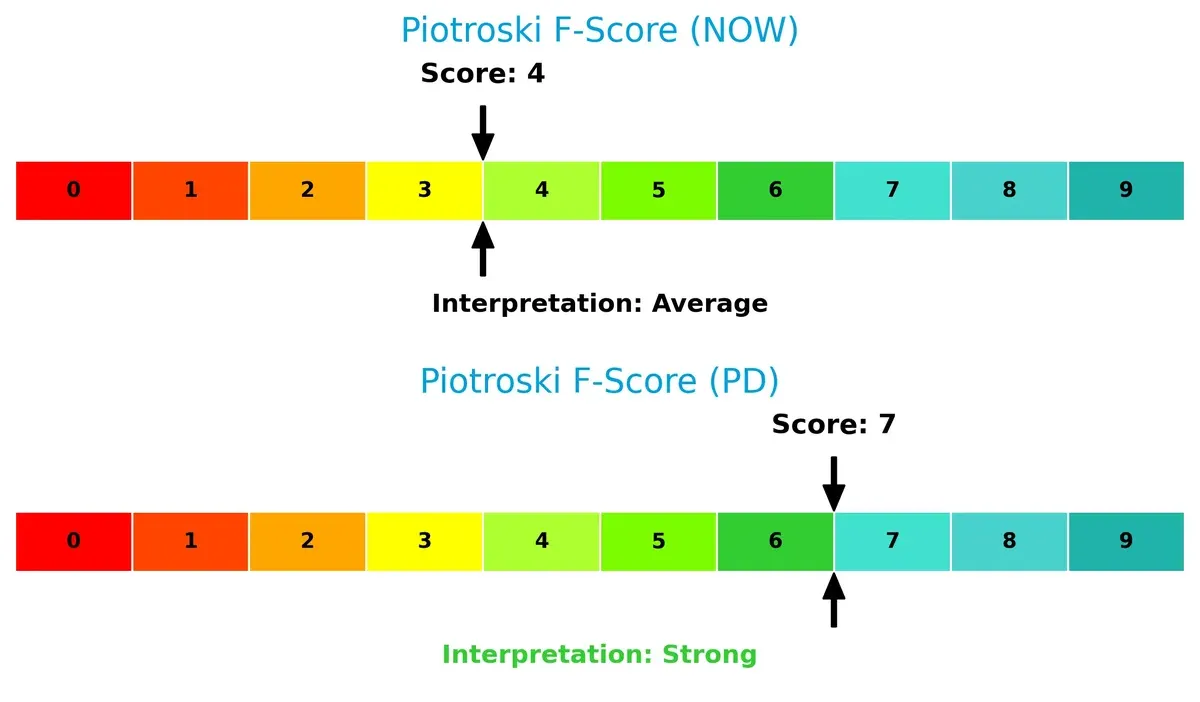
Financial Health: Quality of Operations
PagerDuty’s Piotroski F-Score of 7 indicates strong internal financial health, reflecting solid profitability and operational efficiency. ServiceNow’s score of 4 is average, suggesting some internal weaknesses and room for improvement in financial rigor:
How are the two companies positioned?
This section dissects the operational DNA of ServiceNow and PagerDuty by comparing their revenue distribution and internal dynamics. The goal is to confront their economic moats to identify which model offers the most resilient, sustainable competitive advantage today.
Revenue Segmentation: The Strategic Mix
The following visual comparison dissects how ServiceNow, Inc. and PagerDuty, Inc. diversify their income streams and where their primary sector bets lie:
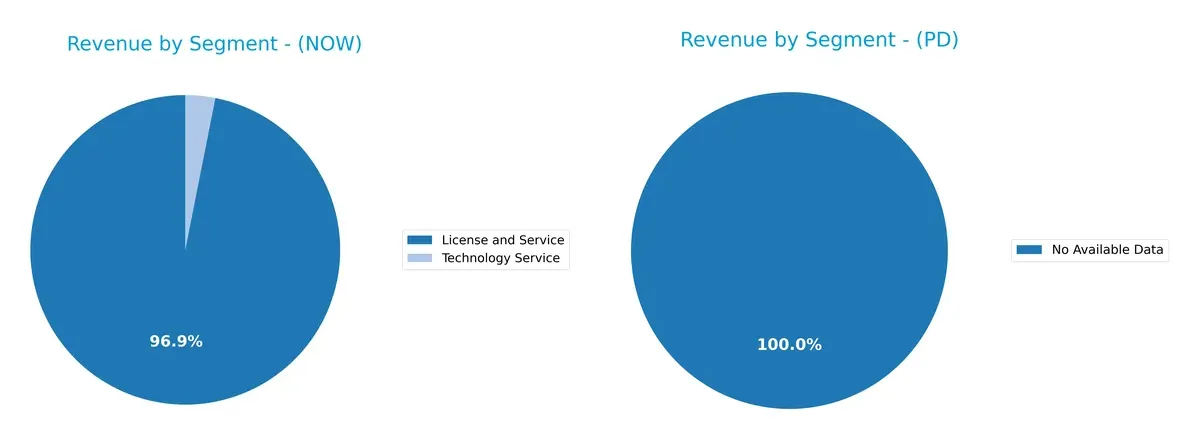
ServiceNow anchors its revenue in the expansive “License and Service” segment, with $12.9B in 2025 dwarfing the $414M from Technology Service. PagerDuty lacks available data, preventing direct comparison. ServiceNow’s heavy reliance on licensing signals strong ecosystem lock-in but concentrates risk. This dominance reflects its infrastructure moat, while PagerDuty’s absent data leaves its diversification strategy unclear. Investors should weigh ServiceNow’s leadership against concentration vulnerabilities.
Strengths and Weaknesses Comparison
This table compares the strengths and weaknesses of ServiceNow and PagerDuty based on diversification, profitability, financials, innovation, global presence, and market share:
ServiceNow Strengths
- Strong global presence with $8.35B North America revenue
- Diversified revenue in License, Service, and Technology segments
- Favorable net margin of 13.16%
- Low debt-to-assets at 12.3%
- High fixed asset turnover at 4.29
PagerDuty Strengths
- Favorable current and quick ratios at 1.87 indicating liquidity
- Low WACC at 5.84% supports cheaper capital
- High fixed asset turnover at 16.61
- Positive price-to-earnings ratio relative standing
ServiceNow Weaknesses
- Unfavorable valuation metrics: PE 90.88, PB 12.25
- Current ratio slightly below 1 at 0.95
- No dividend yield
- ROE and ROIC neutral, suggesting average capital efficiency
PagerDuty Weaknesses
- Negative profitability: net margin -9.14%, ROE -32.92%, ROIC -9.66%
- High debt-to-assets at 50% and high debt/equity ratio of 3.57
- Negative interest coverage at -3.51
- Unfavorable PB at 13.12 and no dividend yield
ServiceNow’s strengths lie in its robust global footprint, diversified revenue streams, and solid profitability, though stretched valuation and liquidity ratios pose caution. PagerDuty faces significant profitability and leverage challenges despite favorable liquidity and capital cost metrics, indicating strategic focus areas for financial health improvement.
The Moat Duel: Analyzing Competitive Defensibility
A structural moat is the only true shield protecting long-term profits from relentless competitive erosion. Let’s examine how these two firms defend their turf:
ServiceNow, Inc.: Workflow Automation with Expanding Scale Moat
I see ServiceNow’s moat rooted in high switching costs and broad enterprise adoption. Its strong 17% EBIT margin and 77.5% gross margin reflect scale and pricing power. In 2026, expanding into new verticals and AI-driven automation will deepen this moat.
PagerDuty, Inc.: Machine Learning-Driven Incident Response Moat
PagerDuty’s moat stems from specialized machine learning capabilities and real-time digital operations. Unlike ServiceNow, PagerDuty posts negative EBIT and net margins, showing early-stage profitability challenges. However, its growing revenue and improving margins suggest a narrowing gap, with expansion in telecom and media sectors as key catalysts.
Scale & Integration vs. Specialized Innovation: Moat Depth Showdown
ServiceNow’s wider moat benefits from entrenched enterprise workflows and superior profitability metrics. PagerDuty, while innovative, lacks the margin stability to rival ServiceNow’s fortress. ServiceNow stands better equipped to defend and grow its market share in 2026.
Which stock offers better returns?
Both ServiceNow, Inc. and PagerDuty, Inc. experienced significant stock price declines over the past year, with seller dominance intensifying in recent months.
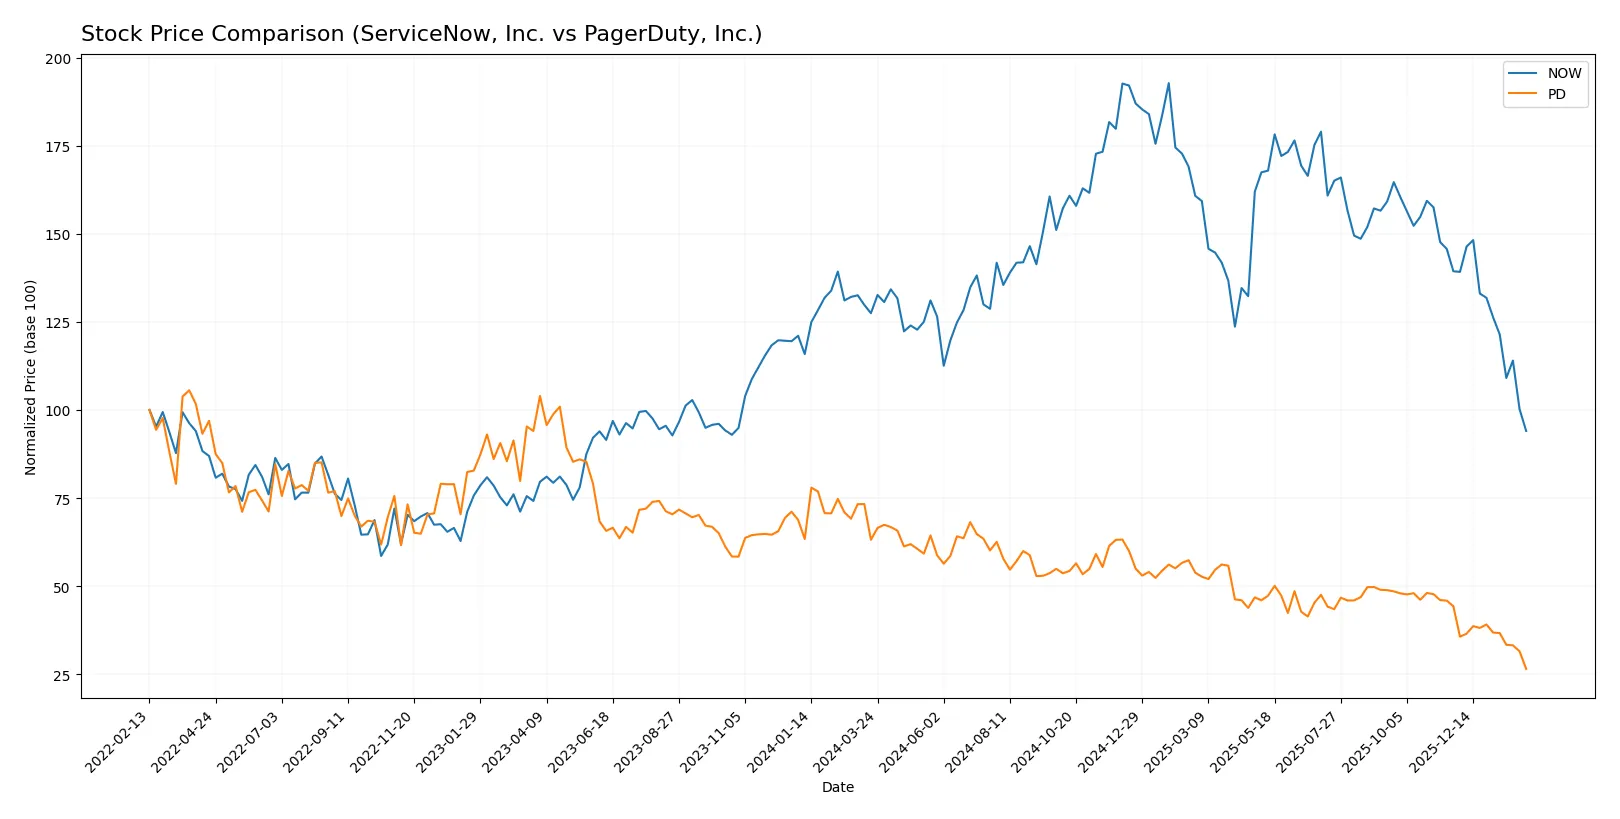
Trend Comparison
ServiceNow’s stock fell 26.22% over the past 12 months, showing a bearish trend with decelerating losses. The price ranged between 225 and 109.77, with volatility at 25.07.
PagerDuty’s shares dropped 58.02% in the same period, also bearish with decelerating decline. The price fluctuated from 22.93 to 8.92, exhibiting low volatility at 2.98.
ServiceNow outperformed PagerDuty, delivering the smaller decline. Both stocks show seller dominance, but ServiceNow’s loss was significantly less severe.
Target Prices
Analysts present a wide consensus on target prices, reflecting differing risk appetites and growth expectations.
| Company | Target Low | Target High | Consensus |
|---|---|---|---|
| ServiceNow, Inc. | 115 | 1315 | 440.64 |
| PagerDuty, Inc. | 15 | 19 | 16.2 |
ServiceNow’s consensus target is roughly 4x its current price of $109.77, signaling strong growth potential despite market volatility. PagerDuty’s target consensus at $16.2 exceeds its current $8.92 price, indicating cautious optimism among analysts.

Don’t Let Luck Decide Your Entry Point
Optimize your entry points with our advanced ProRealTime indicators. You’ll get efficient buy signals with precise price targets for maximum performance. Start outperforming now!
How do institutions grade them?
ServiceNow, Inc. Grades
The following table summarizes recent institutional grades for ServiceNow, Inc.:
| Grading Company | Action | New Grade | Date |
|---|---|---|---|
| Citigroup | Maintain | Buy | 2026-01-30 |
| Evercore ISI Group | Maintain | Outperform | 2026-01-29 |
| Macquarie | Maintain | Neutral | 2026-01-29 |
| BTIG | Maintain | Buy | 2026-01-29 |
| RBC Capital | Maintain | Outperform | 2026-01-29 |
| Keybanc | Maintain | Underweight | 2026-01-29 |
| Stifel | Maintain | Buy | 2026-01-29 |
| DA Davidson | Maintain | Buy | 2026-01-29 |
| Cantor Fitzgerald | Maintain | Overweight | 2026-01-29 |
| Needham | Maintain | Buy | 2026-01-29 |
PagerDuty, Inc. Grades
Below are the latest institutional grades for PagerDuty, Inc.:
| Grading Company | Action | New Grade | Date |
|---|---|---|---|
| Truist Securities | Maintain | Buy | 2026-01-07 |
| RBC Capital | Downgrade | Sector Perform | 2026-01-05 |
| Craig-Hallum | Downgrade | Hold | 2025-11-26 |
| Morgan Stanley | Maintain | Equal Weight | 2025-11-26 |
| RBC Capital | Maintain | Outperform | 2025-11-26 |
| TD Cowen | Maintain | Buy | 2025-11-26 |
| Truist Securities | Maintain | Buy | 2025-11-19 |
| RBC Capital | Maintain | Outperform | 2025-09-04 |
| Baird | Maintain | Neutral | 2025-09-04 |
| Canaccord Genuity | Maintain | Buy | 2025-09-04 |
Which company has the best grades?
ServiceNow consistently receives strong buy and outperform ratings from multiple firms, signaling institutional confidence. PagerDuty shows more mixed grades with recent downgrades, potentially raising caution for investors.
Risks specific to each company
The following categories identify the critical pressure points and systemic threats facing both firms in the 2026 market environment:
1. Market & Competition
ServiceNow, Inc.
- Dominates enterprise cloud workflow automation with broad industry reach; faces intense competition from large software incumbents.
PagerDuty, Inc.
- Operates in digital operations management niche; struggles with scale compared to larger competitors and limited market penetration.
2. Capital Structure & Debt
ServiceNow, Inc.
- Maintains low debt levels (D/E 0.25) and strong interest coverage; capital structure supports sustainable growth.
PagerDuty, Inc.
- High leverage (D/E 3.57) raises financial risk; negative interest coverage signals distress and refinancing concerns.
3. Stock Volatility
ServiceNow, Inc.
- Beta near 1 (0.978) reflects market-correlated volatility; wider price range signals investor uncertainty.
PagerDuty, Inc.
- Lower beta (0.672) implies less sensitivity to market swings; recent steep price drop indicates episodic volatility.
4. Regulatory & Legal
ServiceNow, Inc.
- Compliance burden normal for large tech firms; potential risks from data privacy and security regulations.
PagerDuty, Inc.
- Faces similar regulatory landscape; smaller scale may limit resources for compliance and legal defense.
5. Supply Chain & Operations
ServiceNow, Inc.
- Robust cloud infrastructure and partnerships reduce operational risks; proven scalability.
PagerDuty, Inc.
- Operational scale limited; dependency on key technology partners could disrupt service delivery.
6. ESG & Climate Transition
ServiceNow, Inc.
- Established ESG policies aligned with industry standards; ongoing initiatives to reduce carbon footprint.
PagerDuty, Inc.
- ESG efforts less mature; climate transition risks may impact reputation and investor sentiment.
7. Geopolitical Exposure
ServiceNow, Inc.
- Global presence exposes firm to trade tensions and geopolitical instability; diversified customer base mitigates risk.
PagerDuty, Inc.
- Moderate international exposure; concentrated US market focus lowers but does not eliminate geopolitical risks.
Which company shows a better risk-adjusted profile?
ServiceNow’s low leverage and strong interest coverage underpin a resilient capital structure. PagerDuty’s high debt and negative interest coverage raise red flags. ServiceNow’s stock volatility aligns with sector norms, while PagerDuty’s recent steep drop signals elevated risk. The most impactful risks are PagerDuty’s financial distress and ServiceNow’s high valuation multiples, which may limit upside. Overall, ServiceNow offers a more balanced risk-return profile, supported by its safe-zone Altman Z-Score of 6.6 versus PagerDuty’s distress-zone score near 1.0. The widening valuation gap and PagerDuty’s capital strain justify heightened caution for investors.
Final Verdict: Which stock to choose?
ServiceNow’s superpower lies in its robust operational efficiency and consistent cash generation, driving impressive revenue and earnings growth. Its point of vigilance is a current ratio below 1, signaling potential short-term liquidity pressure. It suits portfolios targeting aggressive growth with a tolerance for valuation risk.
PagerDuty’s strategic moat is its niche in incident response software, supported by recurring revenue models and solid R&D investment. It offers a comparatively safer liquidity profile but struggles with profitability and value creation. It fits GARP investors seeking growth tempered by reasonable price considerations.
If you prioritize operational excellence and accelerating profitability, ServiceNow outshines with superior cash flow and margin expansion despite a stretched valuation. However, if you seek steady growth within a defined niche and better short-term liquidity, PagerDuty offers better stability but demands patience for profitability to improve.
Disclaimer: Investment carries a risk of loss of initial capital. The past performance is not a reliable indicator of future results. Be sure to understand risks before making an investment decision.
Go Further
I encourage you to read the complete analyses of ServiceNow, Inc. and PagerDuty, Inc. to enhance your investment decisions: