Home > Comparison > Technology > NOW vs EPAM
The strategic rivalry between ServiceNow, Inc. and EPAM Systems, Inc. shapes the evolution of the technology sector. ServiceNow, a leader in application software, emphasizes enterprise cloud workflow automation. EPAM operates as a digital engineering powerhouse, focusing on bespoke software development and IT services. This analysis contrasts their operational models and growth trajectories to identify which company delivers superior risk-adjusted returns for a diversified portfolio in 2026.
Table of contents
Companies Overview
ServiceNow and EPAM Systems compete at the forefront of enterprise technology solutions with distinct market approaches.
ServiceNow, Inc.: Workflow Automation Leader
ServiceNow excels as a cloud computing platform provider specializing in workflow automation for enterprises. It generates revenue from software sales and professional services focused on IT service management, security operations, and business process automation. In 2026, the company deepened its strategic partnership with Celonis, emphasizing process mining to enhance automation capabilities.
EPAM Systems, Inc.: Digital Engineering Powerhouse
EPAM stands out in digital platform engineering and software development services globally. Its revenue stems from engineering consulting, infrastructure management, and smart automation solutions tailored to diverse industries. In 2026, EPAM prioritized expanding its integrated engineering practices and advisory consulting, driving innovation in AI, robotics, and virtual reality applications.
Strategic Collision: Similarities & Divergences
ServiceNow and EPAM share a focus on enterprise technology but diverge in execution. ServiceNow offers a closed ecosystem centered on cloud-based workflow automation, while EPAM delivers an open infrastructure approach through customized digital engineering. Their main battleground is enterprise digital transformation services. Investors face distinct profiles: ServiceNow leans on scalable SaaS growth, whereas EPAM emphasizes project-based engineering expertise.
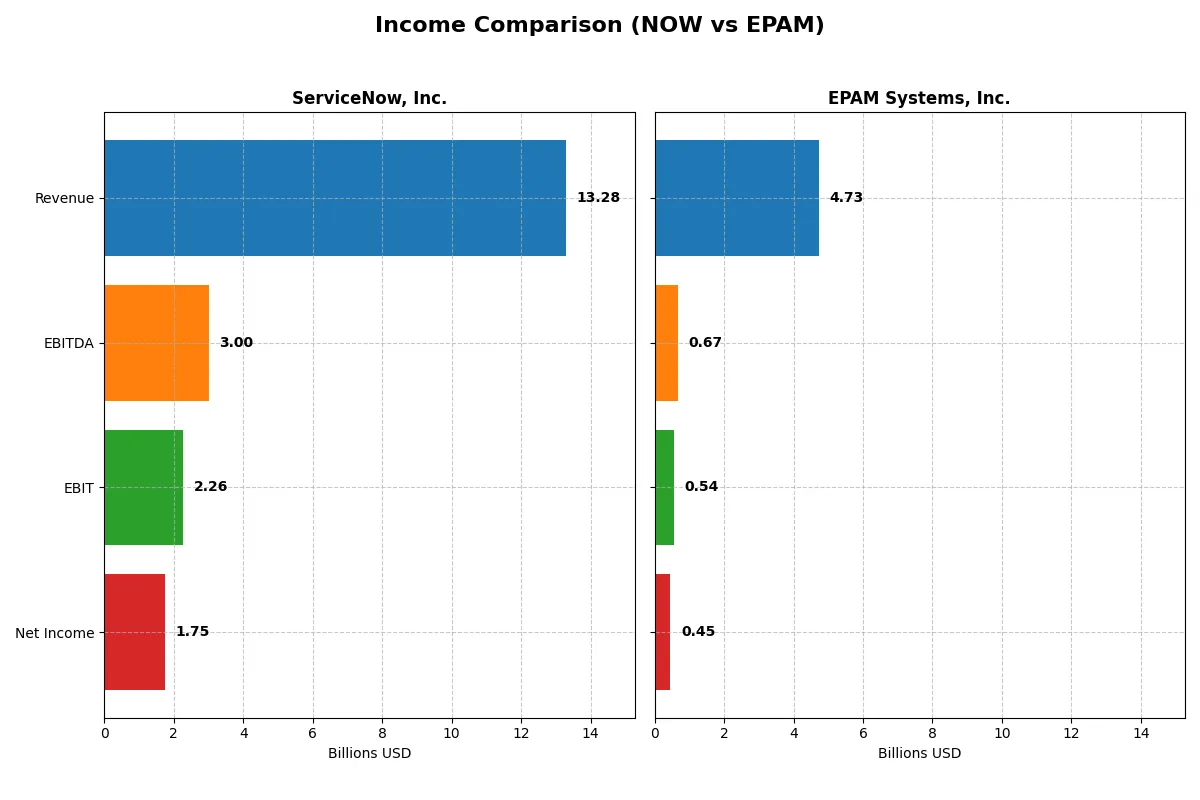
Income Statement Comparison
This data dissects the core profitability and scalability of both corporate engines to reveal who dominates the bottom line in the most recent fiscal year:
| Metric | ServiceNow, Inc. (NOW) | EPAM Systems, Inc. (EPAM) |
|---|---|---|
| Revenue | 13.3B | 4.7B |
| Cost of Revenue | 3.0B | 3.3B |
| Operating Expenses | 8.5B | 906M |
| Gross Profit | 10.3B | 1.5B |
| EBITDA | 3.0B | 672M |
| EBIT | 2.3B | 545M |
| Interest Expense | 0 | 0 |
| Net Income | 1.7B | 455M |
| EPS | 1.69 | 7.93 |
| Fiscal Year | 2025 | 2024 |
Income Statement Analysis: The Bottom-Line Duel
This income statement comparison reveals which company converts revenue into profit more efficiently, spotlighting their operational strengths and growth dynamics.
ServiceNow, Inc. Analysis
ServiceNow’s revenue surged from 5.9B in 2021 to 13.3B in 2025, marking robust growth. Net income expanded impressively to 1.75B in 2025. The company sustains strong gross margins above 77%, with net margins rising to 13.16%. Its 2025 figures reflect accelerating operational efficiency and healthy margin expansion.
EPAM Systems, Inc. Analysis
EPAM’s revenue grew moderately from 2.7B in 2020 to 4.7B in 2024, with net income reaching 455M. Its gross margin sits at a lower 30.68%, and net margin at 9.61%. While top-line growth slowed to 0.8% in 2024, net margin and EPS improved, indicating steady but limited margin leverage.
Margin Power vs. Revenue Scale
ServiceNow dominates with superior revenue growth and margin expansion, nearly doubling EPAM’s revenue and more than tripling its net income. EPAM’s margins remain compressed despite consistent profits. For investors prioritizing scale and margin improvement, ServiceNow presents a more compelling profile.
Financial Ratios Comparison
These vital ratios act as a diagnostic tool to expose the underlying fiscal health, valuation premiums, and capital efficiency of these companies:
| Ratios | ServiceNow, Inc. (NOW) | EPAM Systems, Inc. (EPAM) |
|---|---|---|
| ROE | 13.5% | 12.5% |
| ROIC | 9.0% | 10.7% |
| P/E | 90.9 | 29.5 |
| P/B | 12.3 | 3.7 |
| Current Ratio | 0.95 | 2.96 |
| Quick Ratio | 0.95 | 2.96 |
| D/E | 0.25 | 0.045 |
| Debt-to-Assets | 12.3% | 3.4% |
| Interest Coverage | 0 | 0 |
| Asset Turnover | 0.51 | 1.00 |
| Fixed Asset Turnover | 4.29 | 14.07 |
| Payout Ratio | 0 | 0 |
| Dividend Yield | 0 | 0 |
| Fiscal Year | 2025 | 2024 |
Efficiency & Valuation Duel: The Vital Signs
Financial ratios act as a company’s DNA, revealing hidden risks and operational excellence behind headline numbers.
ServiceNow, Inc.
ServiceNow posts a solid 13.5% ROE and a favorable 13.2% net margin, reflecting operational strength. However, its valuation stretches with a P/E near 91 and a P/B above 12, marking the stock as expensive. The firm pays no dividend, channeling capital into growth and R&D, signaling long-term reinvestment.
EPAM Systems, Inc.
EPAM delivers a respectable 12.5% ROE and a 9.6% net margin, demonstrating efficiency. Its valuation is more restrained, with a P/E near 29 and P/B at 3.7, though still flagged as unfavorable. Like ServiceNow, EPAM does not pay dividends, focusing resources on growth and operational expansion.
Premium Valuation vs. Operational Safety
ServiceNow’s premium valuation contrasts with EPAM’s more moderate multiples despite similar profitability. EPAM offers better current liquidity and lower leverage, balancing risk more conservatively. Investors favoring growth at a high premium may prefer ServiceNow, while those seeking operational safety might lean toward EPAM.
Which one offers the Superior Shareholder Reward?
I observe that neither ServiceNow (NOW) nor EPAM Systems (EPAM) pay dividends, focusing instead on reinvestment and buybacks. NOW’s free cash flow per share stands at $4.41 in 2025, with no dividend payout but limited buyback disclosure. EPAM shows stronger free cash flow at $9.20 per share and aggressively repurchases shares, signaling a more intense buyback strategy. EPAM also boasts a healthier balance sheet with a current ratio near 3.0 versus NOW’s sub-1.0, indicating better liquidity to sustain buybacks. Historically, EPAM’s distribution via buybacks paired with strong free cash flow and robust margins offers a more sustainable, superior total shareholder return than NOW’s capital allocation approach in 2026.
Comparative Score Analysis: The Strategic Profile
The radar chart reveals the fundamental DNA and trade-offs between ServiceNow, Inc. and EPAM Systems, Inc., highlighting their distinct financial strengths and weaknesses:
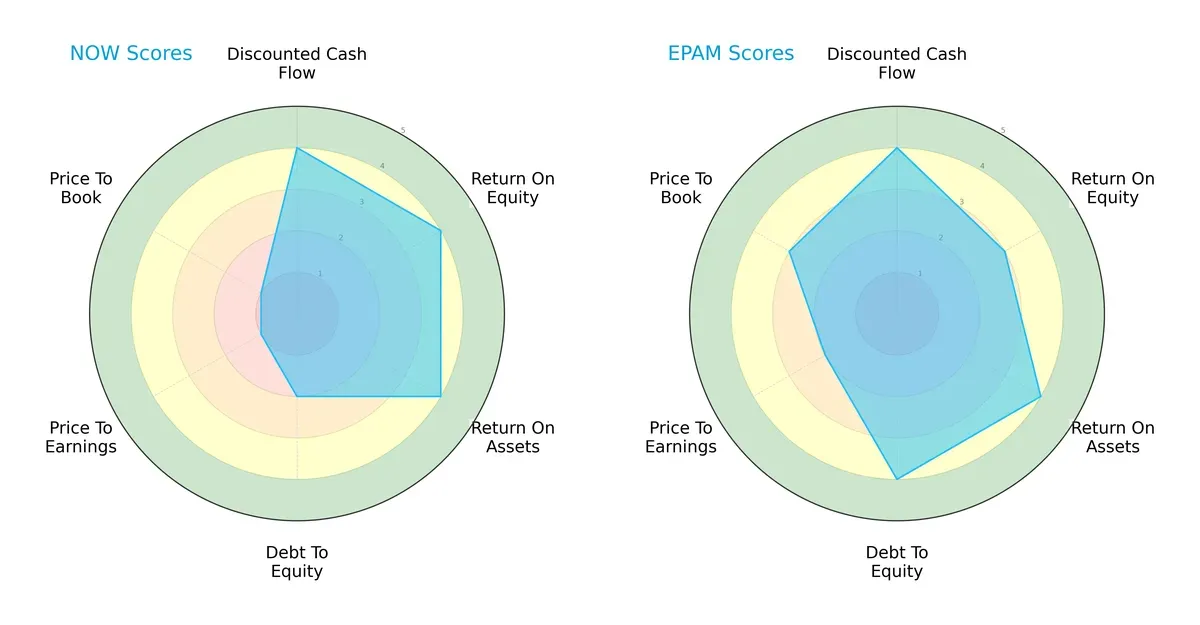
ServiceNow shows strong profitability metrics with ROE and ROA scores at 4, but suffers from weak valuation scores (PE and PB at 1), signaling potential overvaluation. EPAM delivers a more balanced profile, scoring well on debt-to-equity (4) and valuation metrics (PE 2, PB 3), though its ROE is slightly lower at 3. EPAM’s financial stability and reasonable valuation provide a steadier investment proposition, whereas ServiceNow relies heavily on operational efficiency despite valuation risks.
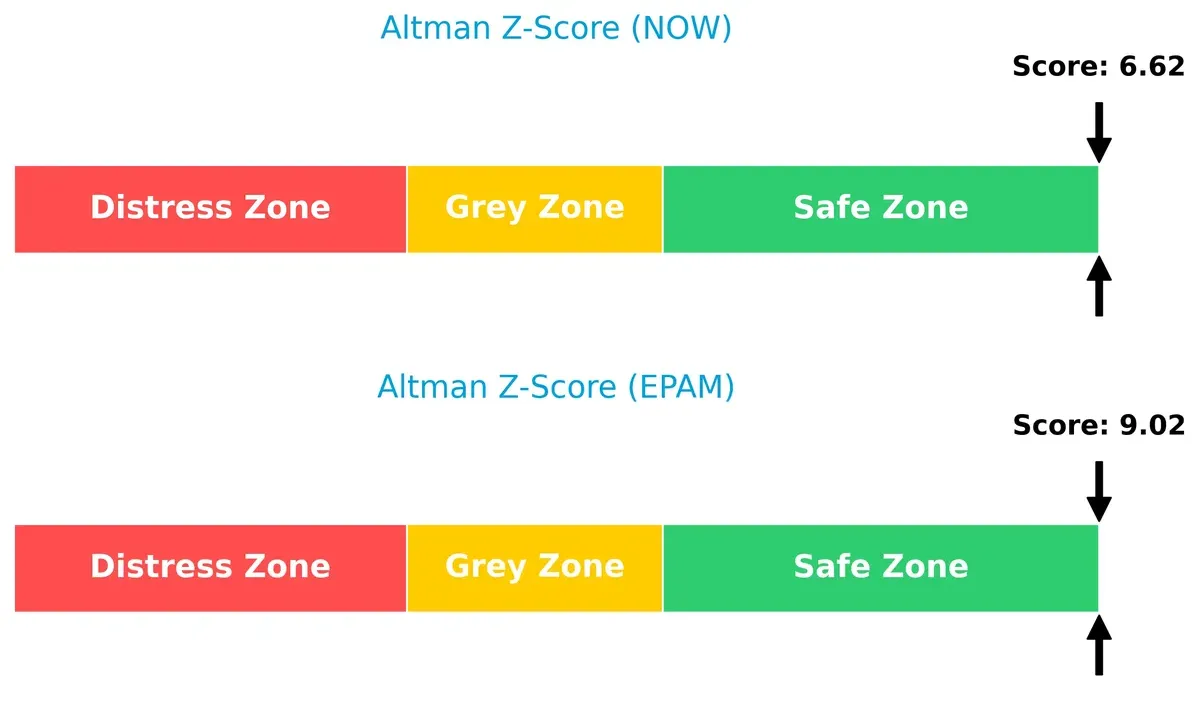
Bankruptcy Risk: Solvency Showdown
The Altman Z-Scores place both companies firmly in the safe zone, with EPAM at 9.02 and ServiceNow at 6.62, underscoring their strong solvency and low bankruptcy risk in this cycle:
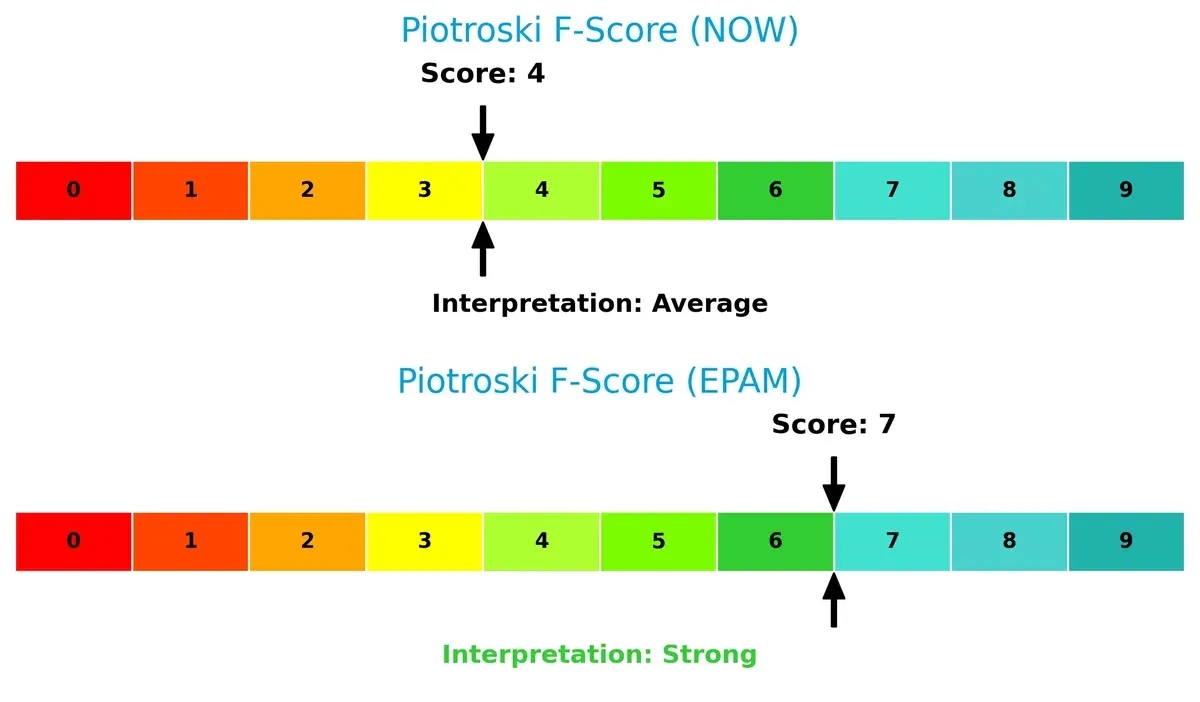
Financial Health: Quality of Operations
EPAM’s Piotroski F-Score of 7 signals robust financial health and operational quality. ServiceNow’s score of 4 raises some internal red flags, indicating potential weaknesses in financial efficiency and stability relative to EPAM:
How are the two companies positioned?
This section dissects the operational DNA of ServiceNow and EPAM by comparing their revenue distribution by segment and internal dynamics. The goal is to confront their economic moats and identify which model offers the most resilient competitive advantage today.
Revenue Segmentation: The Strategic Mix
This visual comparison dissects how ServiceNow, Inc. and EPAM Systems, Inc. diversify their income streams and where their primary sector bets lie:
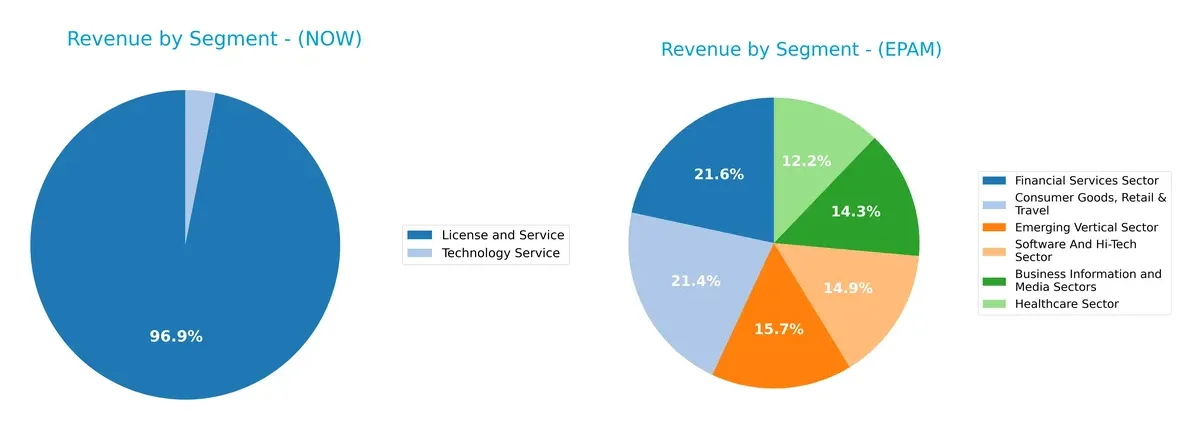
ServiceNow leans heavily on its License and Service segment, generating $12.9B in 2025, dwarfing its Technology Service at $414M. EPAM presents a balanced portfolio across six sectors, with Consumer Goods, Retail & Travel at $1B and Financial Services near $1B. ServiceNow’s concentration signals strong ecosystem lock-in but raises concentration risk. EPAM’s diversified base mitigates risk and leverages multiple sector growth avenues.
Strengths and Weaknesses Comparison
This table compares the Strengths and Weaknesses of ServiceNow, Inc. and EPAM Systems, Inc.:
NOW Strengths
- Strong global presence with $8.3B in North America and $3.4B in EMEA
- Favorable low debt ratios and infinite interest coverage
- High fixed asset turnover at 4.29
- Robust net margin of 13.16%
EPAM Strengths
- Diversified revenue across multiple sectors including Financial and Healthcare
- Strong liquidity with current ratio of 2.96
- Very low debt-to-assets at 3.44%
- High fixed asset turnover at 14.07
- Favorable infinite interest coverage
NOW Weaknesses
- Unfavorable valuation metrics with PE at 90.88 and PB at 12.25
- Current ratio below 1.0 at 0.95 signals liquidity risk
- Zero dividend yield
- Neutral ROIC barely above WACC at 8.98%
- Moderate asset turnover at 0.51
EPAM Weaknesses
- Unfavorable ROIC at 10.67% below high WACC of 11.82%
- Unfavorable PE at 29.47 and PB at 3.69
- Zero dividend yield
- Moderate net margin at 9.61%
- Higher proportion of unfavorable ratios at 35.71%
ServiceNow exhibits strong market share and solid financial leverage but faces valuation and liquidity challenges. EPAM shows broad sector diversification and excellent liquidity but struggles with returns below capital costs and valuation concerns. Both companies demonstrate strengths and weaknesses impacting their strategic financial positioning.
The Moat Duel: Analyzing Competitive Defensibility
A structural moat is the only reliable barrier that protects long-term profits from relentless competitive erosion. Let’s dissect the moats of two tech firms:
ServiceNow, Inc.: Workflow Automation with Growing Profitability
ServiceNow’s moat stems from high switching costs embedded in its Now platform, locking clients into workflow automation. Its robust 77.5% gross margin and expanding EBIT margin reflect margin stability. In 2026, expanding AI-driven services could deepen this advantage, though intensifying cloud competition poses risks.
EPAM Systems, Inc.: Engineering Services Facing Margin Compression
EPAM relies on specialized engineering services and digital platform expertise, differentiating it from ServiceNow’s product-centric moat. However, its lower 30.7% gross margin and declining ROIC signal margin pressure. Opportunities in AI and robotics could unlock growth, but falling profitability threatens moat durability.
Workflow Automation vs. Engineering Services: The Moat Showdown
ServiceNow’s expanding profitability and strong switching costs create a wider, more durable moat than EPAM’s shrinking returns. I see ServiceNow better equipped to defend and grow its market share amid evolving tech demands.
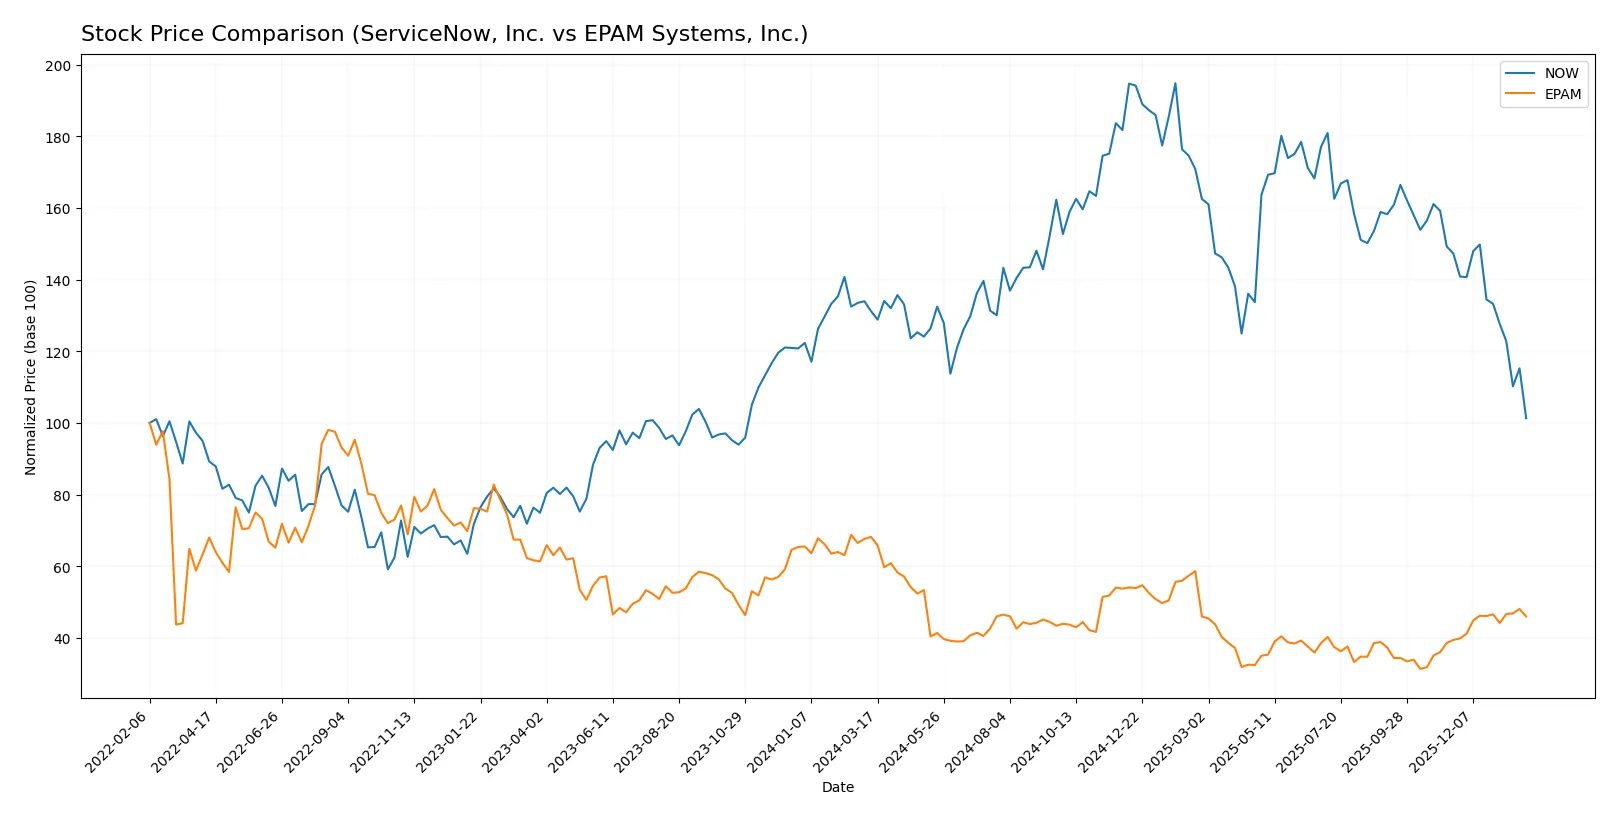
Which stock offers better returns?
The past 12 months reveal contrasting dynamics for ServiceNow, Inc. and EPAM Systems, Inc., with both exhibiting significant price declines but differing recent momentum and trading volume trends.
Trend Comparison
ServiceNow, Inc. shows a bearish trend over the past year, with a -22.79% price decline and decelerating downward momentum. The stock hit a high of 225.0 and a low of 117.01, reflecting notable volatility (std dev 24.31).
EPAM Systems, Inc. also displays a bearish trend with a -32.58% yearly decline but accelerating downward momentum. It ranged between 309.4 and 142.38, showing higher volatility (std dev 36.08). Recently, EPAM reversed with a 16.52% gain.
Comparing both, ServiceNow has delivered a smaller loss than EPAM over the year. EPAM’s recent recovery contrasts with ServiceNow’s continued weakness, making its market performance more volatile overall.
Target Prices
Analysts present a wide target price range reflecting varied outlooks for ServiceNow, Inc. and EPAM Systems, Inc.
| Company | Target Low | Target High | Consensus |
|---|---|---|---|
| ServiceNow, Inc. | 115 | 1315 | 440.14 |
| EPAM Systems, Inc. | 175 | 247 | 214 |
ServiceNow’s consensus target of 440.14 far exceeds its current 117 price, indicating strong growth expectations despite wide analyst divergence. EPAM’s consensus target of 214 closely aligns with its current 208.6 price, suggesting moderate upside potential.

Don’t Let Luck Decide Your Entry Point
Optimize your entry points with our advanced ProRealTime indicators. You’ll get efficient buy signals with precise price targets for maximum performance. Start outperforming now!
How do institutions grade them?
This section compares the latest institutional grades for ServiceNow, Inc. and EPAM Systems, Inc.:
ServiceNow, Inc. Grades
Here are the recent grades issued by major financial institutions for ServiceNow, Inc.:
| Grading Company | Action | New Grade | Date |
|---|---|---|---|
| Citigroup | Maintain | Buy | 2026-01-30 |
| BTIG | Maintain | Buy | 2026-01-29 |
| Stifel | Maintain | Buy | 2026-01-29 |
| RBC Capital | Maintain | Outperform | 2026-01-29 |
| Macquarie | Maintain | Neutral | 2026-01-29 |
| DA Davidson | Maintain | Buy | 2026-01-29 |
| Needham | Maintain | Buy | 2026-01-29 |
| Keybanc | Maintain | Underweight | 2026-01-29 |
| Evercore ISI Group | Maintain | Outperform | 2026-01-29 |
| Cantor Fitzgerald | Maintain | Overweight | 2026-01-29 |
EPAM Systems, Inc. Grades
The following table shows recent grades from reputable firms for EPAM Systems, Inc.:
| Grading Company | Action | New Grade | Date |
|---|---|---|---|
| Citigroup | Maintain | Neutral | 2026-01-29 |
| Wells Fargo | Maintain | Overweight | 2026-01-14 |
| TD Cowen | Maintain | Buy | 2026-01-09 |
| Mizuho | Maintain | Outperform | 2025-11-11 |
| JP Morgan | Maintain | Overweight | 2025-11-07 |
| Morgan Stanley | Maintain | Equal Weight | 2025-09-09 |
| JP Morgan | Maintain | Overweight | 2025-08-20 |
| Barclays | Maintain | Overweight | 2025-05-12 |
| Needham | Maintain | Buy | 2025-05-09 |
| Piper Sandler | Maintain | Neutral | 2025-05-09 |
Which company has the best grades?
ServiceNow, Inc. has received more consistent Buy and Outperform grades from top-tier firms than EPAM Systems, Inc., which shows a broader range from Neutral to Overweight. This could indicate stronger institutional confidence in ServiceNow’s near-term prospects.
Risks specific to each company
The following categories identify the critical pressure points and systemic threats facing both firms in the 2026 market environment:
1. Market & Competition
ServiceNow, Inc.
- Dominates enterprise cloud automation with strong customer base but faces intense software innovation competition.
EPAM Systems, Inc.
- Competes globally in digital engineering services amid rising demand but contends with numerous agile IT service firms.
2. Capital Structure & Debt
ServiceNow, Inc.
- Maintains low debt-to-equity ratio (0.25), signaling prudent leverage and manageable financial risk.
EPAM Systems, Inc.
- Exhibits even lower debt (0.04), reflecting a conservative balance sheet and strong liquidity position.
3. Stock Volatility
ServiceNow, Inc.
- Beta near 1 (0.979) indicates stock volatility aligned with the overall market, less risky for stability seekers.
EPAM Systems, Inc.
- High beta (1.727) reveals greater volatility and sensitivity to market swings, increasing investor risk.
4. Regulatory & Legal
ServiceNow, Inc.
- Faces regulatory scrutiny in data privacy and cloud security but benefits from established compliance frameworks.
EPAM Systems, Inc.
- Operates under complex international regulations, with heightened exposure due to global service delivery and geopolitical factors.
5. Supply Chain & Operations
ServiceNow, Inc.
- Relies on robust cloud infrastructure partnerships but risks disruption from technological shifts or vendor issues.
EPAM Systems, Inc.
- Dependent on a large global workforce and infrastructure, vulnerable to operational disruptions and talent retention challenges.
6. ESG & Climate Transition
ServiceNow, Inc.
- Invests in sustainable cloud operations but must enhance disclosures to meet rising ESG investor demands.
EPAM Systems, Inc.
- Advances digital solutions for clients’ climate goals but faces pressure to reduce own carbon footprint amid global scrutiny.
7. Geopolitical Exposure
ServiceNow, Inc.
- Primarily US-based with moderate international exposure, limiting direct geopolitical risk but sensitive to trade policies.
EPAM Systems, Inc.
- Strong global presence increases exposure to geopolitical tensions and regulatory changes, especially in Eastern Europe and Asia.
Which company shows a better risk-adjusted profile?
ServiceNow’s main risk stems from stretched valuation multiples amid market competition and innovation pressure. EPAM faces higher stock volatility and geopolitical risks but boasts stronger liquidity and operational scale. EPAM’s higher Altman Z-score and Piotroski score reflect superior financial resilience. Overall, EPAM exhibits a more balanced risk-adjusted profile given its lower leverage, robust liquidity, and strong operational metrics despite market volatility.
Final Verdict: Which stock to choose?
ServiceNow’s superpower lies in its unmatched ability to convert rapid revenue growth into expanding profitability. I see its growing profitability as a sign of strengthening strategic positioning. However, its low current ratio remains a point of vigilance, indicating potential short-term liquidity stress. It fits best in aggressive growth portfolios willing to tolerate operational tightness.
EPAM Systems commands a strategic moat through its strong balance sheet and operational efficiency, with a notably high current ratio signaling robust liquidity. Compared to ServiceNow, EPAM offers a safer profile but with slower growth momentum. It suits portfolios focused on GARP—balancing reasonable valuation with consistent operational steadiness.
If you prioritize aggressive expansion and can manage liquidity risks, ServiceNow outshines with its accelerating profitability and market scale. However, if you seek stability and healthier short-term financials, EPAM offers better stability and a stronger balance sheet, despite slower growth. Both present distinct analytical scenarios tailored to different investor appetites.
Disclaimer: Investment carries a risk of loss of initial capital. The past performance is not a reliable indicator of future results. Be sure to understand risks before making an investment decision.
Go Further
I encourage you to read the complete analyses of ServiceNow, Inc. and EPAM Systems, Inc. to enhance your investment decisions: