Home > Comparison > Technology > NOW vs ASAN
The strategic rivalry between ServiceNow, Inc. and Asana, Inc. shapes the evolution of the technology software-application sector. ServiceNow operates as a capital-intensive enterprise cloud solutions provider, while Asana delivers a lean, work management platform focused on team productivity. This head-to-head pits a market-leading automation powerhouse against an agile innovator. This analysis clarifies which trajectory offers superior risk-adjusted returns for a diversified portfolio.
Table of contents
Companies Overview
ServiceNow and Asana both shape the evolving landscape of enterprise software, targeting workflow and productivity enhancement.
ServiceNow, Inc.: Enterprise Cloud Workflow Leader
ServiceNow dominates as a provider of enterprise cloud computing solutions. It generates revenue by automating and managing workflows across IT, HR, security, and customer service sectors. In 2026, the company sharpened its strategic focus on expanding AI-driven automation and deepening partnerships, notably with Celonis, to accelerate process optimization.
Asana, Inc.: Collaborative Work Management Platform
Asana serves as a work management platform for teams and executives, enabling orchestration of tasks and strategic initiatives. It monetizes by offering subscription-based access to its software across diverse industries. The firm prioritizes enhancing cross-functional collaboration and scaling its platform globally to capture a growing remote workforce.
Strategic Collision: Similarities & Divergences
Both firms emphasize workflow efficiency but diverge sharply in scale and scope. ServiceNow pursues an integrated enterprise approach with a closed ecosystem of automation tools. Asana opts for a more open, user-centric platform focused on task management. Their primary battleground lies in winning corporate clients seeking digital transformation. ServiceNow’s mature model contrasts with Asana’s growth-oriented profile.
Income Statement Comparison
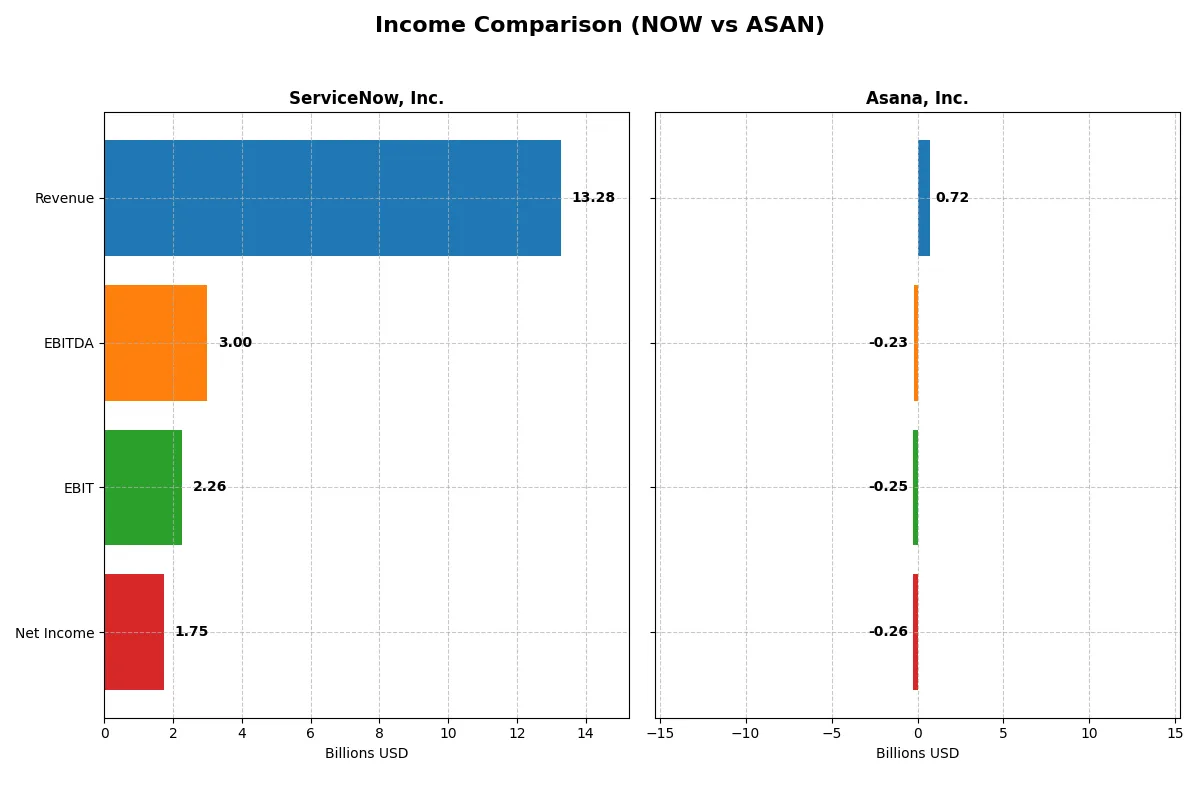
The following data dissects the core profitability and scalability of both corporate engines to reveal who dominates the bottom line:
| Metric | ServiceNow, Inc. (NOW) | Asana, Inc. (ASAN) |
|---|---|---|
| Revenue | 13.3B | 724M |
| Cost of Revenue | 2.98B | 77.2M |
| Operating Expenses | 8.47B | 913M |
| Gross Profit | 10.3B | 647M |
| EBITDA | 3.00B | -230M |
| EBIT | 2.26B | -247M |
| Interest Expense | 0 | 3.68M |
| Net Income | 1.75B | -256M |
| EPS | 1.69 | -1.11 |
| Fiscal Year | 2025 | 2025 |
Income Statement Analysis: The Bottom-Line Duel
This income statement comparison reveals how efficiently each company converts revenue into profit and manages costs to sustain growth.
ServiceNow, Inc. Analysis
ServiceNow’s revenue surged from 5.9B in 2021 to 13.3B in 2025, reflecting robust growth. Net income expanded dramatically to 1.75B in 2025, signaling strong bottom-line momentum. Gross margin holds steady at 77.5%, while net margin improved to 13.2%, underscoring operational efficiency and favorable cost management.
Asana, Inc. Analysis
Asana’s revenue climbed steadily from 227M in 2021 to 724M in early 2025. However, it remains unprofitable with a net loss of 256M in 2025 despite an excellent gross margin of 89.3%. Negative EBIT margin (-34.1%) and net margin (-35.3%) signal ongoing challenges in controlling operating expenses and achieving profitability.
Margin Strength vs. Profitability Scale
ServiceNow combines impressive revenue scale with healthy profit margins, delivering consistent net income growth and operational leverage. Asana boasts strong revenue growth and gross margin but struggles with persistent losses. For investors, ServiceNow’s profile offers a clearer path to sustainable profitability and value creation.
Financial Ratios Comparison
These vital ratios act as a diagnostic tool to expose the underlying fiscal health, valuation premiums, and capital efficiency of the companies compared below:
| Ratios | ServiceNow, Inc. (NOW) | Asana, Inc. (ASAN) |
|---|---|---|
| ROE | 13.48% | -112.31% |
| ROIC | 8.98% | -53.03% |
| P/E | 90.88 | -19.16 |
| P/B | 12.25 | 21.52 |
| Current Ratio | 0.95 | 1.44 |
| Quick Ratio | 0.95 | 1.44 |
| D/E | 0.25 | 1.18 |
| Debt-to-Assets | 12.30% | 30.11% |
| Interest Coverage | 0 | -72.42 |
| Asset Turnover | 0.51 | 0.81 |
| Fixed Asset Turnover | 4.29 | 2.76 |
| Payout ratio | 0 | 0 |
| Dividend yield | 0 | 0 |
| Fiscal Year | 2025 | 2025 |
Efficiency & Valuation Duel: The Vital Signs
Ratios act as a company’s DNA, unveiling hidden risks and operational excellence beneath surface-level financials.
ServiceNow, Inc.
ServiceNow delivers solid profitability with a 13.48% ROE and a favorable 13.16% net margin, reflecting operational strength. However, its P/E ratio at 90.9 signals an expensive valuation, stretched by high expectations. The company does not pay dividends but invests heavily in R&D, fueling growth and innovation.
Asana, Inc.
Asana struggles with deeply negative profitability metrics, including a -112.3% ROE and -35.3% net margin, signaling operational challenges. Its P/E ratio is negative, indicating losses, but the EV/sales ratio is moderate at 6.9. The firm offers no dividend, focusing on reinvestment for future growth despite weak returns.
Premium Valuation vs. Operational Strain
ServiceNow balances high valuation with stable profitability and disciplined capital allocation, presenting a slightly favorable risk-return profile. Asana’s metrics reveal significant operational risk and unproven profitability. Investors seeking growth with tolerance for volatility might consider Asana; those prioritizing earnings stability will find ServiceNow more fitting.
Which one offers the Superior Shareholder Reward?
I observe that ServiceNow (NOW) opts for zero dividends but invests heavily in growth and maintains robust free cash flow, with a healthy buyback capacity. Asana (ASAN) also pays no dividends but suffers persistent losses and negative margins, limiting buyback potential. NOW trades at a premium but boasts sustainable cash generation and prudent capital allocation. ASAN’s negative profitability and high leverage undermine shareholder returns. I conclude that ServiceNow offers a far superior total shareholder reward in 2026.
Comparative Score Analysis: The Strategic Profile
The radar chart reveals the fundamental DNA and trade-offs of ServiceNow, Inc. and Asana, Inc., highlighting their financial strengths and weaknesses across key metrics:
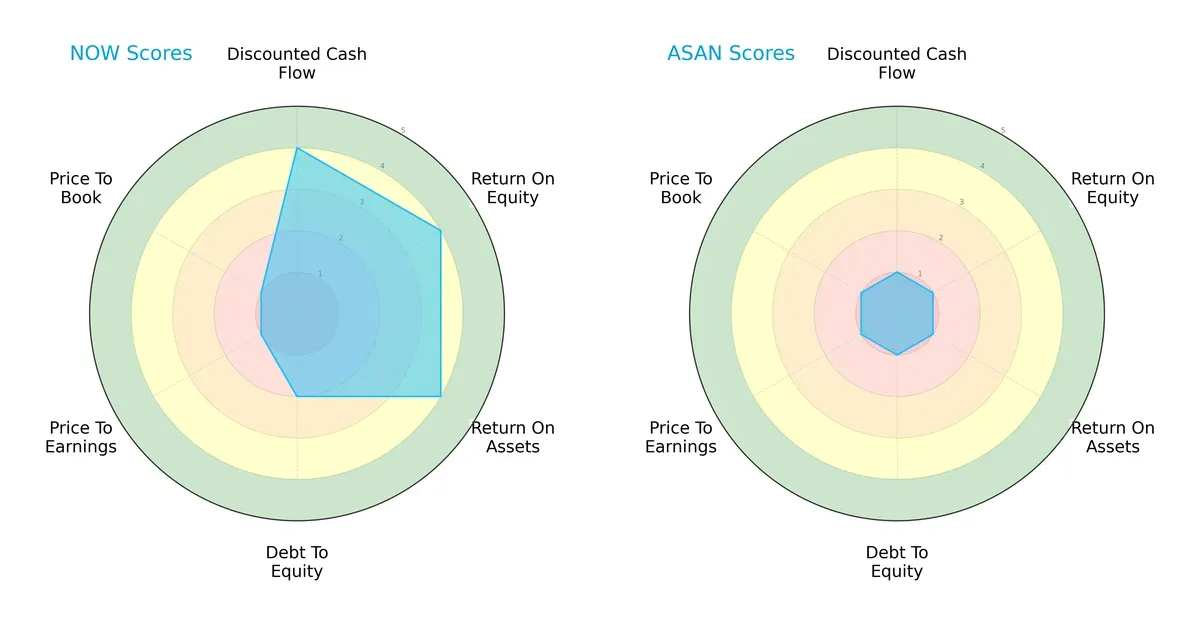
ServiceNow boasts a balanced profile with strong DCF, ROE, and ROA scores, reflecting efficient profitability and asset use. Its moderate debt/equity score suggests manageable leverage, though valuation scores indicate possible overpricing. In contrast, Asana struggles across all metrics, lacking any clear competitive edge and showing significant financial weakness. ServiceNow clearly offers a more stable and diversified investment case.
Bankruptcy Risk: Solvency Showdown
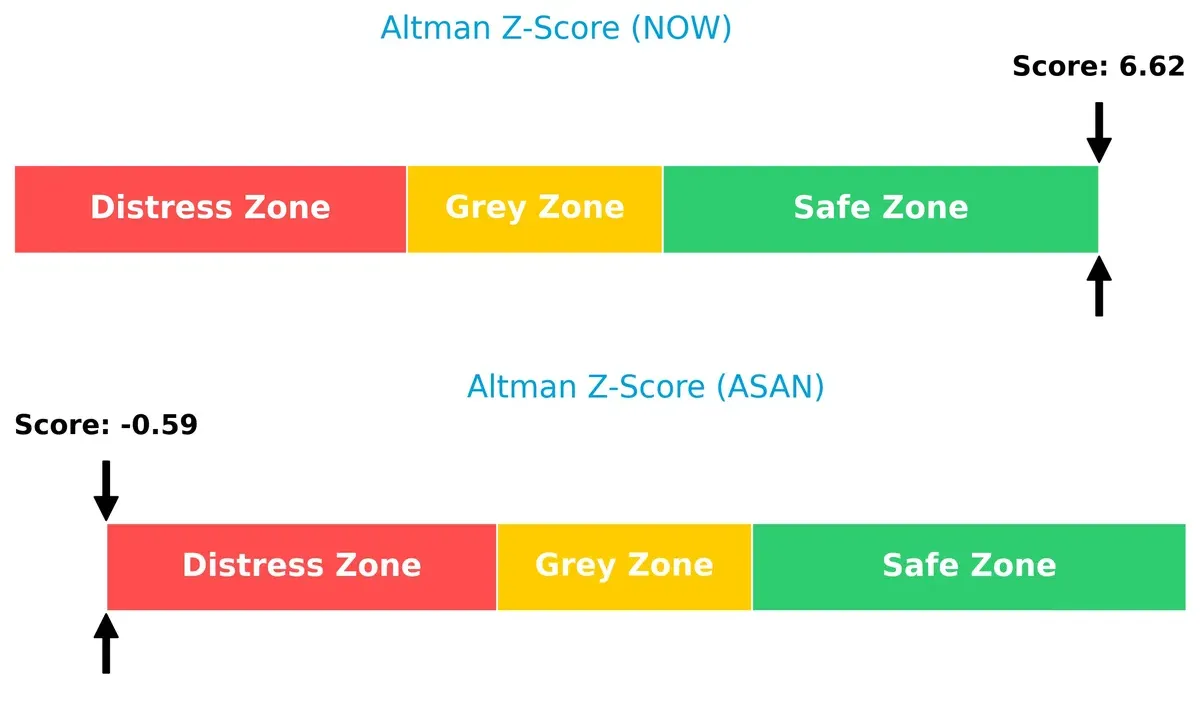
ServiceNow’s Altman Z-Score of 6.6 places it comfortably in the safe zone, signaling robust financial health. Asana’s score below zero puts it deep in the distress zone, indicating a high bankruptcy risk in this cycle:
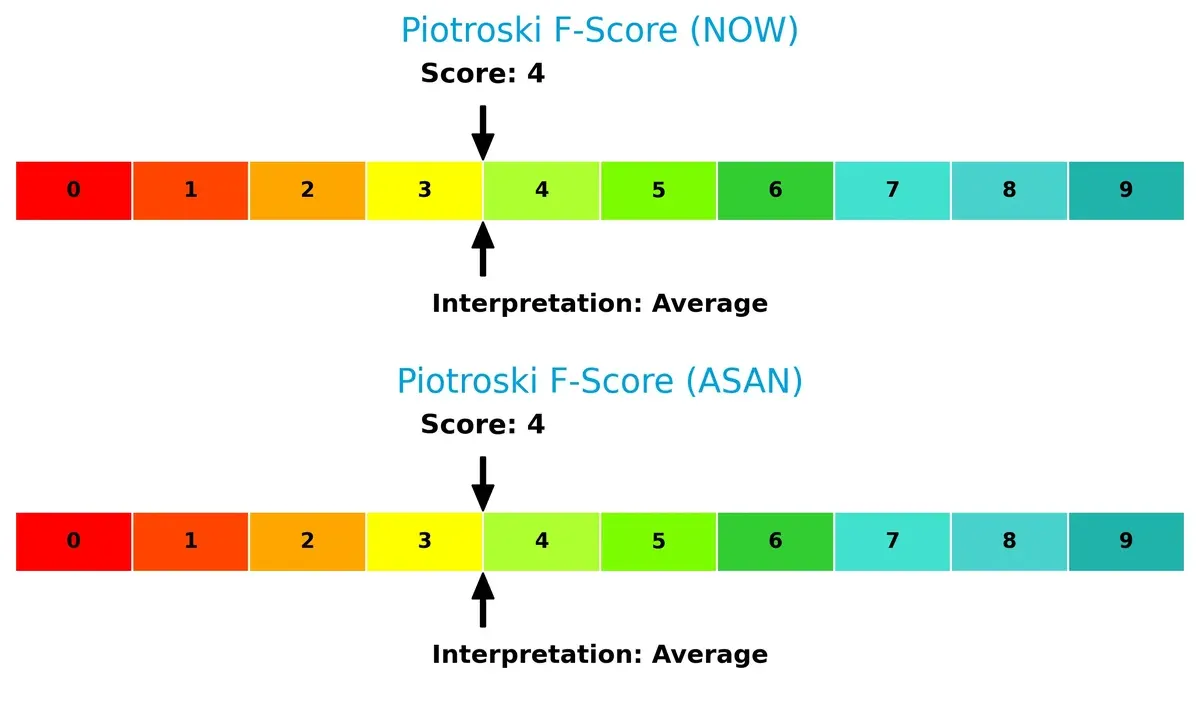
Financial Health: Quality of Operations
Both companies share an average Piotroski F-Score of 4, suggesting moderate operational quality. Neither stands out in financial robustness, but Asana’s broader risks overshadow this parity:
How are the two companies positioned?
This section dissects the operational DNA of ServiceNow and Asana by comparing their revenue distribution and internal dynamics. The goal is to confront their economic moats and reveal which model offers the most resilient, sustainable advantage today.
Revenue Segmentation: The Strategic Mix
This visual comparison dissects how ServiceNow, Inc. and Asana, Inc. diversify their income streams and reveals their primary sector bets:
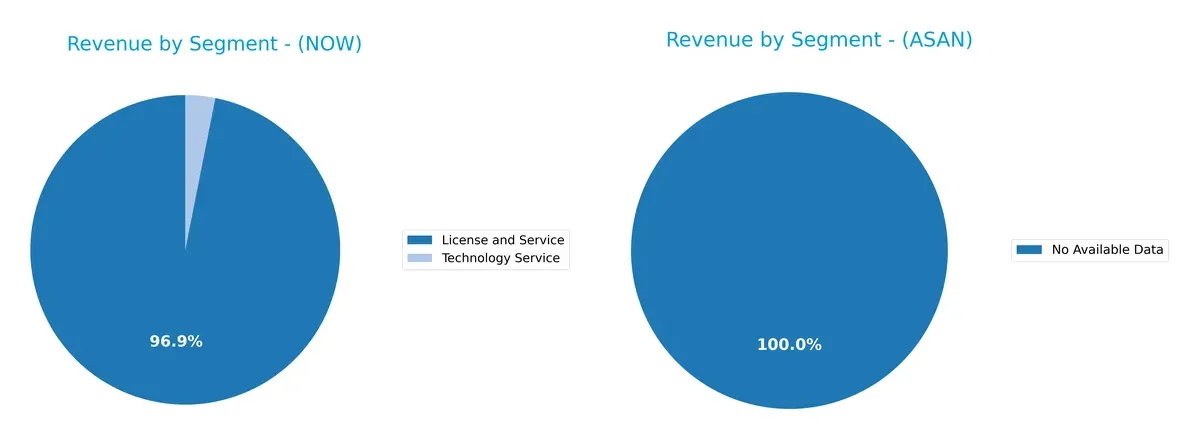
ServiceNow anchors its revenue in License and Service, with $12.9B in 2025, dwarfing its Technology Service at $414M. This concentration signals strong ecosystem lock-in. Asana lacks available segment data, preventing segmentation analysis. ServiceNow’s dominant, focused mix contrasts with Asana’s unknown diversification, highlighting ServiceNow’s infrastructure dominance and potential exposure to license market shifts.
Strengths and Weaknesses Comparison
This table compares the Strengths and Weaknesses of ServiceNow and Asana:
ServiceNow Strengths
- Strong revenue growth across Digital Workflow and ITOM products
- Diverse geographic presence with $13.5B revenue mainly from North America and EMEA
- Favorable leverage ratios and interest coverage
- Neutral ROIC above WACC supports capital efficiency
Asana Strengths
- Favorable cost of capital (WACC 7.67%)
- Positive PE ratio despite losses
- Quick ratio of 1.44 indicates liquidity
- Expanding international revenue from $288M Non-US sales in 2025
ServiceNow Weaknesses
- High valuation multiples (PE 90.88, PB 12.25) may pressure returns
- Current ratio below 1 signals liquidity risk
- Zero dividend yield limits income appeal
- Neutral ROE and asset turnover suggest efficiency limits
Asana Weaknesses
- Negative net margin (-35.3%) and ROE (-112.31%) reflect unprofitability
- High debt-to-equity (1.18) risks solvency
- Negative interest coverage indicates financing strain
- Elevated PB ratio (21.52) signals overvaluation
ServiceNow’s strengths lie in robust revenue scale, geographic diversification, and financial stability. Asana faces profitability and leverage challenges despite liquidity and favorable financing. These contrasts shape each company’s strategic priorities.
The Moat Duel: Analyzing Competitive Defensibility
A structural moat is the only reliable barrier protecting long-term profits from relentless competition erosion. Let’s dissect the moats of two software players:
ServiceNow, Inc.: Workflow Automation with Expanding Reach
ServiceNow’s moat stems from high switching costs embedded in its integrated workflow platform. This drives margin stability and a growing ROIC trend. Expansion into AI and global markets in 2026 should deepen its competitive edge.
Asana, Inc.: Emerging Player with Network Effects Challenges
Asana relies on network effects within its collaborative work management platform but suffers from declining ROIC and negative margins. Its moat is narrower and fragile compared to ServiceNow’s entrenched ecosystem. Growth in international sales offers upside but also intensifies competitive pressures.
Verdict: Switching Costs vs. Nascent Network Effects
ServiceNow’s widening switching cost moat outmatches Asana’s shrinking network effect advantage. With improving profitability and scale, ServiceNow is better positioned to defend and extend market share in 2026.
Which stock offers better returns?
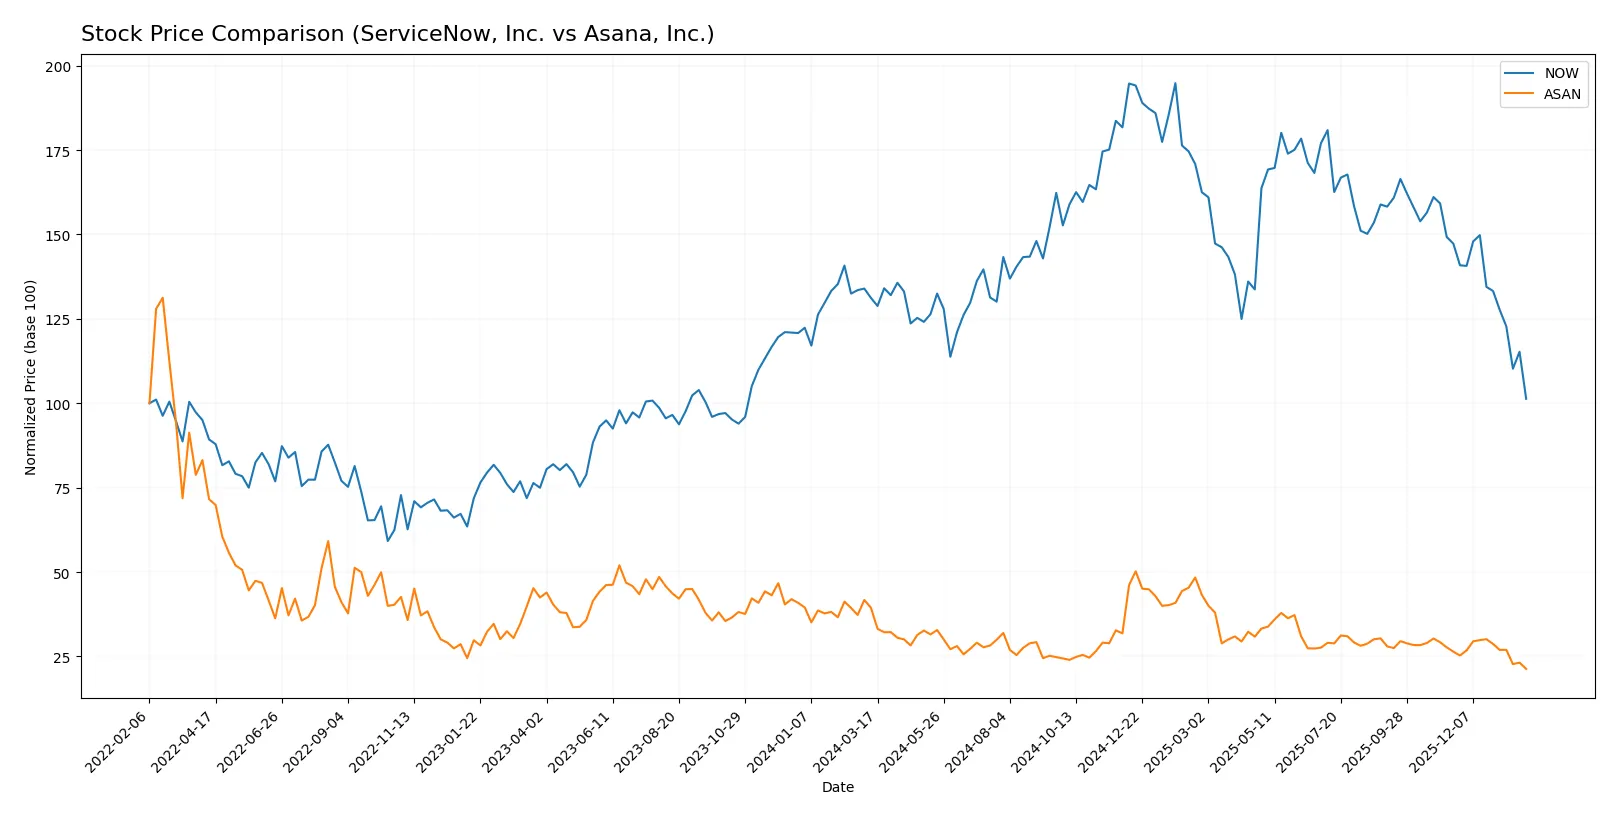
The past year shows clear downward trends for both stocks, with ServiceNow experiencing sharper declines and higher volatility compared to Asana’s more gradual slide.
Trend Comparison
ServiceNow’s stock fell 22.79% over the last 12 months, marking a bearish trend with decelerating losses. Its price ranged between 225.0 and 117.01, exhibiting high volatility (std. dev. 24.31).
Asana’s stock declined 45.97% over the same period, also bearish with deceleration. Price fluctuated between 24.15 and 10.25 but showed much lower volatility (std. dev. 2.88).
Comparing trends, ServiceNow outperformed Asana, delivering smaller losses despite higher volatility and a more dominant seller presence in recent trading.
Target Prices
Analysts present a wide range of target prices, signaling diverse expectations for ServiceNow, Inc. and Asana, Inc.
| Company | Target Low | Target High | Consensus |
|---|---|---|---|
| ServiceNow, Inc. | 115 | 1315 | 440.14 |
| Asana, Inc. | 14 | 18 | 15.75 |
ServiceNow’s consensus target of 440.14 far exceeds its current price of 117.01, indicating strong long-term growth potential despite wide analyst disagreement. Asana’s consensus at 15.75 suggests modest upside from its current 10.25 price but reflects cautious optimism.

Don’t Let Luck Decide Your Entry Point
Optimize your entry points with our advanced ProRealTime indicators. You’ll get efficient buy signals with precise price targets for maximum performance. Start outperforming now!
How do institutions grade them?
ServiceNow, Inc. Grades
Below is a summary of recent grades for ServiceNow, Inc. from major institutions.
| Grading Company | Action | New Grade | Date |
|---|---|---|---|
| Citigroup | Maintain | Buy | 2026-01-30 |
| Macquarie | Maintain | Neutral | 2026-01-29 |
| Keybanc | Maintain | Underweight | 2026-01-29 |
| DA Davidson | Maintain | Buy | 2026-01-29 |
| BTIG | Maintain | Buy | 2026-01-29 |
| Stifel | Maintain | Buy | 2026-01-29 |
| Needham | Maintain | Buy | 2026-01-29 |
| RBC Capital | Maintain | Outperform | 2026-01-29 |
| Cantor Fitzgerald | Maintain | Overweight | 2026-01-29 |
| Evercore ISI Group | Maintain | Outperform | 2026-01-29 |
Asana, Inc. Grades
The table below shows recent institutional grades for Asana, Inc.
| Grading Company | Action | New Grade | Date |
|---|---|---|---|
| Citigroup | Upgrade | Buy | 2026-01-15 |
| RBC Capital | Maintain | Underperform | 2026-01-05 |
| Keybanc | Upgrade | Overweight | 2025-12-15 |
| DA Davidson | Maintain | Neutral | 2025-12-04 |
| Citigroup | Maintain | Neutral | 2025-12-03 |
| UBS | Maintain | Neutral | 2025-12-03 |
| RBC Capital | Maintain | Underperform | 2025-12-03 |
| Baird | Maintain | Neutral | 2025-09-04 |
| Morgan Stanley | Maintain | Underweight | 2025-09-04 |
| Piper Sandler | Maintain | Overweight | 2025-09-04 |
Which company has the best grades?
ServiceNow, Inc. holds predominantly Buy and Outperform grades, signaling stronger institutional confidence. Asana, Inc.’s ratings are mixed, with upgrades but also several Underperform and Neutral grades. This divergence may influence investor sentiment and portfolio risk profiles differently.
Risks specific to each company
The following categories identify the critical pressure points and systemic threats facing both firms in the 2026 market environment:
1. Market & Competition
ServiceNow, Inc.
- Dominates enterprise cloud workflow with broad product suite, facing intense competition from legacy software and cloud giants.
Asana, Inc.
- Focuses on work management platform with niche presence, challenged by larger competitors and slower growth momentum.
2. Capital Structure & Debt
ServiceNow, Inc.
- Maintains low debt-to-equity ratio (0.25), strong interest coverage, signaling financial stability and prudent capital allocation.
Asana, Inc.
- High debt-to-equity (1.18) and negative interest coverage (-67) raise red flags about financial leverage and solvency risk.
3. Stock Volatility
ServiceNow, Inc.
- Beta near 1 (0.979) indicates market-aligned volatility, with a stable trading range but high valuation fluctuations.
Asana, Inc.
- Slightly lower beta (0.916) suggests modestly less volatility, but wider price range and lower liquidity increase unpredictability.
4. Regulatory & Legal
ServiceNow, Inc.
- Faces regulatory scrutiny typical for large SaaS providers, including data privacy and compliance risks across multiple sectors.
Asana, Inc.
- Similar regulatory exposure but smaller scale may reduce impact; however, reliance on growth markets adds compliance complexity.
5. Supply Chain & Operations
ServiceNow, Inc.
- Strong operational scale with extensive direct sales and partnerships; automation focus mitigates supply disruptions.
Asana, Inc.
- Smaller scale exposes Asana to operational bottlenecks and risk from third-party dependencies.
6. ESG & Climate Transition
ServiceNow, Inc.
- Increasing ESG initiatives aligned with enterprise clients’ demands, enhancing brand and regulatory compliance.
Asana, Inc.
- ESG efforts less mature, potentially limiting appeal to institutional investors focused on sustainability.
7. Geopolitical Exposure
ServiceNow, Inc.
- Global footprint exposes it to geopolitical tensions affecting data sovereignty and cross-border service delivery.
Asana, Inc.
- More US-centric operations reduce direct geopolitical risks but limit global growth opportunities.
Which company shows a better risk-adjusted profile?
ServiceNow’s strongest risk factor is its lofty valuation metrics (PE 90.88, PB 12.25), posing downside risk if growth slows. Asana’s capital structure and profitability metrics reveal severe financial distress risks, with negative ROE (-112%) and Altman Z-score in distress zone. I see ServiceNow as having a superior risk-adjusted profile due to stable leverage, solid operational scale, and safer financial footing. Asana’s high debt and sustained losses amplify vulnerability, despite its lower stock volatility. The stark contrast in Altman Z-scores—6.6 safe zone for ServiceNow versus -0.6 distress zone for Asana—justifies my caution.
Final Verdict: Which stock to choose?
ServiceNow, Inc. (NOW) wields unmatched operational efficiency and a steadily growing return on invested capital, signaling improving profitability. Its main point of vigilance is a current ratio slightly below 1, which hints at liquidity risks in a downturn. It fits best in aggressive growth portfolios seeking scalable SaaS leaders.
Asana, Inc. (ASAN) boasts a strategic moat in its innovative workflow platform and relatively stronger liquidity, reflected in a healthier current ratio. However, it struggles with declining profitability and negative returns on capital, marking a riskier profile than NOW. It suits investors with a high-risk tolerance eyeing early-stage growth potential.
If you prioritize resilient cash flow generation and improving profitability, NOW outshines due to its operational discipline and value creation trajectory. However, if you seek speculative growth with a focus on product innovation and can stomach volatility, ASAN offers a niche opportunity despite its financial headwinds. Both options require caution, but their investor avatars differ markedly.
Disclaimer: Investment carries a risk of loss of initial capital. The past performance is not a reliable indicator of future results. Be sure to understand risks before making an investment decision.
Go Further
I encourage you to read the complete analyses of ServiceNow, Inc. and Asana, Inc. to enhance your investment decisions: