In the dynamic world of technology, Salesforce, Inc. (CRM) and The Trade Desk, Inc. (TTD) stand out as leaders in software applications that transform how businesses engage with customers and markets. Both companies innovate within the marketing and advertising technology space, yet they approach it from unique angles—Salesforce with its comprehensive customer relationship management platform, and The Trade Desk with its data-driven advertising solutions. This article will help you decide which company offers the most compelling investment opportunity in 2026.
Table of contents
Companies Overview
I will begin the comparison between Salesforce, Inc. and The Trade Desk, Inc. by providing an overview of these two companies and their main differences.
Salesforce Overview
Salesforce, Inc. provides customer relationship management (CRM) technology designed to unify companies with their customers globally. Its comprehensive Customer 360 platform supports sales, service, marketing, commerce, analytics, and integration solutions across various industries. Headquartered in San Francisco, Salesforce leverages its scalable cloud-based offerings and extensive partner network to maintain a leading position in the software application market.
The Trade Desk Overview
The Trade Desk, Inc. operates a cloud-based platform enabling buyers to manage and optimize data-driven digital advertising campaigns across multiple formats and devices. Serving advertising agencies and service providers, it delivers broad reach in display, video, audio, native, and social advertising. Based in Ventura, California, The Trade Desk focuses on programmatic advertising technology and value-added data services, positioning itself in the technology software application sector.
Key similarities and differences
Both Salesforce and The Trade Desk operate in the technology sector within software applications, emphasizing cloud-based platforms to serve business customers. Salesforce offers a broad CRM suite across multiple business functions, while The Trade Desk specializes in data-driven digital advertising campaign management. Salesforce’s larger scale and diversified service portfolio contrast with The Trade Desk’s focused approach on programmatic advertising solutions.
Income Statement Comparison
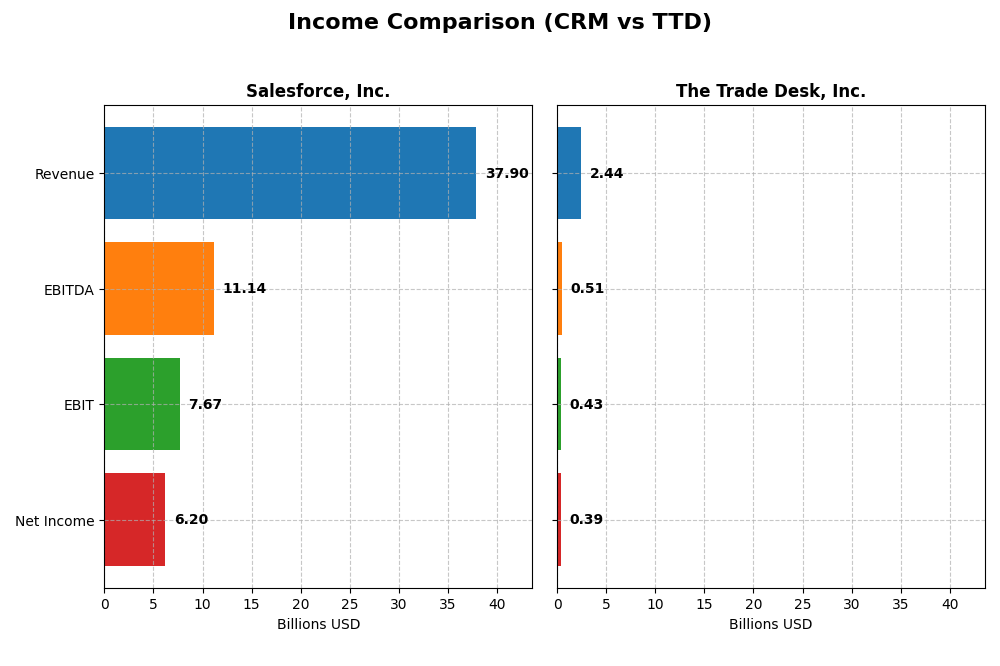
The table below presents a side-by-side comparison of key income statement metrics for Salesforce, Inc. and The Trade Desk, Inc. for their most recent fiscal years.
| Metric | Salesforce, Inc. (CRM) | The Trade Desk, Inc. (TTD) |
|---|---|---|
| Market Cap | 218.2B | 17.5B |
| Revenue | 37.9B | 2.44B |
| EBITDA | 11.1B | 515M |
| EBIT | 7.67B | 427M |
| Net Income | 6.20B | 393M |
| EPS | 6.44 | 0.80 |
| Fiscal Year | 2025 | 2024 |
Income Statement Interpretations
Salesforce, Inc.
Salesforce’s revenue and net income showed consistent growth from 2021 to 2025, with revenue rising from $21.3B to $37.9B and net income increasing from $4.1B to $6.2B. Margins remained strong, with a 2025 gross margin of 77.2% and a net margin of 16.4%. The latest year saw an 8.7% revenue growth and a 37.8% net margin increase, signaling improved profitability.
The Trade Desk, Inc.
The Trade Desk experienced rapid growth between 2020 and 2024, with revenue jumping from $836M to $2.44B and net income rising from $242M to $393M. Gross margin stood at 80.7%, and net margin was 16.1% in 2024. Recent performance showed a robust 25.6% revenue growth and a 74.9% net margin increase, reflecting strong operational leverage.
Which one has the stronger fundamentals?
Both companies exhibit favorable income statement trends with over 90% positive evaluations. Salesforce demonstrates steady, substantial growth and solid margins, while The Trade Desk shows faster growth rates but slightly lower EBIT margin. Salesforce holds a larger scale advantage, whereas The Trade Desk impresses with higher margin expansion and earnings growth.
Financial Ratios Comparison
The table below presents a side-by-side comparison of key financial ratios for Salesforce, Inc. (CRM) and The Trade Desk, Inc. (TTD) based on their most recent fiscal year data.
| Ratios | Salesforce, Inc. (CRM) FY 2025 | The Trade Desk, Inc. (TTD) FY 2024 |
|---|---|---|
| ROE | 10.13% | 13.33% |
| ROIC | 7.95% | 10.02% |
| P/E | 53.04 | 146.77 |
| P/B | 5.37 | 19.56 |
| Current Ratio | 1.06 | 1.86 |
| Quick Ratio | 1.06 | 1.86 |
| D/E | 0.19 | 0.11 |
| Debt-to-Assets | 11.07% | 5.11% |
| Interest Coverage | 26.49 | 0 |
| Asset Turnover | 0.37 | 0.40 |
| Fixed Asset Turnover | 7.03 | 5.17 |
| Payout Ratio | 24.80% | 0 |
| Dividend Yield | 0.47% | 0 |
Interpretation of the Ratios
Salesforce, Inc.
Salesforce shows a mix of strong and weak ratios, with favorable metrics in net margin, quick ratio, debt to equity, and interest coverage, but unfavorable P/E, P/B, asset turnover, and dividend yield. The dividend yield is low at 0.47%, indicating modest shareholder returns despite paying dividends. Its payout appears cautious, supported by solid free cash flow coverage.
The Trade Desk, Inc.
The Trade Desk presents generally favorable ratios, including strong current and quick ratios, debt metrics, and interest coverage, though its P/E and P/B remain high, signaling valuation concerns. The company does not pay dividends, likely reflecting its reinvestment strategy during growth phases, focusing on R&D and share buybacks instead to enhance shareholder value.
Which one has the best ratios?
The Trade Desk exhibits a more favorable overall ratio profile, with 57.14% favorable ratios compared to Salesforce’s 42.86%. Salesforce’s lower dividend yield and some unfavorable valuation ratios contrast with The Trade Desk’s lack of dividend but stronger liquidity and leverage ratios, suggesting different financial strategies and risk profiles.
Strategic Positioning
This section compares the strategic positioning of Salesforce, Inc. and The Trade Desk, Inc., including Market position, Key segments, and disruption:
Salesforce, Inc.
- Leading market position with strong competitive pressure in application software.
- Diversified segments: Sales, Service, Marketing, Commerce, Integration, Analytics, and Professional Services.
- Exposure to technological disruption through cloud platforms, analytics, and integration tools.
The Trade Desk, Inc.
- Smaller market cap, competing in digital advertising technology.
- Focused on self-service cloud platform for data-driven digital advertising campaigns.
- Technological disruption risk in digital advertising across multiple ad formats and devices.
Salesforce, Inc. vs The Trade Desk, Inc. Positioning
Salesforce has a diversified business model across multiple cloud and service segments, providing broad industry exposure. The Trade Desk concentrates on digital advertising technology, serving primarily advertising agencies, which narrows its market focus and growth drivers.
Which has the best competitive advantage?
Both companies have a slightly unfavorable moat status. Salesforce shows growing ROIC despite value shedding, while The Trade Desk has declining ROIC and is not yet creating value, indicating Salesforce holds a marginally stronger competitive position based on recent MOAT evaluations.
Stock Comparison
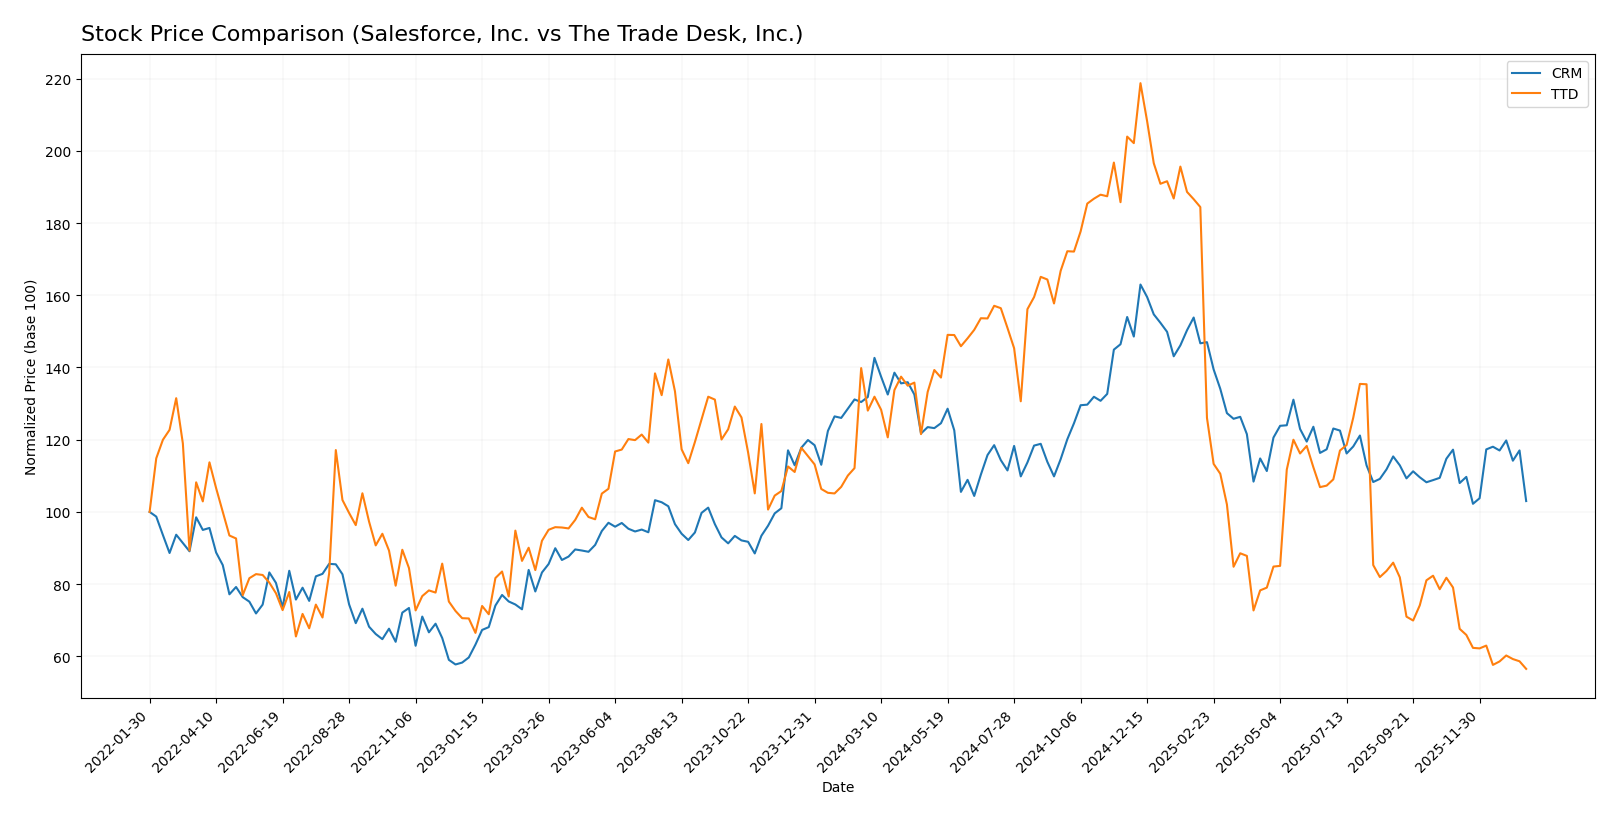
The stock prices of Salesforce, Inc. (CRM) and The Trade Desk, Inc. (TTD) both exhibited significant declines over the past 12 months, reflecting bearish trends with distinct acceleration patterns and volume dynamics.
Trend Analysis
Salesforce, Inc. (CRM) experienced a 21.86% price decline over the past year, marking a bearish trend with accelerating downward momentum. The stock ranged from a high of 361.99 to a low of 227.11, showing notable volatility with a standard deviation of 31.79.
The Trade Desk, Inc. (TTD) showed a more pronounced bearish trend with a 55.86% price drop over the same period. The trend exhibited deceleration and lower volatility than CRM, with prices fluctuating between 139.11 and 35.95 and a standard deviation of 28.35.
Comparing both, Salesforce delivered the higher market performance despite its bearish trend, as The Trade Desk’s price decline was substantially steeper over the past 12 months.
Target Prices
The current analyst consensus indicates a positive outlook for both Salesforce, Inc. and The Trade Desk, Inc.
| Company | Target High | Target Low | Consensus |
|---|---|---|---|
| Salesforce, Inc. | 400 | 250 | 324.17 |
| The Trade Desk, Inc. | 98 | 39 | 56.73 |
Analysts expect Salesforce’s stock to rise significantly above its current price of 228.25 USD, while The Trade Desk shows potential upside from 35.87 USD to a consensus near 57 USD.
Analyst Opinions Comparison
This section compares analysts’ ratings and key financial scores for Salesforce, Inc. (CRM) and The Trade Desk, Inc. (TTD):
Rating Comparison
CRM Rating
- Rating: B+, considered very favorable by analysts.
- Discounted Cash Flow Score: 4, indicating favorable cash flow projections.
- ROE Score: 4, showing efficient profit generation from equity.
- ROA Score: 4, reflecting effective asset utilization.
- Debt To Equity Score: 3, moderate financial risk with balanced leverage.
- Overall Score: 3, moderate overall financial standing.
TTD Rating
- Rating: B, also very favorable but slightly lower than CRM.
- Discounted Cash Flow Score: 4, equally favorable cash flow outlook.
- ROE Score: 4, equally efficient profit generation.
- ROA Score: 4, equally effective asset use.
- Debt To Equity Score: 3, also moderate financial risk.
- Overall Score: 3, matching moderate overall rating.
Which one is the best rated?
Based strictly on provided data, CRM holds a slightly better overall rating (B+) compared to TTD’s B, despite both companies sharing identical scores across key financial metrics and overall scores.
Scores Comparison
Here is a comparison of the Altman Z-Score and Piotroski Score for Salesforce, Inc. and The Trade Desk, Inc.:
Salesforce Scores
- Altman Z-Score: 5.26, indicating a safe zone with low bankruptcy risk.
- Piotroski Score: 7, reflecting strong financial health.
The Trade Desk Scores
- Altman Z-Score: 4.30, also in the safe zone showing financial stability.
- Piotroski Score: 5, indicating average financial strength.
Which company has the best scores?
Salesforce has higher scores in both Altman Z-Score and Piotroski Score compared to The Trade Desk. This suggests Salesforce exhibits stronger financial stability and health based on the provided metrics.
Grades Comparison
The following sections present the latest reliable grades from recognized financial firms for Salesforce, Inc. and The Trade Desk, Inc.:
Salesforce, Inc. Grades
Here is a table summarizing recent grades from established grading companies for Salesforce, Inc.:
| Grading Company | Action | New Grade | Date |
|---|---|---|---|
| Barclays | Maintain | Overweight | 2026-01-12 |
| RBC Capital | Maintain | Sector Perform | 2026-01-05 |
| Morgan Stanley | Maintain | Overweight | 2025-12-09 |
| Citigroup | Maintain | Neutral | 2025-12-08 |
| DA Davidson | Maintain | Neutral | 2025-12-05 |
| Citizens | Maintain | Market Outperform | 2025-12-04 |
| Deutsche Bank | Maintain | Buy | 2025-12-04 |
| Wedbush | Maintain | Outperform | 2025-12-04 |
| Northland Capital Markets | Maintain | Market Perform | 2025-12-04 |
| Canaccord Genuity | Maintain | Buy | 2025-12-04 |
Salesforce’s grades show a consistent positive outlook with multiple “Buy,” “Outperform,” and “Overweight” ratings maintained across several respected firms.
The Trade Desk, Inc. Grades
Below is the table of recent grades from credible grading companies for The Trade Desk, Inc.:
| Grading Company | Action | New Grade | Date |
|---|---|---|---|
| Morgan Stanley | Maintain | Equal Weight | 2026-01-13 |
| Wells Fargo | Maintain | Equal Weight | 2026-01-12 |
| Cantor Fitzgerald | Maintain | Neutral | 2026-01-08 |
| Wolfe Research | Maintain | Outperform | 2026-01-06 |
| Guggenheim | Maintain | Buy | 2026-01-05 |
| Jefferies | Maintain | Hold | 2025-12-11 |
| Wedbush | Maintain | Neutral | 2025-12-08 |
| DA Davidson | Maintain | Buy | 2025-11-10 |
| Truist Securities | Maintain | Buy | 2025-11-07 |
| Wells Fargo | Maintain | Equal Weight | 2025-11-07 |
The Trade Desk’s ratings are more mixed, with a balance of “Buy,” “Outperform,” “Hold,” and “Neutral” grades, reflecting a more cautious sentiment among analysts.
Which company has the best grades?
Salesforce, Inc. has received generally stronger and more consistent grades, with numerous “Buy,” “Overweight,” and “Outperform” ratings compared to The Trade Desk’s more mixed assessments. This difference may influence investor confidence and perceived stability.
Strengths and Weaknesses
Below is a comparative overview of Salesforce, Inc. (CRM) and The Trade Desk, Inc. (TTD) highlighting their key strengths and weaknesses based on recent financial and operational data.
| Criterion | Salesforce, Inc. (CRM) | The Trade Desk, Inc. (TTD) |
|---|---|---|
| Diversification | Highly diversified product portfolio with strong revenue streams from Service Cloud (9.05B), Sales Cloud (8.32B), and Integration & Analytics (5.78B) in 2025. | Less diversified; mainly focused on digital advertising technology with no detailed product segmentation available. |
| Profitability | Net margin at 16.35% (favorable), ROIC 7.95% (neutral), but ROIC below WACC indicating value destruction despite increasing profitability. | Net margin at 16.08% (favorable), ROIC 10.02% (favorable), but declining ROIC trend and slightly unfavorable moat status. |
| Innovation | Strong innovation in cloud-based software platforms; steady growth in cloud services revenue segments. | Focus on programmatic advertising technology innovation; however, profitability declining suggests challenges in sustaining growth. |
| Global presence | Extensive global footprint with a broad customer base across industries and regions. | Growing international presence but more concentrated in advertising markets. |
| Market Share | Leading market share in CRM and enterprise cloud software markets. | Significant player in programmatic advertising but smaller market share compared to traditional advertising giants. |
Key takeaways: Salesforce excels in diversification and global reach with improving profitability trends but currently sheds value. The Trade Desk shows strong profitability metrics but faces challenges with declining returns and a narrower focus. Both require cautious evaluation regarding their long-term value creation potential.
Risk Analysis
Below is a comparison table of key risk factors for Salesforce, Inc. (CRM) and The Trade Desk, Inc. (TTD) as of the most recent fiscal years available.
| Metric | Salesforce, Inc. (CRM) | The Trade Desk, Inc. (TTD) |
|---|---|---|
| Market Risk | Beta 1.27, high valuation increases volatility | Beta 1.11, high P/E implies vulnerability to market swings |
| Debt level | Low debt-to-equity 0.19, favorable leverage | Very low debt-to-equity 0.11, very strong balance sheet |
| Regulatory Risk | Moderate, tech sector faces evolving data/privacy laws | Moderate, ad tech industry under scrutiny for data use |
| Operational Risk | Medium, complexity in integrating multiple platforms | Medium, reliance on digital ad spending trends |
| Environmental Risk | Low, mostly digital services with limited physical footprint | Low, primarily cloud-based services |
| Geopolitical Risk | Moderate, global operations exposed to trade tensions | Moderate, international ad markets affected by geo-political shifts |
Salesforce’s most impactful risks stem from its relatively high market valuation and exposure to evolving data privacy regulations. The Trade Desk’s primary risks involve its high valuation multiples and sensitivity to digital advertising budgets, though it maintains a very strong balance sheet with minimal debt, lowering financial risk. Both companies operate in dynamic regulatory environments that require close monitoring.
Which Stock to Choose?
Salesforce, Inc. (CRM) shows a favorable income evolution with solid revenue and earnings growth, a slightly favorable global ratios evaluation, and a slightly unfavorable MOAT status due to value destruction despite increasing profitability. Its debt levels are low, and it holds a very favorable B+ rating.
The Trade Desk, Inc. (TTD) also exhibits strong income growth and a favorable global ratios evaluation, with a slightly unfavorable MOAT reflecting declining profitability and value destruction. Debt is low, liquidity strong, and ratings are very favorable at B, but P/E and P/B ratios are notably high.
Investors seeking growth potential might find both stocks appealing given their strong income growth and favorable ratings, though Salesforce’s improving profitability contrasts with The Trade Desk’s declining ROIC. Risk-averse investors could perceive Salesforce’s stable debt profile and improving returns as more reassuring, while risk-tolerant profiles focused on growth may be drawn to The Trade Desk’s higher growth rates despite its valuation concerns.
Disclaimer: Investment carries a risk of loss of initial capital. The past performance is not a reliable indicator of future results. Be sure to understand risks before making an investment decision.
Go Further
I encourage you to read the complete analyses of Salesforce, Inc. and The Trade Desk, Inc. to enhance your investment decisions: