Salesforce, Inc. (CRM) and ServiceTitan, Inc. (TTAN) are two prominent players in the software application industry, each shaping how businesses manage customer relationships and field services. While Salesforce dominates with a broad, innovative CRM platform, ServiceTitan focuses on specialized solutions for field service management. This comparison explores their market strategies and growth potential to help you decide which company deserves a place in your investment portfolio.
Table of contents
Companies Overview
I will begin the comparison between Salesforce and ServiceTitan by providing an overview of these two companies and their main differences.
Salesforce Overview
Salesforce, Inc. focuses on customer relationship management technology that connects companies with their customers globally. Its Customer 360 platform offers tools for sales, service, marketing, commerce, analytics, and integration across multiple industries. Headquartered in San Francisco, Salesforce employs over 76K people and has established itself as a leader in enterprise software solutions since its founding in 1999.
ServiceTitan Overview
ServiceTitan, Inc. provides software solutions for managing field service operations essential to residential and commercial infrastructure maintenance. Founded in 2008 and based in Glendale, CA, the company serves contractors and service businesses with tools to optimize their service activities. ServiceTitan has a workforce of about 3K employees and is a newer market player with its IPO in late 2024.
Key similarities and differences
Both companies operate in the software application industry within the technology sector and are US-based. Salesforce targets a broad range of enterprise customers with a comprehensive CRM platform, while ServiceTitan focuses specifically on field service management software for contractor businesses. Salesforce is significantly larger in market cap and employee count, reflecting its broader market reach and mature business model compared to ServiceTitan’s more specialized and emerging position.
Income Statement Comparison
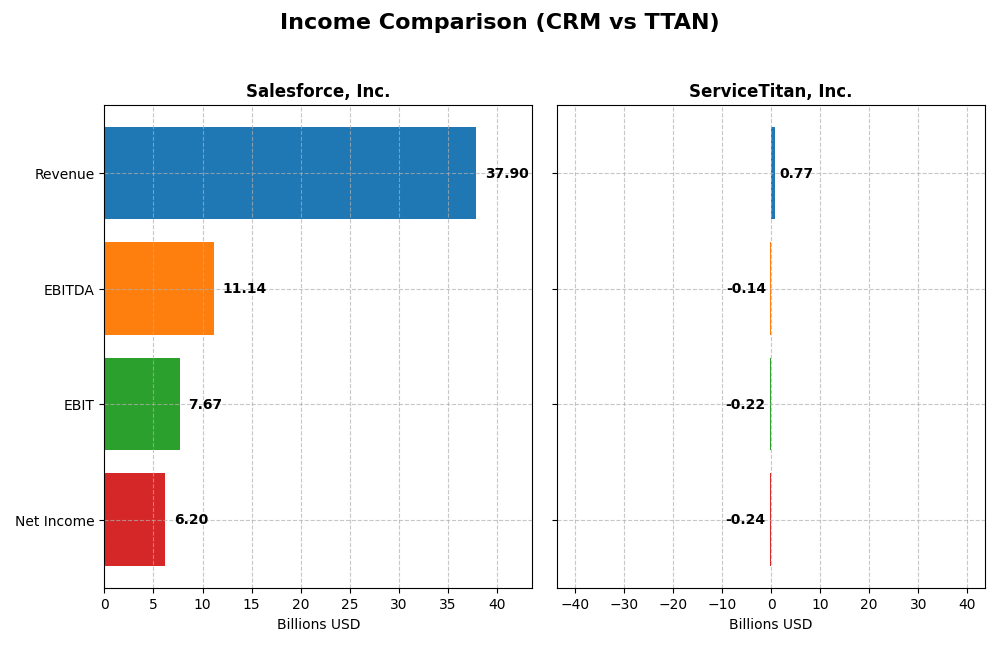
The table below compares key income statement metrics for Salesforce, Inc. and ServiceTitan, Inc. for the most recent fiscal year, providing a clear view of their financial performance.
| Metric | Salesforce, Inc. (CRM) | ServiceTitan, Inc. (TTAN) |
|---|---|---|
| Market Cap | 219B | 8.6B |
| Revenue | 37.9B | 772M |
| EBITDA | 11.1B | -141M |
| EBIT | 7.7B | -221M |
| Net Income | 6.2B | -239M |
| EPS | 6.44 | -8.53 |
| Fiscal Year | 2025 | 2025 |
Income Statement Interpretations
Salesforce, Inc.
Salesforce’s revenue and net income both showed strong growth from 2021 to 2025, with revenue rising from $21.3B to $37.9B and net income increasing from $4.1B to $6.2B. Margins remain robust, with a gross margin at 77.2% and net margin improving notably in 2025. The latest year saw a favorable 8.7% revenue growth and a 37.8% net margin increase, reflecting improved profitability.
ServiceTitan, Inc.
ServiceTitan’s revenue expanded significantly from $468M in 2023 to $772M in 2025, with net losses narrowing but still substantial at -$239M in 2025. Gross margin at 64.9% is favorable, yet EBIT and net margins remain negative, indicating ongoing operational losses. The most recent year showed strong revenue growth of 25.6% but a decline in EBIT by 26.7%, highlighting margin pressure despite top-line gains.
Which one has the stronger fundamentals?
Salesforce exhibits stronger fundamentals with consistent revenue and net income growth, high and improving margins, and a predominantly favorable income statement evaluation. In contrast, ServiceTitan, although growing revenue rapidly, continues to report negative profitability metrics and unfavorable EBIT and net margins. Salesforce’s financial metrics suggest a more stable and profitable business model over the analyzed period.
Financial Ratios Comparison
The following table compares key financial ratios for Salesforce, Inc. (CRM) and ServiceTitan, Inc. (TTAN) based on their most recent fiscal year data from 2025.
| Ratios | Salesforce, Inc. (CRM) | ServiceTitan, Inc. (TTAN) |
|---|---|---|
| ROE | 10.13% | -16.44% |
| ROIC | 7.95% | -14.11% |
| P/E | 53.04 | -18.12 |
| P/B | 5.37 | 2.98 |
| Current Ratio | 1.06 | 3.74 |
| Quick Ratio | 1.06 | 3.74 |
| D/E (Debt-to-Equity) | 0.19 | 0.11 |
| Debt-to-Assets | 11.07% | 9.35% |
| Interest Coverage | 26.49 | -14.82 |
| Asset Turnover | 0.37 | 0.44 |
| Fixed Asset Turnover | 7.03 | 9.57 |
| Payout ratio | 24.80% | 0 |
| Dividend yield | 0.47% | 0 |
Interpretation of the Ratios
Salesforce, Inc.
Salesforce displays a slightly favorable ratio profile, with strong leverage and coverage ratios such as debt-to-equity at 0.19 and interest coverage at 28.18, indicating solid financial stability. However, valuation metrics like P/E at 53.04 and P/B at 5.37 are unfavorable, suggesting the stock may be expensive. The company pays dividends with a low yield of 0.47%, reflecting a cautious payout approach supported by free cash flow.
ServiceTitan, Inc.
ServiceTitan shows a slightly unfavorable ratio profile, with negative profitability ratios including a net margin of -30.98% and return on equity of -16.44%, signaling operational challenges. Liquidity is strong with a high quick ratio of 3.74, but interest coverage is negative at -14.26, indicating financial strain. The company does not pay dividends, likely due to losses and its focus on reinvestment and growth.
Which one has the best ratios?
Salesforce’s ratios are generally stronger, balancing financial leverage with profitability despite some valuation concerns. ServiceTitan’s negative margins and returns, coupled with interest burden issues, weigh on its ratio quality. Therefore, Salesforce presents a more favorable financial ratio profile compared to ServiceTitan based on the available data.
Strategic Positioning
This section compares the strategic positioning of Salesforce, Inc. and ServiceTitan, Inc. focusing on Market position, Key segments, and Exposure to technological disruption:
Salesforce, Inc.
- Leading global CRM provider with strong market cap of 219B and NYSE listing
- Diverse software segments: Sales, Service, Marketing, Commerce, Integration, Analytics, Platform, and Professional Services
- Exposed to rapid tech advances in CRM, analytics, and cloud platforms
ServiceTitan, Inc.
- Smaller market cap of 8.5B, focused on field service software, listed on NASDAQ
- Concentrated on platform and subscription revenue for field service management
- Faces disruption risks in field service tech but with limited segment exposure
Salesforce, Inc. vs ServiceTitan, Inc. Positioning
Salesforce operates a diversified SaaS portfolio with multiple revenue streams across industries, providing scale advantages. ServiceTitan focuses on a niche market in field service software, offering potentially greater specialization but less diversification.
Which has the best competitive advantage?
Both firms are shedding value versus their cost of capital; Salesforce shows improving ROIC trends, indicating growing profitability, while ServiceTitan’s profitability remains stable but unfavorable, suggesting Salesforce holds a slightly stronger competitive moat.
Stock Comparison
The stock price dynamics over the past 12 months reveal notable bearish trends for both Salesforce, Inc. (CRM) and ServiceTitan, Inc. (TTAN), with accelerating declines and distinct price fluctuations.
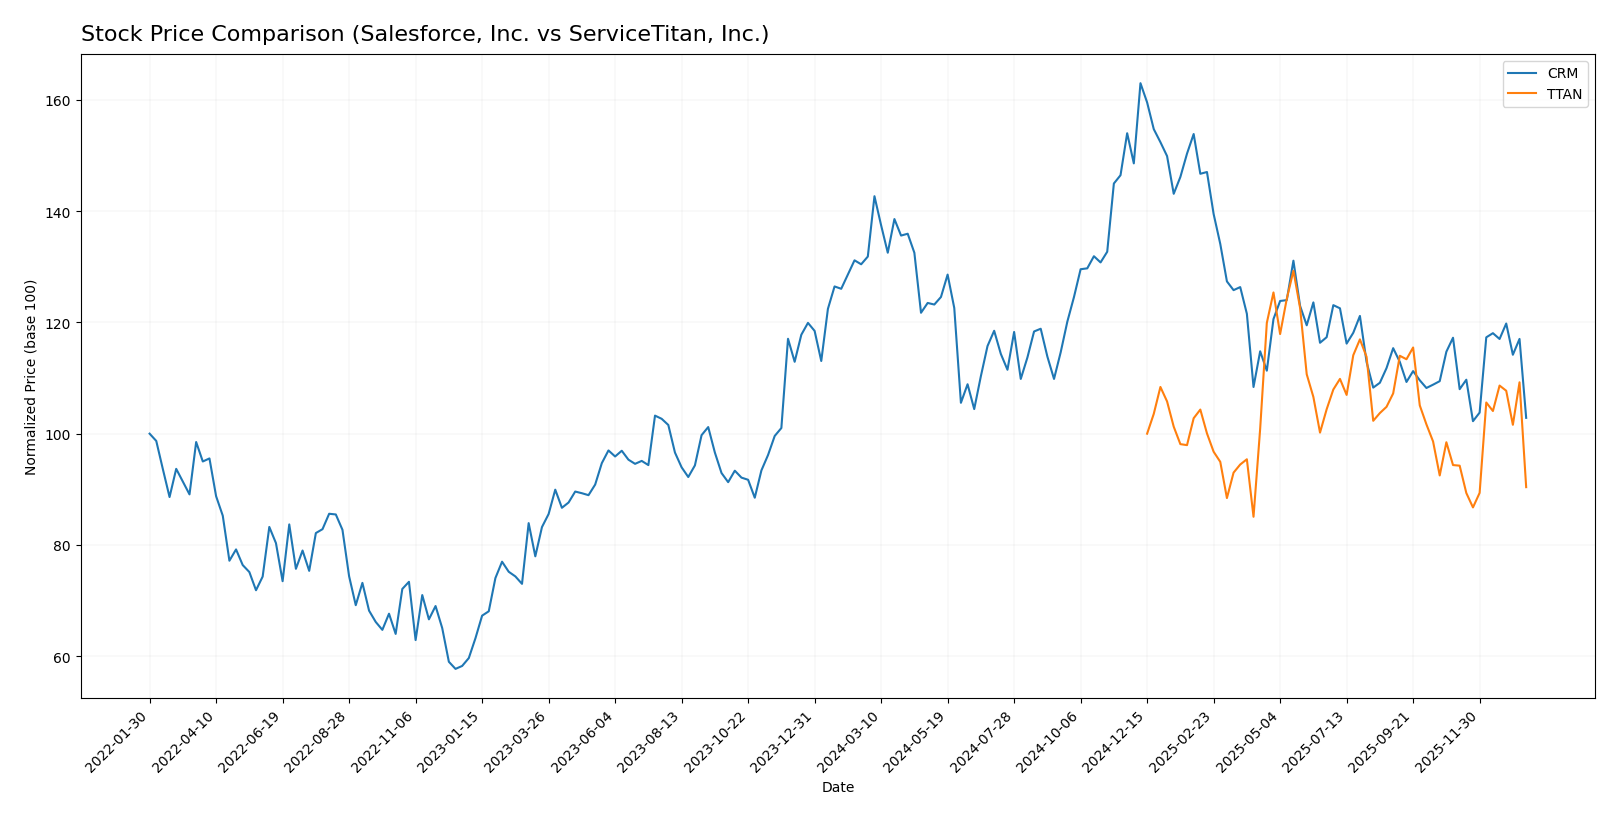
Trend Analysis
Salesforce, Inc. (CRM) experienced a bearish trend with a price decrease of 21.98% over the past year, marked by accelerating losses and a high volatility level with a standard deviation of 31.8. The stock reached a peak of 361.99 and a low of 227.11 during this period.
ServiceTitan, Inc. (TTAN) also showed a bearish trend, declining by 9.61% over the same timeframe, with accelerating downward momentum and lower volatility at a standard deviation of 9.87. The price ranged between 129.26 and 85.07.
Comparing the two, Salesforce’s stock delivered the highest market performance in terms of volatility and price range but suffered a steeper decline than ServiceTitan, which showed a less pronounced bearish movement.
Target Prices
Analysts provide a clear target price range reflecting moderate upside potential for both Salesforce, Inc. and ServiceTitan, Inc.
| Company | Target High | Target Low | Consensus |
|---|---|---|---|
| Salesforce, Inc. | 400 | 250 | 324.17 |
| ServiceTitan, Inc. | 145 | 117 | 133.2 |
Salesforce’s consensus target of 324.17 suggests a significant upside from the current 229 USD price. ServiceTitan’s target consensus at 133.2 also indicates notable growth potential above its current 91.31 USD price.
Analyst Opinions Comparison
This section compares analysts’ ratings and grades for Salesforce, Inc. and ServiceTitan, Inc.:
Rating Comparison
Salesforce, Inc. Rating
- Rating: B+, indicating a very favorable overall evaluation.
- Discounted Cash Flow Score: 4, a favorable valuation metric.
- ROE Score: 4, showing strong efficiency in generating profit from equity.
- ROA Score: 4, demonstrating effective asset utilization.
- Debt To Equity Score: 3, a moderate level of financial risk.
- Overall Score: 3, a moderate overall financial standing.
ServiceTitan, Inc. Rating
- Rating: C-, reflecting a very unfavorable overall rating.
- Discounted Cash Flow Score: 1, indicating very unfavorable valuation.
- ROE Score: 1, reflecting very unfavorable profit generation efficiency.
- ROA Score: 1, indicating weak asset utilization.
- Debt To Equity Score: 3, also indicating moderate financial risk.
- Overall Score: 1, signifying very unfavorable financial health.
Which one is the best rated?
Salesforce, Inc. is clearly better rated with a B+ rating and favorable scores in cash flow, ROE, and ROA. ServiceTitan, Inc. has a C- rating with predominantly very unfavorable scores except for a moderate debt-to-equity score.
Scores Comparison
Here is the comparison of the Altman Z-Score and Piotroski Score for Salesforce, Inc. and ServiceTitan, Inc.:
Salesforce, Inc. Scores
- Altman Z-Score: 5.26, indicating a safe financial zone with low bankruptcy risk.
- Piotroski Score: 7, representing strong financial health and investment potential.
ServiceTitan, Inc. Scores
- Altman Z-Score: 15.74, indicating a safe financial zone with very low bankruptcy risk.
- Piotroski Score: 6, reflecting average financial strength and investment potential.
Which company has the best scores?
ServiceTitan shows a significantly higher Altman Z-Score, indicating stronger financial safety. Salesforce has a higher Piotroski Score, suggesting better overall financial strength. Each excels in different scoring metrics based on provided data.
Grades Comparison
The grades for Salesforce, Inc. and ServiceTitan, Inc. from various reputable grading companies are as follows:
Salesforce, Inc. Grades
This table shows recent grades and rating actions from reputable grading companies for Salesforce, Inc.:
| Grading Company | Action | New Grade | Date |
|---|---|---|---|
| Barclays | maintain | Overweight | 2026-01-12 |
| RBC Capital | maintain | Sector Perform | 2026-01-05 |
| Morgan Stanley | maintain | Overweight | 2025-12-09 |
| Citigroup | maintain | Neutral | 2025-12-08 |
| DA Davidson | maintain | Neutral | 2025-12-05 |
| Citizens | maintain | Market Outperform | 2025-12-04 |
| Deutsche Bank | maintain | Buy | 2025-12-04 |
| Wedbush | maintain | Outperform | 2025-12-04 |
| Northland Capital Markets | maintain | Market Perform | 2025-12-04 |
| Canaccord Genuity | maintain | Buy | 2025-12-04 |
Salesforce shows a consistent pattern of buy and outperform ratings, with no recent downgrades.
ServiceTitan, Inc. Grades
The following table presents the latest grades and rating actions from reliable grading companies for ServiceTitan, Inc.:
| Grading Company | Action | New Grade | Date |
|---|---|---|---|
| Piper Sandler | maintain | Overweight | 2025-12-05 |
| BMO Capital | maintain | Outperform | 2025-12-05 |
| TD Cowen | maintain | Buy | 2025-12-05 |
| Morgan Stanley | maintain | Equal Weight | 2025-12-05 |
| BMO Capital | maintain | Outperform | 2025-11-20 |
| Wells Fargo | maintain | Overweight | 2025-09-19 |
| Stifel | maintain | Buy | 2025-09-19 |
| Piper Sandler | maintain | Overweight | 2025-09-19 |
| Canaccord Genuity | maintain | Buy | 2025-09-19 |
| Citigroup | maintain | Neutral | 2025-09-09 |
ServiceTitan’s grades also lean positive, mostly buy and outperform with some neutral and equal weight ratings.
Which company has the best grades?
Both Salesforce, Inc. and ServiceTitan, Inc. hold predominantly positive grades with buy and outperform consensus. Salesforce has a larger number of buy ratings, while ServiceTitan shows a mix including some equal weight ratings. This suggests slightly stronger analyst confidence in Salesforce, potentially influencing investors seeking more broadly supported growth prospects.
Strengths and Weaknesses
Below is a comparison of key strengths and weaknesses for Salesforce, Inc. (CRM) and ServiceTitan, Inc. (TTAN) based on the most recent financial and operational data.
| Criterion | Salesforce, Inc. (CRM) | ServiceTitan, Inc. (TTAN) |
|---|---|---|
| Diversification | Highly diversified product lines with six main segments generating billions in revenue, including Sales Cloud ($8.3B) and Service Cloud ($9.1B) | Primarily focused on platform and subscription revenue, less diversified with $739M and $566M respectively |
| Profitability | Positive net margin (16.35%) and growing ROIC, though ROIC is slightly below WACC, indicating slight value destruction | Negative net margin (-30.98%) and ROIC (-14.11%), indicating ongoing losses and value destruction |
| Innovation | Strong innovation evidenced by growing ROIC trend (762%), significant investment in integration and analytics | Neutral ROIC trend (1.7%), innovation impact less visible; stable but unfavorable profitability |
| Global presence | Extensive global footprint with broad product adoption across multiple industries | More regionally focused with less global scale compared to CRM |
| Market Share | Large market share in CRM software space, supported by strong brand and diverse product portfolio | Smaller market share focused on niche market for service management software |
In summary, Salesforce demonstrates strong diversification and innovation with improving profitability despite slight value destruction. ServiceTitan struggles with profitability and value creation but maintains a solid platform position. Investors should weigh CRM’s solid fundamentals and growth potential against TTAN’s higher risk and narrower focus.
Risk Analysis
Below is a comparative table summarizing key risks for Salesforce, Inc. (CRM) and ServiceTitan, Inc. (TTAN) based on the most recent fiscal year 2025 data:
| Metric | Salesforce, Inc. (CRM) | ServiceTitan, Inc. (TTAN) |
|---|---|---|
| Market Risk | Moderate (Beta 1.27) | Low (Beta -0.85) |
| Debt Level | Low (Debt/Equity 0.19) | Low (Debt/Equity 0.11) |
| Regulatory Risk | Moderate | Moderate |
| Operational Risk | Moderate | High (early-stage growth) |
| Environmental Risk | Low | Low |
| Geopolitical Risk | Moderate (US-based) | Moderate (US-based) |
Salesforce’s market risk is elevated due to its higher beta, indicating sensitivity to market fluctuations, while ServiceTitan’s negative beta suggests a defensive profile but operational risks are higher due to its early growth phase and less stable profitability. Both have manageable debt levels and face typical regulatory and geopolitical risks for US tech firms.
Which Stock to Choose?
Salesforce, Inc. (CRM) shows a favorable income evolution with strong revenue and profit growth, supported by a solid net margin of 16.35%. Its financial ratios are slightly favorable, reflecting good debt management and profitability, despite some valuation concerns. The company carries modest debt and holds a very favorable B+ rating.
ServiceTitan, Inc. (TTAN) presents a mixed financial picture with favorable revenue growth but persistent negative profitability and margins. Its financial ratios are slightly unfavorable, highlighting challenges in profitability and interest coverage, though debt levels remain low. The company is rated C- with an overall very unfavorable outlook.
For investors, Salesforce may appear more attractive for those valuing stable profitability and a favorable rating, while ServiceTitan might be considered by those with higher risk tolerance seeking growth potential despite current losses. The choice could depend on whether an investor prioritizes consistent value creation or growth at a higher risk.
Disclaimer: Investment carries a risk of loss of initial capital. The past performance is not a reliable indicator of future results. Be sure to understand risks before making an investment decision.
Go Further
I encourage you to read the complete analyses of Salesforce, Inc. and ServiceTitan, Inc. to enhance your investment decisions: