Home > Comparison > Technology > CRM vs NOW
The strategic rivalry between Salesforce, Inc. and ServiceNow, Inc. shapes the trajectory of the enterprise software sector. Salesforce operates as a capital-intensive platform powerhouse offering comprehensive customer relationship management solutions. In contrast, ServiceNow focuses on high-margin, workflow automation software that streamlines IT and business operations. This analysis pits Salesforce’s expansive ecosystem against ServiceNow’s specialized innovation to identify the superior risk-adjusted investment opportunity for a diversified portfolio.
Table of contents
Companies Overview
Salesforce and ServiceNow dominate enterprise software with distinct strengths in customer engagement and workflow automation.
Salesforce, Inc.: Pioneer in Customer Relationship Management
Salesforce leads as a customer relationship management (CRM) powerhouse. It generates revenue through its Customer 360 platform, integrating sales, service, marketing, commerce, and analytics. In 2026, Salesforce focuses on unifying customer experiences and expanding its Slack collaboration ecosystem, reinforcing its competitive edge in delivering connected, scalable enterprise solutions.
ServiceNow, Inc.: Workflow Automation Specialist
ServiceNow specializes in enterprise cloud computing and workflow automation. Its Now Platform drives revenue by automating IT, HR, security, and customer service processes across industries. The company’s 2026 strategy emphasizes AI-driven automation and strategic partnerships like Celonis to optimize business operations and expand its footprint in digital transformation services.
Strategic Collision: Similarities & Divergences
Both firms thrive in enterprise software but pursue different philosophies. Salesforce prioritizes an integrated customer engagement ecosystem, while ServiceNow emphasizes workflow automation across IT and business functions. They compete primarily in the digital transformation arena, targeting overlapping enterprise clients. Their distinct focuses create divergent investment profiles: Salesforce bets on broad customer-centric platforms, ServiceNow on operational efficiency and automation.
Income Statement Comparison
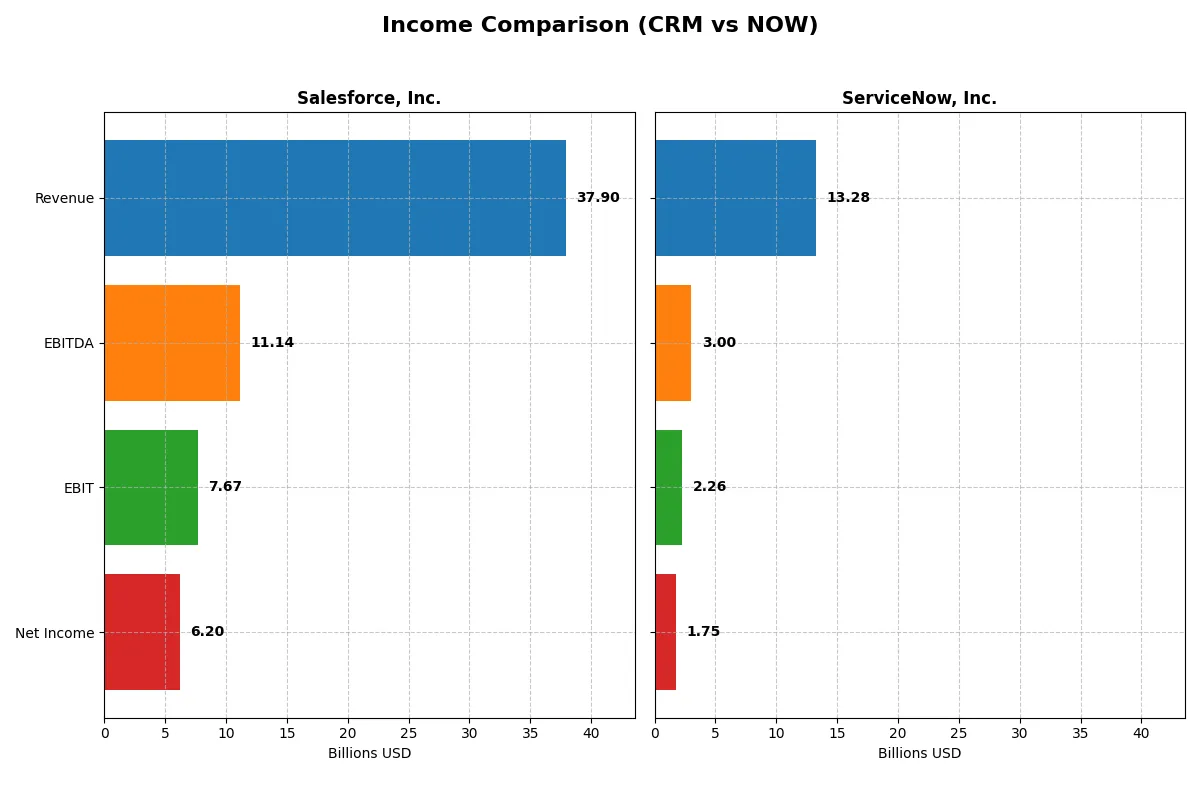
The following data dissects the core profitability and scalability of both corporate engines to reveal who dominates the bottom line:
| Metric | Salesforce, Inc. (CRM) | ServiceNow, Inc. (NOW) |
|---|---|---|
| Revenue | 37.9B | 13.3B |
| Cost of Revenue | 8.64B | 2.98B |
| Operating Expenses | 22.0B | 8.47B |
| Gross Profit | 29.3B | 10.3B |
| EBITDA | 11.1B | 3.00B |
| EBIT | 7.67B | 2.26B |
| Interest Expense | 272M | 0 |
| Net Income | 6.20B | 1.75B |
| EPS | 6.44 | 1.69 |
| Fiscal Year | 2025 | 2025 |
Income Statement Analysis: The Bottom-Line Duel
This income statement comparison reveals which company operates its financial engine with greater efficiency and momentum in recent years.
Salesforce, Inc. Analysis
Salesforce grew revenue from $21.3B in 2021 to $37.9B in 2025, with net income rising from $4.07B to $6.20B. The gross margin remains strong at 77.2%, while net margin expanded to 16.4%. In 2025, Salesforce’s EBIT surged 28%, signaling improved operational leverage and robust profitability momentum.
ServiceNow, Inc. Analysis
ServiceNow’s revenue jumped from $5.9B in 2021 to $13.3B in 2025, with net income climbing impressively from $230M to $1.75B. The company maintains a healthy gross margin of 77.5% and a solid net margin of 13.2%. The 2025 year saw a 20.9% revenue increase and a 28.4% EBIT rise, reflecting strong growth and operational efficiency.
Margin Expansion vs. Explosive Growth
Salesforce leads in absolute scale, delivering higher net income and superior net margins. ServiceNow, however, outpaces Salesforce in revenue and net income growth rates over five years, showcasing remarkable expansion from a smaller base. Investors favoring established margin strength may prefer Salesforce, while growth-oriented investors might find ServiceNow’s rapid scaling more attractive.
Financial Ratios Comparison
These vital ratios act as a diagnostic tool to expose the underlying fiscal health, valuation premiums, and capital efficiency of the companies analyzed below:
| Ratios | Salesforce, Inc. (CRM) | ServiceNow, Inc. (NOW) |
|---|---|---|
| ROE | 10.1% | 13.5% |
| ROIC | 7.9% | 9.0% |
| P/E | 53.0 | 90.9 |
| P/B | 5.37 | 12.25 |
| Current Ratio | 1.06 | 0.95 |
| Quick Ratio | 1.06 | 0.95 |
| D/E (Debt-to-Equity) | 0.19 | 0.25 |
| Debt-to-Assets | 11.1% | 12.3% |
| Interest Coverage | 26.5 | 0 |
| Asset Turnover | 0.37 | 0.51 |
| Fixed Asset Turnover | 7.03 | 4.29 |
| Payout Ratio | 24.8% | 0% |
| Dividend Yield | 0.47% | 0% |
| Fiscal Year | 2025 | 2025 |
Efficiency & Valuation Duel: The Vital Signs
Financial ratios act as a company’s DNA, revealing hidden risks and operational excellence behind the surface.
Salesforce, Inc.
Salesforce shows moderate profitability with a 10.13% ROE and strong 16.35% net margin, signaling operational efficiency. However, its P/E of 53.04 and P/B of 5.37 mark it as expensive relative to peers. The company returns value via modest dividends (0.47%), balancing shareholder returns with solid reinvestment in R&D (14.5% of revenue).
ServiceNow, Inc.
ServiceNow achieves higher profitability with a 13.48% ROE and a 13.16% net margin, demonstrating robust operational performance. The stock stretches valuation metrics, with a P/E of 90.88 and P/B of 12.25, reflecting growth expectations. It pays no dividends, choosing instead to reinvest heavily in R&D (22.3% of revenue) to fuel future expansion.
Premium Valuation vs. Operational Safety
Both companies present slightly favorable ratio profiles, but Salesforce offers a better risk-reward balance with lower valuation multiples and steady shareholder returns. ServiceNow suits investors targeting growth through aggressive reinvestment despite its stretched valuation.
Which one offers the Superior Shareholder Reward?
I see Salesforce (CRM) pays a modest 0.47% dividend yield with a 25% payout ratio, well covered by free cash flow of 12.9/share. Its buyback activity is implied by a strong cash position and low debt, supporting total returns. ServiceNow (NOW) pays no dividends, reinvesting heavily in growth and acquisitions, evident from capex near 0.8/share and zero payout. Both maintain robust buybacks, but CRM’s dividend plus buybacks offer tangible shareholder rewards. Historically, sustainable dividends combined with buybacks signal disciplined capital allocation. I conclude Salesforce provides a superior total return profile in 2026, balancing income and growth more prudently than ServiceNow’s aggressive reinvestment strategy.
Comparative Score Analysis: The Strategic Profile
The radar chart reveals the fundamental DNA and trade-offs of Salesforce, Inc. and ServiceNow, Inc., highlighting their financial strengths and valuation nuances:
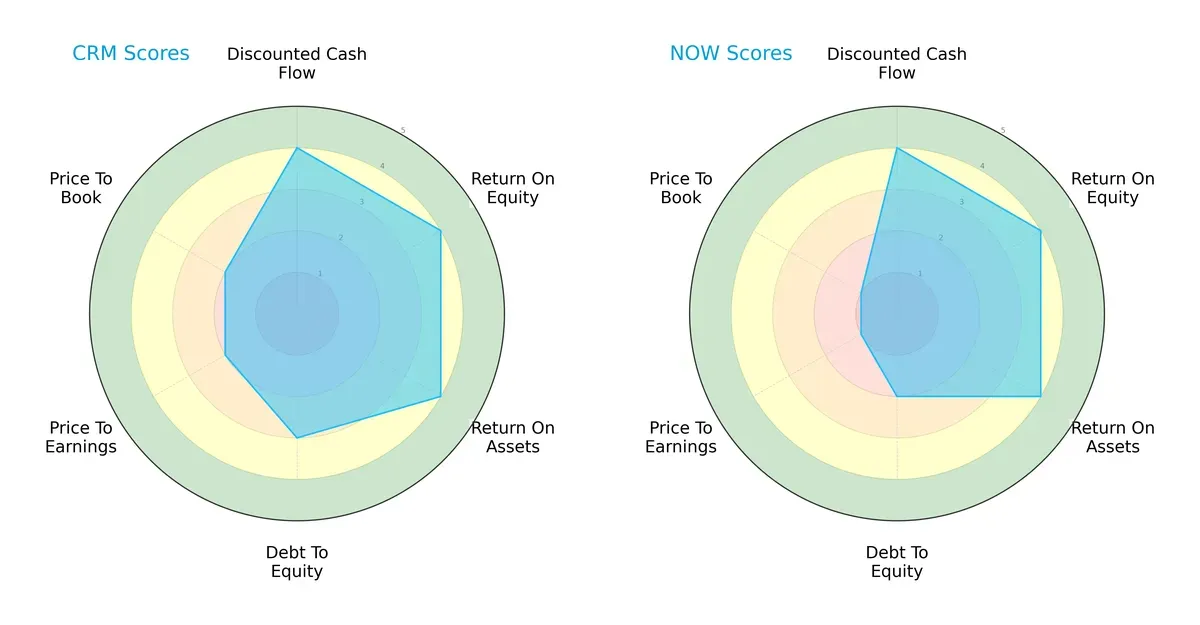
Salesforce and ServiceNow both boast strong DCF, ROE, and ROA scores at 4, reflecting robust profitability and asset efficiency. Salesforce edges ahead with a moderate debt-to-equity score of 3 versus ServiceNow’s weaker 2, indicating Salesforce manages leverage more prudently. However, Salesforce’s valuation metrics (P/E and P/B at 2) are more balanced compared to ServiceNow’s very unfavorable 1 scores, suggesting Salesforce offers a more attractive price relative to earnings and book value. Overall, Salesforce presents a more balanced profile, while ServiceNow relies heavily on operational efficiency but faces valuation risks.
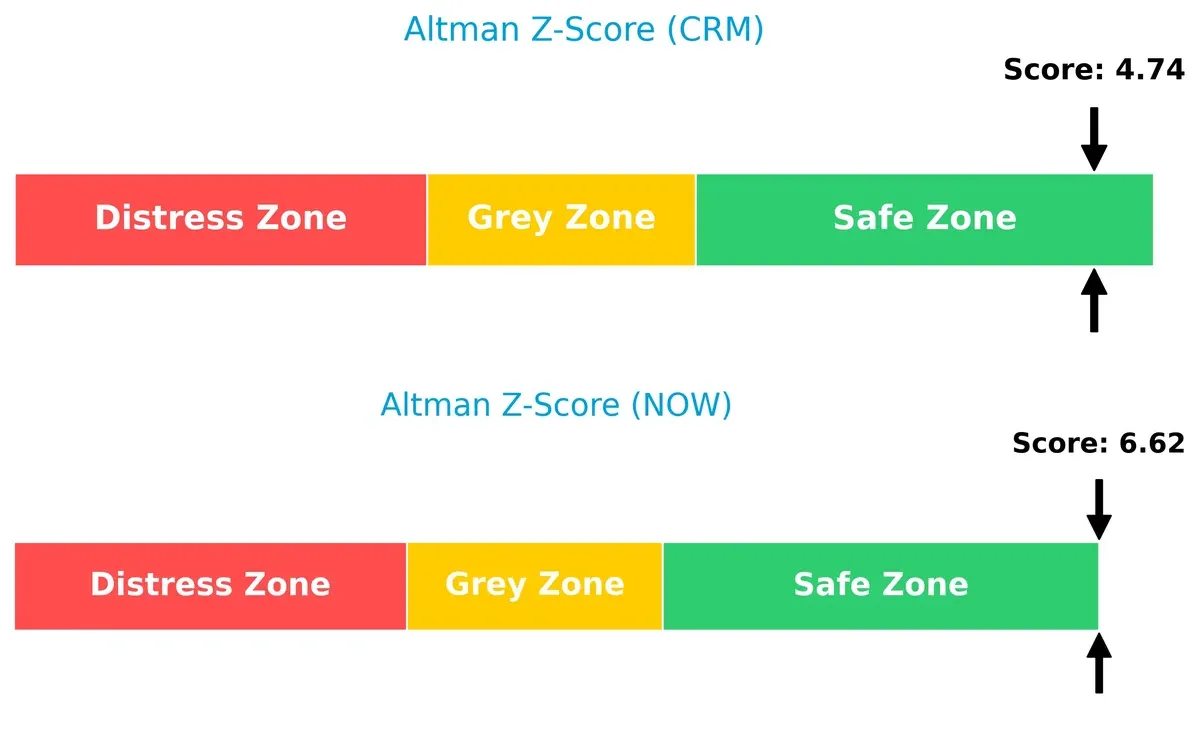
Bankruptcy Risk: Solvency Showdown
Salesforce’s Altman Z-Score stands at 4.74, while ServiceNow’s is significantly higher at 6.62, both safely above the distress threshold. This gap implies ServiceNow enjoys a stronger solvency position, reducing bankruptcy risk in this economic cycle:
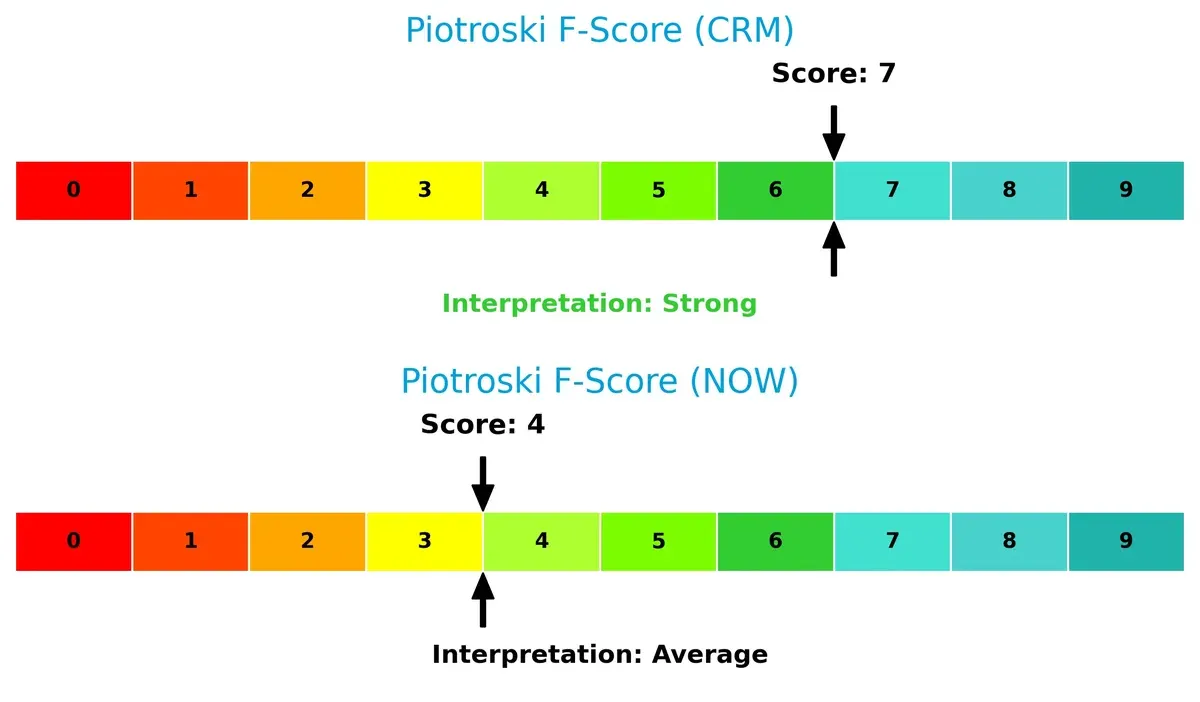
Financial Health: Quality of Operations
Salesforce scores a robust 7 on the Piotroski F-Score, indicating strong financial health and operational quality. ServiceNow’s 4 suggests average financial strength with potential internal red flags compared to Salesforce’s superior metrics:
How are the two companies positioned?
This section dissects Salesforce and ServiceNow’s operational DNA by comparing revenue distribution and internal strengths and weaknesses. The goal is to confront their economic moats and identify which model delivers the most resilient competitive advantage today.
Revenue Segmentation: The Strategic Mix
This visual comparison dissects how Salesforce, Inc. and ServiceNow, Inc. diversify their income streams and where their primary sector bets lie:
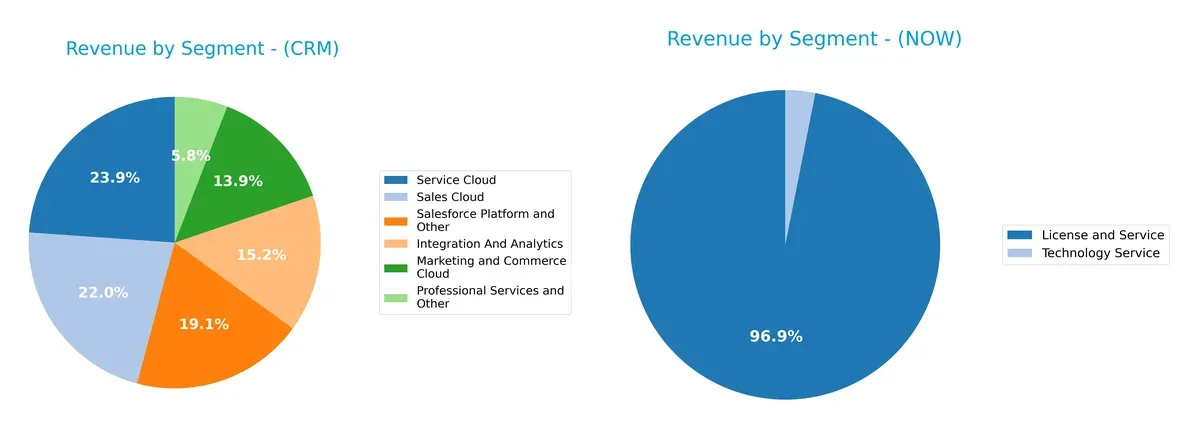
Salesforce presents a well-balanced portfolio with Service Cloud leading at $9.05B, closely followed by Sales Cloud at $8.32B and Platform at $7.25B. Its diversification reduces concentration risk and supports ecosystem lock-in. In contrast, ServiceNow relies heavily on License and Service ($12.88B), anchoring its revenue with digital workflow dominance but exposing it to sector concentration risks. Salesforce’s broader mix signals a more resilient growth strategy.
Strengths and Weaknesses Comparison
This table compares the strengths and weaknesses of Salesforce, Inc. and ServiceNow, Inc.:
Salesforce Strengths
- Diversified product segments with strong revenues across Sales, Service, and Platform clouds
- Favorable net margin at 16.35%
- Strong global presence with $25.1B Americas revenue
- Favorable interest coverage at 28.18
- Low debt-to-assets at 11.07%
ServiceNow Strengths
- Solid net margin at 13.16%
- Favorable interest coverage, effectively infinite
- Growing revenues in Digital Workflow and ITOM products
- Balanced geographic footprint with $8.3B North America revenue
- Favorable debt-to-assets at 12.3%
Salesforce Weaknesses
- High P/E ratio at 53.04 and P/B at 5.37, indicating overvaluation risk
- Asset turnover low at 0.37, suggesting asset utilization inefficiency
- Neutral ROIC below WACC at 7.95% vs. 9.41%
- Current ratio barely above 1.0, indicating limited liquidity cushion
ServiceNow Weaknesses
- Very high P/E ratio at 90.88 and P/B at 12.25, signaling potential overvaluation
- Current ratio below 1.0, a liquidity red flag
- Dividend yield at zero
- Asset turnover neutral at 0.51
Both companies show favorable profitability and manageable debt but face valuation concerns. Salesforce’s diversified segments support resilience, while ServiceNow’s liquidity and valuation metrics warrant attention in strategy considerations.
The Moat Duel: Analyzing Competitive Defensibility
A structural moat is the only barrier protecting long-term profits from relentless competitive erosion. Let’s examine how these two giants defend their turf:
Salesforce, Inc.: Intangible Assets and Ecosystem Integration
Salesforce’s moat stems from deep intangible assets and an integrated platform ecosystem. It maintains high gross margins (~77%) and steady EBIT margins (~20%). New AI and Slack enhancements could deepen its moat in 2026.
ServiceNow, Inc.: Workflow Automation and Customer Lock-in
ServiceNow’s competitive edge lies in workflow automation and high customer retention. It posts comparable gross margins (~77.5%) but slightly lower EBIT margins (~17%). Expanding AI-driven automation offers growth and moat reinforcement opportunities.
Integration Ecosystem vs. Automation Dominance
Salesforce’s ecosystem integration creates a wider moat, leveraging cross-product synergies and brand strength. ServiceNow shows a narrower but growing moat focused on automation efficiency. Salesforce remains better equipped to defend its market share long term.
Which stock offers better returns?
The past year saw both Salesforce, Inc. and ServiceNow, Inc. experience notable price declines with distinct deceleration patterns in their downtrends.
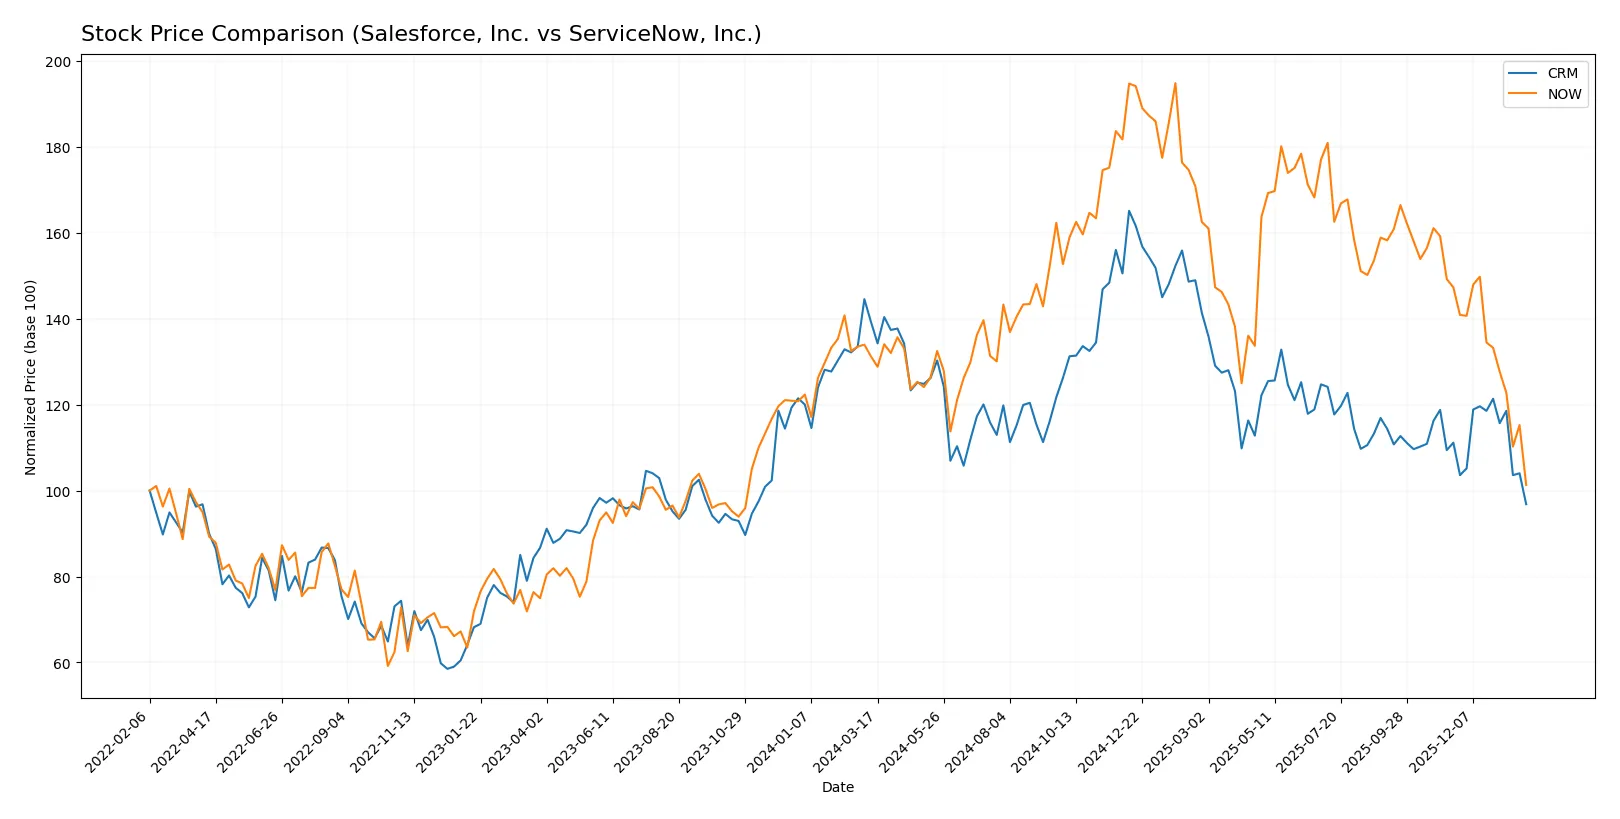
Trend Comparison
Salesforce, Inc. (CRM) shows a bearish trend with a -30.46% price change over 12 months, decelerating after hitting a high of 361.99 and a low of 212.29. Its recent three-month trend also remains negative at -12.87%.
ServiceNow, Inc. (NOW) also follows a bearish trend with a -22.79% price drop over the year, decelerating from a 225.0 peak to 117.01 low. Recent months show sharper decline at -31.21%.
Between the two, Salesforce’s stock delivered a larger overall loss (-30.46%) compared to ServiceNow (-22.79%), indicating ServiceNow outperformed Salesforce in market returns.
Target Prices
Analysts show a wide range of target prices for both Salesforce, Inc. and ServiceNow, Inc., indicating diverse expectations.
| Company | Target Low | Target High | Consensus |
|---|---|---|---|
| Salesforce, Inc. | 250 | 400 | 324.17 |
| ServiceNow, Inc. | 115 | 1315 | 440.14 |
Salesforce’s consensus target exceeds its current price of 212, suggesting upside potential. ServiceNow’s consensus target also surpasses its current 117 price, but the wide target range signals uncertainty among analysts.

Don’t Let Luck Decide Your Entry Point
Optimize your entry points with our advanced ProRealTime indicators. You’ll get efficient buy signals with precise price targets for maximum performance. Start outperforming now!
How do institutions grade them?
Here is a summary of the latest institutional grades for Salesforce, Inc. and ServiceNow, Inc.:
Salesforce, Inc. Grades
This table shows recent grades from major financial institutions for Salesforce:
| Grading Company | Action | New Grade | Date |
|---|---|---|---|
| Barclays | Maintain | Overweight | 2026-01-12 |
| RBC Capital | Maintain | Sector Perform | 2026-01-05 |
| Morgan Stanley | Maintain | Overweight | 2025-12-09 |
| Citigroup | Maintain | Neutral | 2025-12-08 |
| DA Davidson | Maintain | Neutral | 2025-12-05 |
| Canaccord Genuity | Maintain | Buy | 2025-12-04 |
| Truist Securities | Maintain | Buy | 2025-12-04 |
| Deutsche Bank | Maintain | Buy | 2025-12-04 |
| Baird | Maintain | Outperform | 2025-12-04 |
| Wedbush | Maintain | Outperform | 2025-12-04 |
ServiceNow, Inc. Grades
This table summarizes recent grades from leading institutions for ServiceNow:
| Grading Company | Action | New Grade | Date |
|---|---|---|---|
| Citigroup | Maintain | Buy | 2026-01-30 |
| BTIG | Maintain | Buy | 2026-01-29 |
| Stifel | Maintain | Buy | 2026-01-29 |
| RBC Capital | Maintain | Outperform | 2026-01-29 |
| Macquarie | Maintain | Neutral | 2026-01-29 |
| DA Davidson | Maintain | Buy | 2026-01-29 |
| Needham | Maintain | Buy | 2026-01-29 |
| Keybanc | Maintain | Underweight | 2026-01-29 |
| Evercore ISI Group | Maintain | Outperform | 2026-01-29 |
| Cantor Fitzgerald | Maintain | Overweight | 2026-01-29 |
Which company has the best grades?
Both companies receive predominantly positive grades, but Salesforce shows more “Buy” and “Outperform” calls. ServiceNow has more “Buy” ratings but includes a notable “Underweight” from Keybanc. Stronger grades can boost investor confidence but also require monitoring for divergent opinions.
Risks specific to each company
The following categories identify the critical pressure points and systemic threats facing both firms in the 2026 market environment:
1. Market & Competition
Salesforce, Inc.
- Faces intense competition from diversified CRM and cloud software providers, risking margin pressure.
ServiceNow, Inc.
- Competes in a crowded enterprise cloud automation market with rapid innovation cycles.
2. Capital Structure & Debt
Salesforce, Inc.
- Maintains low debt-to-equity (0.19) and strong interest coverage (28.18), supporting financial flexibility.
ServiceNow, Inc.
- Slightly higher leverage (0.25) but infinite interest coverage, indicating low debt servicing risk.
3. Stock Volatility
Salesforce, Inc.
- Beta of 1.266 indicates higher volatility than the market, increasing investment risk.
ServiceNow, Inc.
- Beta of 0.979 suggests near-market volatility, implying more stability for investors.
4. Regulatory & Legal
Salesforce, Inc.
- Subject to global data privacy regulations impacting CRM data management practices.
ServiceNow, Inc.
- Faces evolving compliance demands in IT service management and cloud security.
5. Supply Chain & Operations
Salesforce, Inc.
- Relies on cloud infrastructure partners; operational risks from service disruptions are notable.
ServiceNow, Inc.
- Dependent on third-party cloud and AI technology vendors, exposing it to integration risks.
6. ESG & Climate Transition
Salesforce, Inc.
- Strong ESG initiatives but exposed to scrutiny over data center energy usage.
ServiceNow, Inc.
- ESG policies advancing but risks remain in sustainable IT resource management.
7. Geopolitical Exposure
Salesforce, Inc.
- Global footprint exposes it to trade tensions and regulatory shifts in major markets.
ServiceNow, Inc.
- Similarly exposed globally; emerging market volatility poses additional risks.
Which company shows a better risk-adjusted profile?
Salesforce’s strongest risk is its market and competitive pressure amid high valuation multiples. ServiceNow faces significant valuation risk and weaker liquidity ratios, raising red flags. Salesforce’s superior capital structure and liquidity provide a better cushion against market volatility. Recent data show ServiceNow’s current ratio below 1, signaling tighter short-term liquidity. Overall, Salesforce displays a more balanced risk-adjusted profile for 2026 investors.
Final Verdict: Which stock to choose?
Salesforce, Inc. wields unmatched scale and a robust revenue engine, fueling consistent top-line growth. Its expanding profitability signals operational improvement. A point of vigilance remains its stretched valuation and modest returns relative to its cost of capital. It fits well within aggressive growth portfolios seeking market leadership exposure.
ServiceNow, Inc. commands a strategic moat through its cloud platform and recurring revenue model, delivering superior return on equity. It offers greater financial stability despite a higher price tag and slightly weaker liquidity metrics. This stock suits investors targeting GARP—growth at a reasonable price—with an appetite for steady cash flow growth.
If you prioritize market dominance and aggressive expansion, Salesforce outshines with its scale and improving profitability despite valuation concerns. However, if you seek better stability and recurring revenue safety, ServiceNow offers a more resilient moat and superior capital efficiency. Both stocks warrant cautious consideration given recent price weakness and sector cyclicality.
Disclaimer: Investment carries a risk of loss of initial capital. The past performance is not a reliable indicator of future results. Be sure to understand risks before making an investment decision.
Go Further
I encourage you to read the complete analyses of Salesforce, Inc. and ServiceNow, Inc. to enhance your investment decisions: