Home > Comparison > Healthcare > TMO vs RDNT
The strategic rivalry between Thermo Fisher Scientific Inc. and RadNet, Inc. shapes the healthcare diagnostics sector’s future. Thermo Fisher dominates as a diversified life sciences and analytical instruments powerhouse. RadNet operates as a focused outpatient diagnostic imaging service provider with AI integration. This analysis contrasts Thermo Fisher’s scale-driven innovation with RadNet’s specialized growth to identify the superior risk-adjusted investment opportunity for a balanced portfolio.

Table of contents
Companies Overview
Thermo Fisher Scientific and RadNet stand as key players in the medical diagnostics and research landscape.
Thermo Fisher Scientific Inc.: Global Life Sciences Powerhouse
Thermo Fisher dominates the life sciences solutions market. It generates revenue through reagents, instruments, and consumables for biological research, drug production, and diagnostics. In 2026, its strategic focus centers on expanding biopharma services and integrating advanced laboratory products to enhance global healthcare and research capabilities. Its diversified portfolio spans biosciences, genetic sciences, and specialty diagnostics.
RadNet, Inc.: Outpatient Imaging Leader
RadNet specializes in outpatient diagnostic imaging services across the U.S. Revenue stems from advanced imaging techniques including MRI, CT, and PET scans. In 2026, RadNet emphasizes deploying AI-driven diagnostic tools to improve radiologist accuracy and expand its imaging centers network. Its competitive edge lies in combining multi-modality imaging with innovative AI solutions.
Strategic Collision: Similarities & Divergences
Both firms operate in healthcare diagnostics but pursue distinct models. Thermo Fisher invests in a broad, integrated life sciences ecosystem, while RadNet focuses on outpatient imaging with AI-enhanced diagnostics. Their primary battleground is diagnostic precision and service innovation. Investors should note Thermo Fisher’s expansive scale contrasts with RadNet’s niche AI-driven imaging growth.
Income Statement Comparison
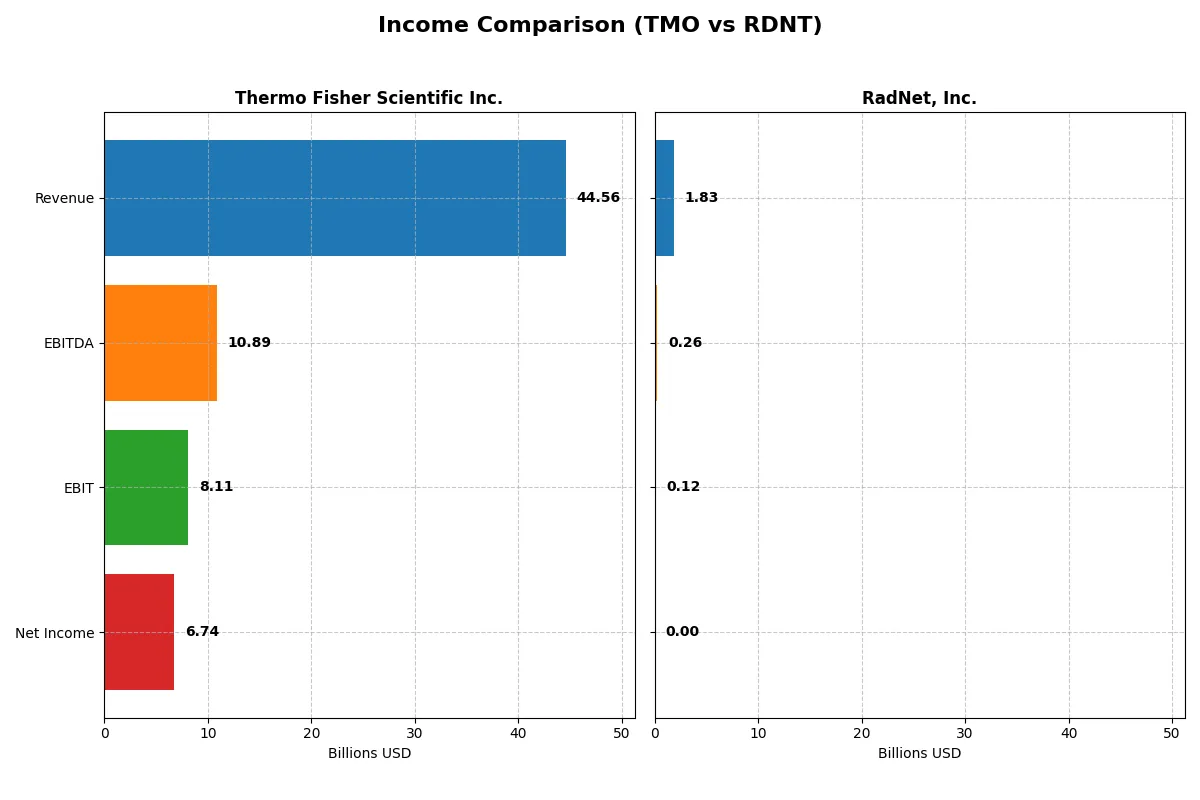
This data dissects the core profitability and scalability of both corporate engines to reveal who dominates the bottom line:
| Metric | Thermo Fisher Scientific Inc. (TMO) | RadNet, Inc. (RDNT) |
|---|---|---|
| Revenue | 44.6B | 1.83B |
| Cost of Revenue | 27.8B | 1.58B |
| Operating Expenses | 8.67B | 144.5M |
| Gross Profit | 16.8B | 249.1M |
| EBITDA | 10.9B | 262.5M |
| EBIT | 8.11B | 124.7M |
| Interest Expense | 1.42B | 79.8M |
| Net Income | 6.74B | 2.79M |
| EPS | 17.77 | 0.0382 |
| Fiscal Year | 2025 | 2024 |
Income Statement Analysis: The Bottom-Line Duel
This income statement comparison highlights which company runs the most efficient and profitable business engine based on recent financial data.
Thermo Fisher Scientific Inc. Analysis
Thermo Fisher’s revenue grew modestly to $44.6B in 2025, but net income fell 13% over five years to $6.7B. Its gross margin remains strong at 37.7%, though it slipped 5% year-over-year. EBIT margin holds a healthy 18.2%, reflecting solid operational control despite a 7% EBIT decline last year. EPS shows resilience, rising 7% in 2025.
RadNet, Inc. Analysis
RadNet’s revenue surged 13% to $1.83B in 2024, with net income climbing dramatically by 119% over five years to just $2.8M. Gross margin sits low at 13.6%, but improved 12.5% last year. EBIT margin is modest at 6.8%, though it expanded 21% year-over-year. Net margin remains thin at 0.15%, signaling ongoing profitability challenges despite strong top-line growth.
Margin Strength vs. Growth Potential
Thermo Fisher dominates in scale and margin quality, delivering consistent profitability and operational efficiency. RadNet posts impressive revenue and net income growth but struggles with low profitability and slim margins. For investors, Thermo Fisher’s robust margin profile offers stability, while RadNet presents a higher-risk, growth-oriented profile with less margin cushion.
Financial Ratios Comparison
These vital ratios act as a diagnostic tool to expose the underlying fiscal health, valuation premiums, and capital efficiency of the companies compared below:
| Ratios | Thermo Fisher Scientific Inc. (TMO) | RadNet, Inc. (RDNT) |
|---|---|---|
| ROE | 12.6% | 0.3% |
| ROIC | 7.6% | 3.1% |
| P/E | 32.3 | 1826.3 |
| P/B | 4.08 | 5.65 |
| Current Ratio | 1.89 | 2.12 |
| Quick Ratio | 1.53 | 2.12 |
| D/E (Debt-to-Equity) | 0.74 | 1.92 |
| Debt-to-Assets | 35.7% | 52.6% |
| Interest Coverage | 5.71 | 1.31 |
| Asset Turnover | 0.40 | 0.56 |
| Fixed Asset Turnover | 4.22 | 1.37 |
| Payout ratio | 9.4% | 0% |
| Dividend yield | 0.29% | 0% |
| Fiscal Year | 2025 | 2024 |
Efficiency & Valuation Duel: The Vital Signs
Financial ratios act as a company’s DNA, exposing hidden risks and operational strengths that raw figures alone cannot reveal.
Thermo Fisher Scientific Inc.
Thermo Fisher exhibits solid profitability with a 12.6% ROE and a strong 15.1% net margin, indicating efficient operations. However, its valuation is stretched, with a P/E of 32.3 and P/B of 4.08, reflecting a premium price. The company returns value through a modest 0.29% dividend, balancing shareholder rewards with reinvestment in R&D.
RadNet, Inc.
RadNet struggles with profitability, showing a meager 0.31% ROE and near-zero net margin, signaling operational challenges. Its valuation is extreme, with a P/E exceeding 1800 and P/B at 5.65, suggesting overstretched expectations. The absence of dividends and high debt levels point to reinvestment focused on survival rather than shareholder returns.
Premium Valuation vs. Operational Safety
Thermo Fisher offers a better balance of profitability and operational efficiency despite a premium valuation. RadNet’s unfavorable profitability and valuation expose higher risks. Investors seeking stability and measured growth may prefer Thermo Fisher’s profile, while RadNet suits high-risk tolerance only.
Which one offers the Superior Shareholder Reward?
I observe Thermo Fisher Scientific (TMO) pays a modest 0.29% dividend yield with a sustainable ~9% payout ratio, backed by strong free cash flow (FCF) coverage of 80%. It complements dividends with steady buybacks. RadNet (RDNT) pays no dividend and shows weak free cash flow, focusing on debt reduction and reinvestment. TMO’s balanced distribution and robust cash generation offer a superior total return profile in 2026.
Comparative Score Analysis: The Strategic Profile
The radar chart reveals the fundamental DNA and trade-offs of Thermo Fisher Scientific Inc. and RadNet, Inc., highlighting strengths and vulnerabilities in key financial metrics:
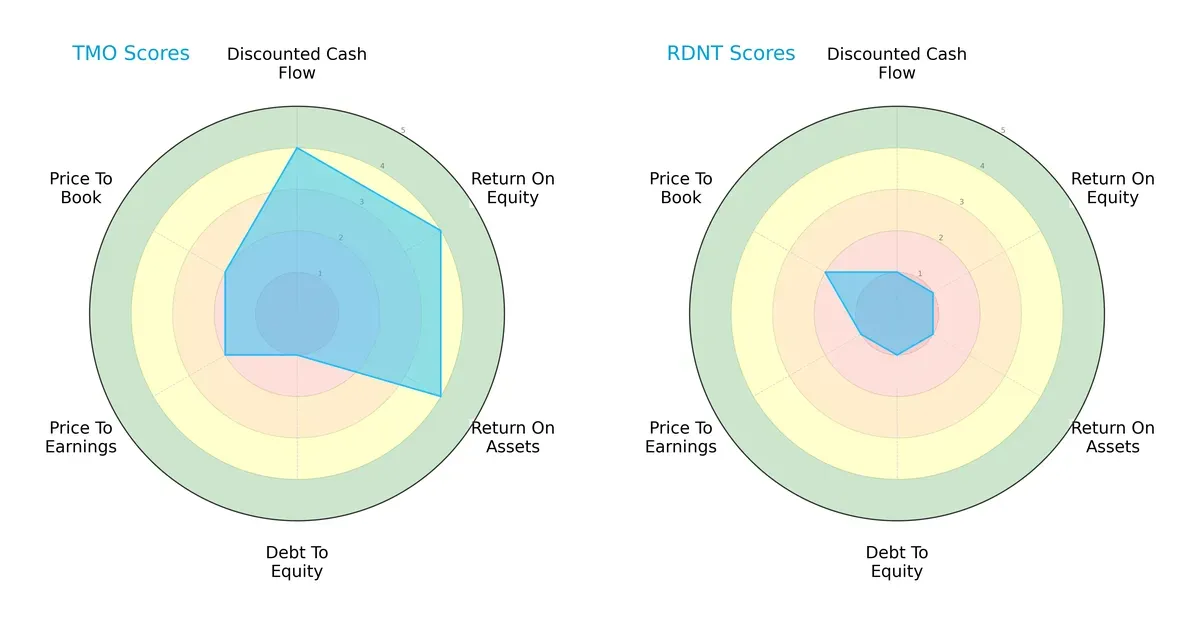
Thermo Fisher demonstrates a strong edge in DCF, ROE, and ROA, scoring 4 across these metrics, indicating efficient capital use and profitability. However, its debt-to-equity score is a red flag at 1, signaling elevated leverage risk. RadNet scores uniformly low (1) except for a moderate price-to-book of 2, reflecting a lack of competitive strengths and financial discipline. Thermo Fisher shows a more balanced, high-quality profile, while RadNet relies on a marginal valuation advantage.
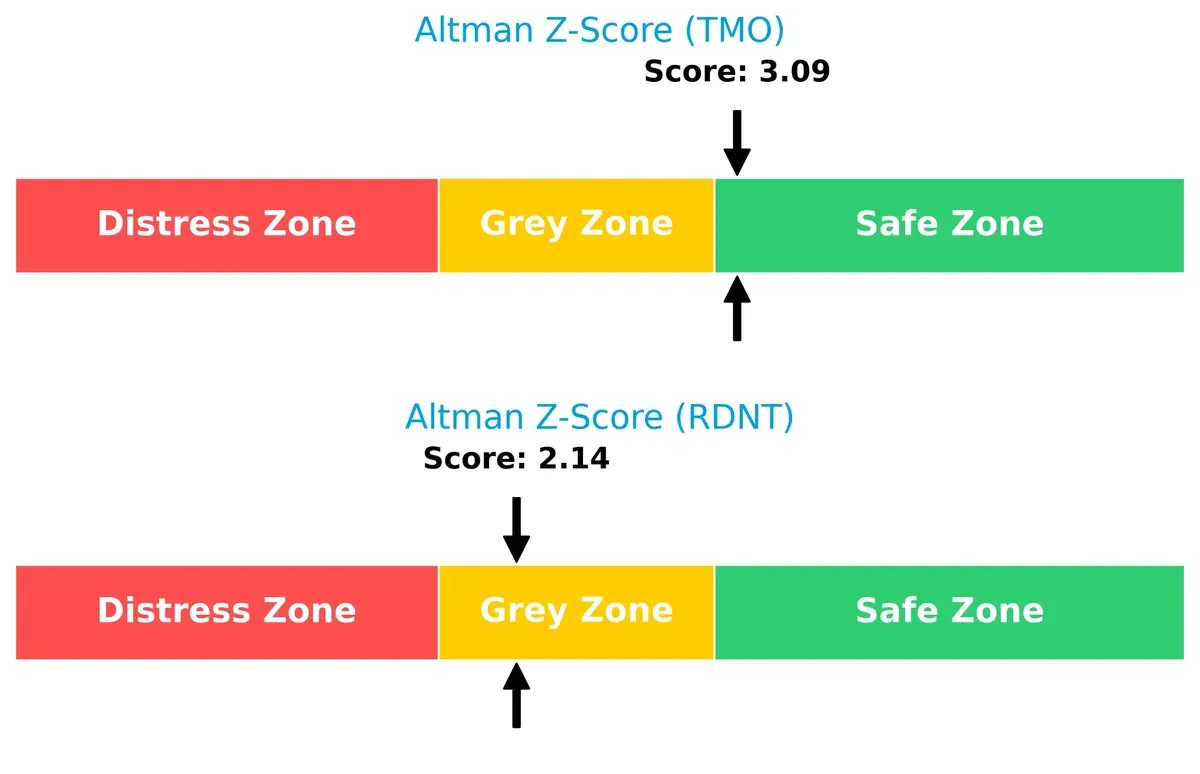
Bankruptcy Risk: Solvency Showdown
Thermo Fisher’s Altman Z-Score of 3.09 places it solidly in the safe zone, signaling robust financial stability. RadNet’s 2.14 lingers in the grey zone, suggesting moderate bankruptcy risk in this economic cycle:
Financial Health: Quality of Operations
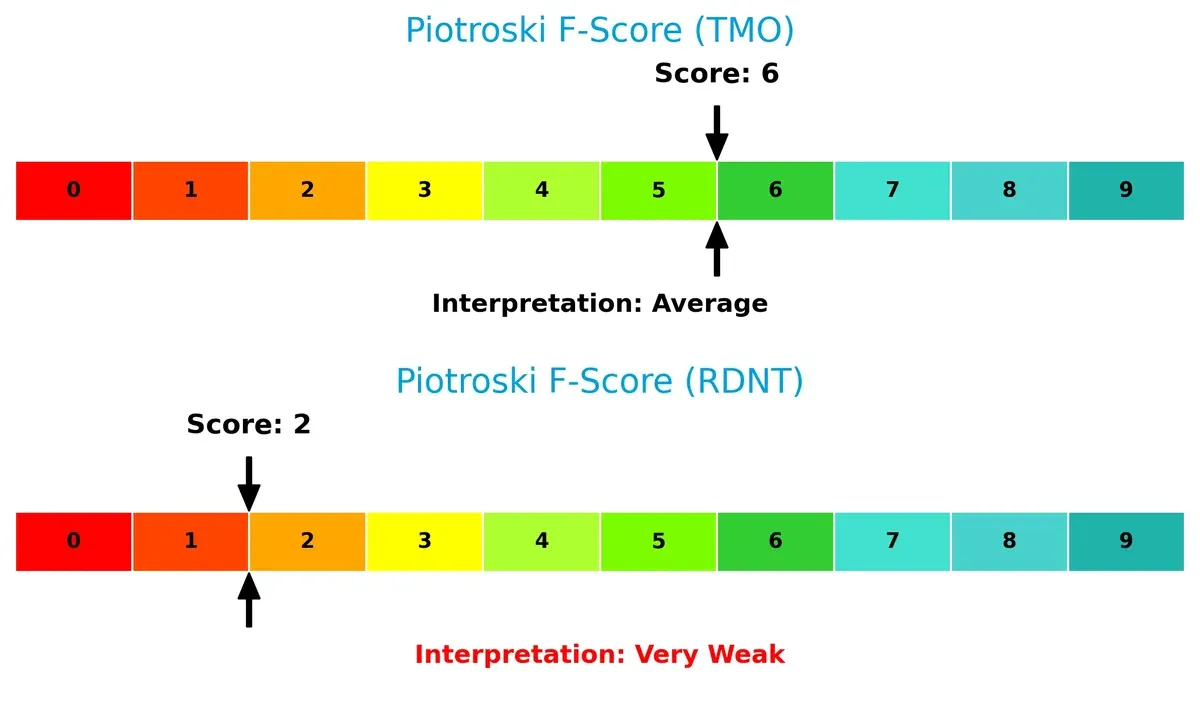
Thermo Fisher’s Piotroski F-Score of 6 reflects solid financial health and operational quality. RadNet’s score of 2 flags serious internal weaknesses and red flags in profitability and efficiency:
How are the two companies positioned?
This section dissects the operational DNA of Thermo Fisher Scientific and RadNet by comparing their revenue distribution and internal strengths and weaknesses. The goal is to confront their economic moats to identify which model offers the most resilient and sustainable competitive advantage today.
Revenue Segmentation: The Strategic Mix
This comparison dissects how Thermo Fisher Scientific Inc. and RadNet, Inc. diversify their income streams and reveals their primary sector bets:
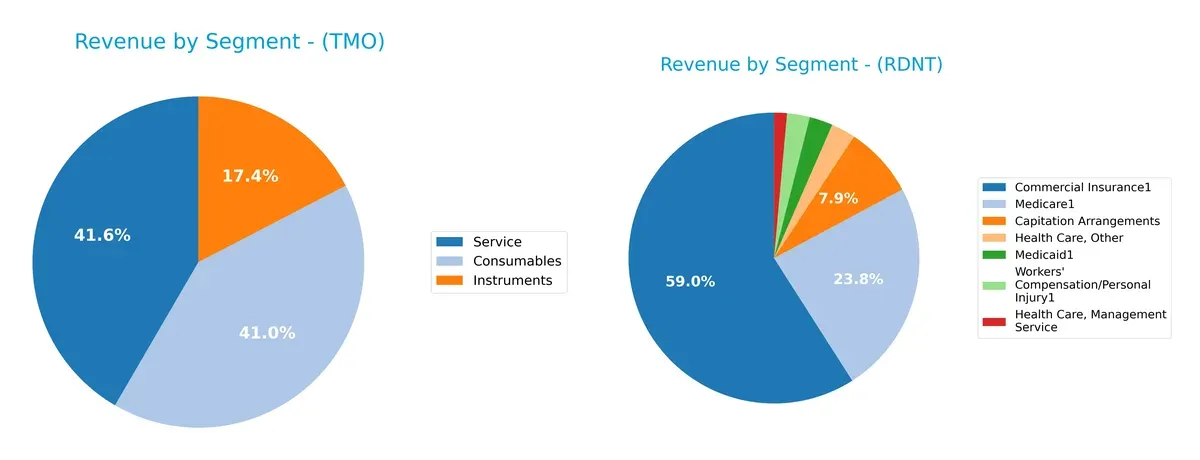
Thermo Fisher anchors revenue in three broad segments: Consumables at $17.6B, Service at $17.8B, and Instruments at $7.4B, showing a balanced, diversified portfolio. RadNet, in contrast, pivots heavily on Commercial Insurance at $1.0B and Health Care Patient Service near $1.0B, highlighting concentration risk but also deep specialization in healthcare services. Thermo Fisher’s mix cushions against sector cycles, while RadNet’s focus suggests exposure to healthcare policy shifts.
Strengths and Weaknesses Comparison
This table compares the strengths and weaknesses of Thermo Fisher Scientific Inc. and RadNet, Inc.:
Thermo Fisher Scientific Inc. Strengths
- Diversified revenue across Consumables, Instruments, and Services
- Strong global presence with significant US, Europe, and Asia Pacific sales
- Favorable net margin of 15.12% and solid current and quick ratios
- ROIC near WACC indicating efficient capital use
RadNet, Inc. Strengths
- Favorable current and quick ratios above 2.0 signal liquidity strength
- Moderate asset turnover suggesting operational activity
- Focused US geographic presence with $1.8B revenue
- Some diversification in revenue streams within healthcare services
Thermo Fisher Scientific Inc. Weaknesses
- High P/E and P/B ratios indicate possible overvaluation
- Asset turnover is relatively low at 0.4
- Dividend yield minimal at 0.29%
- Neutral ROE and D/E ratios highlight moderate profitability and leverage
RadNet, Inc. Weaknesses
- Extremely low net margin (0.15%) and ROE (0.31%) indicate poor profitability
- High debt-to-equity (1.92) and debt-to-assets (52.6%) ratios raise financial risk
- Interest coverage ratio weak at 1.56, signaling debt servicing challenges
- Very high P/E and P/B ratios suggest valuation concerns
- No dividend yield
Thermo Fisher’s diversified global footprint and favorable profitability metrics contrast with RadNet’s concentrated US market focus and weaker profitability. RadNet’s financial leverage and earnings challenges could pressure strategic flexibility.
The Moat Duel: Analyzing Competitive Defensibility
A structural moat is the only true shield guarding long-term profits from relentless competition erosion. Let’s examine how these two firms defend their turf:
Thermo Fisher Scientific Inc.: Intangible Assets Fueling Scientific Dominance
Thermo Fisher’s moat stems from deep intellectual property and trusted brand in life sciences. This translates into strong margin stability and 15% net margins. Yet, declining ROIC signals pressure; new product innovation must accelerate in 2026 to sustain advantage.
RadNet, Inc.: Network Effects in Diagnostic Imaging Services
RadNet’s moat is a growing network of outpatient centers and AI-enhanced diagnostics, differentiating it from Thermo Fisher’s asset-heavy model. Rising ROIC and rapid revenue growth highlight strengthening competitive positioning. Expansion into AI diagnostics could disrupt markets further in 2026.
Innovation Depth vs. Network Breadth: Which Moat Holds Stronger?
Thermo Fisher’s intangible asset moat is wide but under pressure with declining ROIC. RadNet’s narrower but deepening network moat shows improving profitability and growth. I see RadNet as better poised to defend and expand market share in 2026.
Which stock offers better returns?
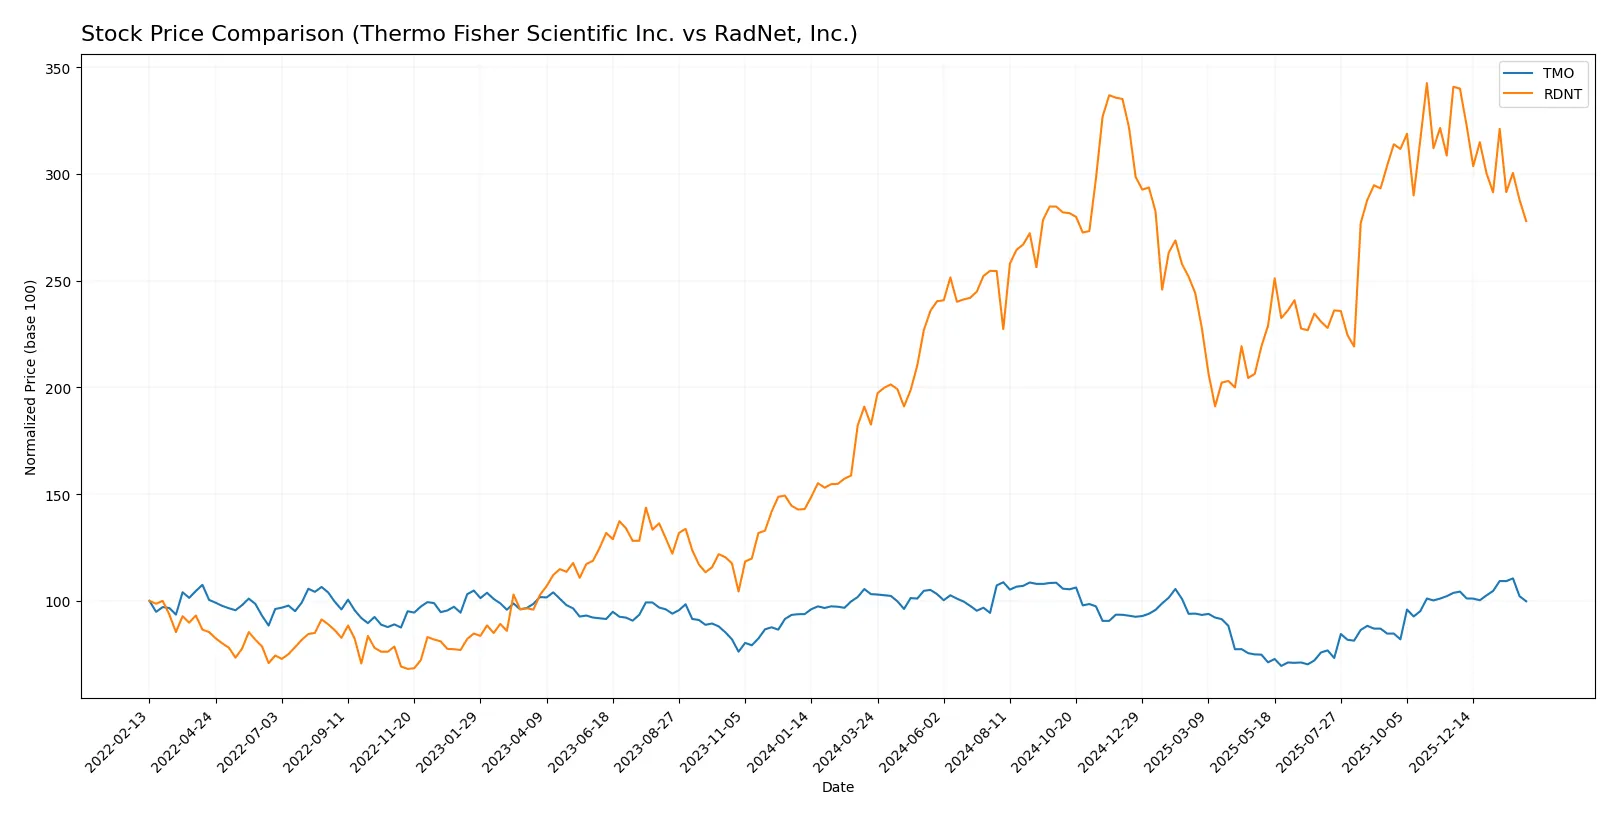
The past year reveals contrasting dynamics: Thermo Fisher Scientific’s shares declined steadily, while RadNet posted strong gains before a recent pullback.
Trend Comparison
Thermo Fisher Scientific’s stock fell 3.24% over the past 12 months, marking a bearish trend with accelerating decline and a high volatility of 64.57. Its price ranged between 394 and 626.
RadNet’s shares rose 52.26% over the past year, showing a bullish trend with decelerating momentum. Volatility remained low at 10.24, with prices fluctuating from 44 to 83.
RadNet outperformed Thermo Fisher significantly despite recent weakness, delivering the highest market performance over the analyzed period.
Target Prices
Analysts present a constructive consensus on target prices for Thermo Fisher Scientific Inc. and RadNet, Inc.
| Company | Target Low | Target High | Consensus |
|---|---|---|---|
| Thermo Fisher Scientific Inc. | 561 | 750 | 643.69 |
| RadNet, Inc. | 90 | 95 | 92.25 |
The target consensus for Thermo Fisher (643.69) sits well above its current price (565.22), signaling upside potential. RadNet’s consensus (92.25) also suggests modest growth from its current price (67.68).

Don’t Let Luck Decide Your Entry Point
Optimize your entry points with our advanced ProRealTime indicators. You’ll get efficient buy signals with precise price targets for maximum performance. Start outperforming now!
How do institutions grade them?
Thermo Fisher Scientific Inc. Grades
The following table summarizes recent grade actions by major financial institutions for Thermo Fisher Scientific Inc.:
| Grading Company | Action | New Grade | Date |
|---|---|---|---|
| TD Cowen | Maintain | Buy | 2026-01-30 |
| Barclays | Maintain | Overweight | 2026-01-30 |
| Citigroup | Maintain | Buy | 2026-01-30 |
| Stifel | Maintain | Buy | 2026-01-09 |
| TD Cowen | Maintain | Buy | 2026-01-07 |
| Wells Fargo | Maintain | Overweight | 2025-12-15 |
| Citigroup | Upgrade | Buy | 2025-12-11 |
| Keybanc | Upgrade | Overweight | 2025-12-08 |
| Morgan Stanley | Maintain | Overweight | 2025-12-02 |
| HSBC | Upgrade | Buy | 2025-12-01 |
RadNet, Inc. Grades
The table below shows recent grade actions by reputable firms for RadNet, Inc.:
| Grading Company | Action | New Grade | Date |
|---|---|---|---|
| B. Riley Securities | Maintain | Buy | 2025-12-01 |
| Barclays | Maintain | Overweight | 2025-11-13 |
| Truist Securities | Maintain | Buy | 2025-11-12 |
| Truist Securities | Maintain | Buy | 2025-09-03 |
| Barclays | Maintain | Overweight | 2025-09-03 |
| Raymond James | Maintain | Strong Buy | 2025-08-13 |
| Truist Securities | Maintain | Buy | 2025-04-11 |
| Barclays | Maintain | Overweight | 2025-03-24 |
| Raymond James | Upgrade | Strong Buy | 2025-03-05 |
| Barclays | Maintain | Overweight | 2025-01-22 |
Which company has the best grades?
RadNet, Inc. has received several Strong Buy ratings and consistent Buy/Overweight grades. Thermo Fisher Scientific Inc. shows mostly Buy and Overweight grades but no Strong Buy. RadNet’s higher grades may imply stronger analyst confidence, potentially influencing investor sentiment more favorably.
Risks specific to each company
The following categories identify critical pressure points and systemic threats facing Thermo Fisher Scientific Inc. and RadNet, Inc. in the 2026 market environment:
1. Market & Competition
Thermo Fisher Scientific Inc.
- Dominates life sciences with strong global presence and diversified segments.
RadNet, Inc.
- Operates in US outpatient diagnostic imaging, facing intense regional competition.
2. Capital Structure & Debt
Thermo Fisher Scientific Inc.
- Moderate leverage (D/E 0.74), favorable interest coverage (5.71x), balanced debt-to-assets.
RadNet, Inc.
- High leverage (D/E 1.92), weak interest coverage (1.56x), risky debt-to-assets ratio (52.6%).
3. Stock Volatility
Thermo Fisher Scientific Inc.
- Beta near market average (0.95), implying moderate volatility.
RadNet, Inc.
- Elevated beta (1.49), indicating higher stock price swings and risk.
4. Regulatory & Legal
Thermo Fisher Scientific Inc.
- Subject to global healthcare regulations, but diversified exposure mitigates localized regulatory shocks.
RadNet, Inc.
- Focused on US diagnostics, vulnerable to regional healthcare policy changes and reimbursement pressures.
5. Supply Chain & Operations
Thermo Fisher Scientific Inc.
- Complex global supply chain; benefits from diversified sourcing but exposed to geopolitical disruptions.
RadNet, Inc.
- Operational risks tied to managing 347 US centers; less global diversification increases vulnerability.
6. ESG & Climate Transition
Thermo Fisher Scientific Inc.
- Increasing ESG initiatives aligned with industry standards; large scale aids transition investments.
RadNet, Inc.
- Smaller scale and regional focus may limit ESG resource allocation and adaptation speed.
7. Geopolitical Exposure
Thermo Fisher Scientific Inc.
- Broad international footprint exposes it to geopolitical risks but also diversifies impact.
RadNet, Inc.
- Primarily US-based, geopolitical risks limited but concentrated on domestic healthcare policy shifts.
Which company shows a better risk-adjusted profile?
Thermo Fisher’s most impactful risk is its valuation premium, reflected in high P/E and P/B ratios despite modest ROIC improvements. RadNet’s greatest concern is its heavy debt burden and weak profitability, raising default risk. Overall, Thermo Fisher presents a substantially better risk-adjusted profile, supported by a safe Altman Z-Score (3.09) and moderate Piotroski score (6), while RadNet lingers in the grey zone (Z-Score 2.14) with a very weak Piotroski (2). This stark contrast highlights Thermo Fisher’s superior financial resilience despite market pressures.
Final Verdict: Which stock to choose?
Thermo Fisher Scientific Inc. (TMO) excels as a cash-generating powerhouse with robust operational efficiency. Its superpower lies in stable income quality and a solid balance sheet, though a declining ROIC warns of value erosion. TMO suits portfolios targeting steady, slightly favorable growth with moderate risk tolerance.
RadNet, Inc. (RDNT) boasts a strategic moat in its improving profitability and strong revenue growth momentum. Despite weaker financial stability and higher leverage, its growing ROIC trend signals potential turnaround appeal. RDNT fits investors seeking dynamic growth with a higher risk appetite and long-term upside.
If you prioritize consistent value creation and balance sheet strength, Thermo Fisher outshines as the compelling choice due to its operational resilience and market stature. However, if you seek rapid growth potential and are comfortable with elevated risk, RadNet offers superior momentum and expanding profitability to consider.
Disclaimer: Investment carries a risk of loss of initial capital. The past performance is not a reliable indicator of future results. Be sure to understand risks before making an investment decision.
Go Further
I encourage you to read the complete analyses of Thermo Fisher Scientific Inc. and RadNet, Inc. to enhance your investment decisions: