Home > Comparison > Healthcare > RVTY vs RDNT
The strategic rivalry between Revvity, Inc. and RadNet, Inc. shapes the healthcare diagnostics and research landscape. Revvity operates as a diversified, technology-driven solutions provider spanning life sciences and diagnostics. In contrast, RadNet focuses on outpatient diagnostic imaging services and AI-powered radiology tools. This analysis explores their contrasting business models and competitive positioning to determine which offers a superior risk-adjusted return for a diversified portfolio in this dynamic sector.
Table of contents
Companies Overview
Revvity, Inc. and RadNet, Inc. are pivotal players in the US medical diagnostics sector, shaping healthcare innovation.
Revvity, Inc.: Global Life Sciences Innovator
Revvity dominates the diagnostics and research markets with its instrumentation and reagent sales. It earns through two key segments: Discovery & Analytical Solutions and Diagnostics. In 2026, it focuses on expanding genomic workflows and enhancing early genetic disorder detection — a strategic bet on precision medicine and biotech partnerships.
RadNet, Inc.: Leading Outpatient Imaging Provider
RadNet operates primarily in outpatient diagnostic imaging, generating revenue from MRI, CT, mammography, and AI-enhanced radiology services. Its 2026 strategy emphasizes broadening multi-modality imaging offerings and deploying AI to boost cancer detection accuracy, reinforcing its footprint across 347 US centers.
Strategic Collision: Similarities & Divergences
Both companies excel in medical diagnostics, yet Revvity embraces a product and technology development model, while RadNet delivers service-based imaging solutions. Their battleground centers on diagnostic innovation versus clinical accessibility. Investors face a choice between Revvity’s capital-intensive R&D focus and RadNet’s volume-driven outpatient imaging growth.
Income Statement Comparison
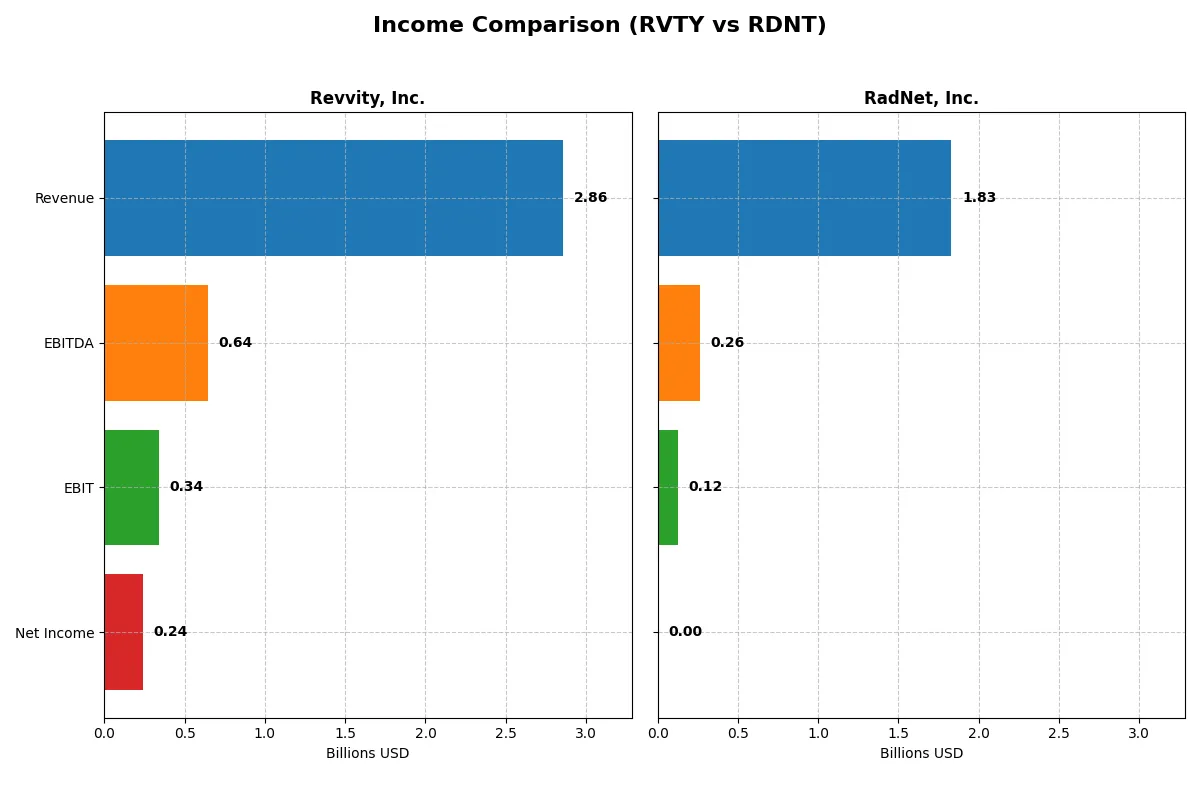
This data dissects the core profitability and scalability of both corporate engines to reveal who dominates the bottom line:
| Metric | Revvity, Inc. (RVTY) | RadNet, Inc. (RDNT) |
|---|---|---|
| Revenue | 2.86B | 1.83B |
| Cost of Revenue | 1.34B | 1.58B |
| Operating Expenses | 1.16B | 144.5M |
| Gross Profit | 1.52B | 249.1M |
| EBITDA | 643.7M | 262.5M |
| EBIT | 341.4M | 124.7M |
| Interest Expense | 92.2M | 79.8M |
| Net Income | 241.7M | 2.79M |
| EPS | 2.08 | 0.038 |
| Fiscal Year | 2025 | 2024 |
Income Statement Analysis: The Bottom-Line Duel
This income statement comparison reveals which company operates more efficiently and converts revenue into profit more effectively.
Revvity, Inc. Analysis
Revvity’s revenue declined 25% from 2021 to 2025, reaching $2.86B in 2025. Net income fell sharply by 74%, down to $242M. Despite a strong 53% gross margin and an 8.5% net margin, recent profit margins and EPS trends deteriorate, signaling operational challenges and margin compression.
RadNet, Inc. Analysis
RadNet’s revenue grew 71% over five years, hitting $1.83B in 2024. Net income surged 119%, though absolute profits remain modest at $3M. Gross margin stands at 14%, with a net margin near zero. The company shows improving EBIT growth and expanding revenue, but profitability remains thin.
Verdict: Margin Power vs. Revenue Scale
Revvity commands far superior margins but struggles with declining revenue and profits. RadNet delivers steady revenue growth and improving earnings, albeit from a low base. For investors, Revvity offers margin strength with risk, while RadNet presents growth momentum with limited current profitability.
Financial Ratios Comparison
These vital ratios act as a diagnostic tool to expose the underlying fiscal health, valuation premiums, and capital efficiency of the companies compared below:
| Ratios | Revvity, Inc. (RVTY) | RadNet, Inc. (RDNT) |
|---|---|---|
| ROE | 3.33% | 0.31% |
| ROIC | 2.82% | 3.14% |
| P/E | 45.32 | 1826.32 |
| P/B | 1.51 | 5.65 |
| Current Ratio | 1.68 | 2.12 |
| Quick Ratio | 1.40 | 2.12 |
| D/E | 0.46 | 1.92 |
| Debt-to-Assets | 27.68% | 52.60% |
| Interest Coverage | 3.87 | 1.31 |
| Asset Turnover | 0.23 | 0.56 |
| Fixed Asset Turnover | 4.43 | 1.37 |
| Payout Ratio | 13.57% | 0% |
| Dividend Yield | 0.30% | 0% |
| Fiscal Year | 2025 | 2024 |
Efficiency & Valuation Duel: The Vital Signs
Financial ratios serve as a company’s DNA, uncovering hidden risks and revealing operational strengths vital for investment decisions.
Revvity, Inc.
Revvity posts moderate profitability with a 3.33% ROE and an 8.46% net margin, but its P/E ratio of 45.3 signals an expensive stock. The company maintains solid liquidity with a 1.68 current ratio and manages debt prudently. Shareholders see minimal dividends (0.3%), indicating reinvestment focused on R&D, supporting long-term growth.
RadNet, Inc.
RadNet shows very low profitability, with a 0.31% ROE and a nearly negligible net margin of 0.15%. Its valuation is stretched, marked by an immense P/E of 1826 and a high price-to-book of 5.65. Despite a strong current ratio of 2.12, heavy debt (D/E 1.92) and no dividend reflect financial strain and limited shareholder returns.
Premium Valuation vs. Operational Safety
Revvity balances moderate profitability with manageable debt and reinvestment, while RadNet struggles with weak returns and excessive leverage. Revvity offers a better risk-reward profile, suiting investors prioritizing operational stability over speculative valuation spikes.
Which one offers the Superior Shareholder Reward?
I see Revvity, Inc. (RVTY) pays a modest dividend yield near 0.3% with a sustainable payout ratio around 13.6%. It backs this with steady buybacks, enhancing total returns. RadNet, Inc. (RDNT) pays no dividend, reinvesting heavily in capex with a weak free cash flow yield. RVTY’s balanced dividend and buyback strategy offers a more durable shareholder reward than RDNT’s growth-focused but cash-constrained model in 2026.
Comparative Score Analysis: The Strategic Profile
The radar chart exposes the core DNA and strategic trade-offs between Revvity, Inc. and RadNet, Inc.:
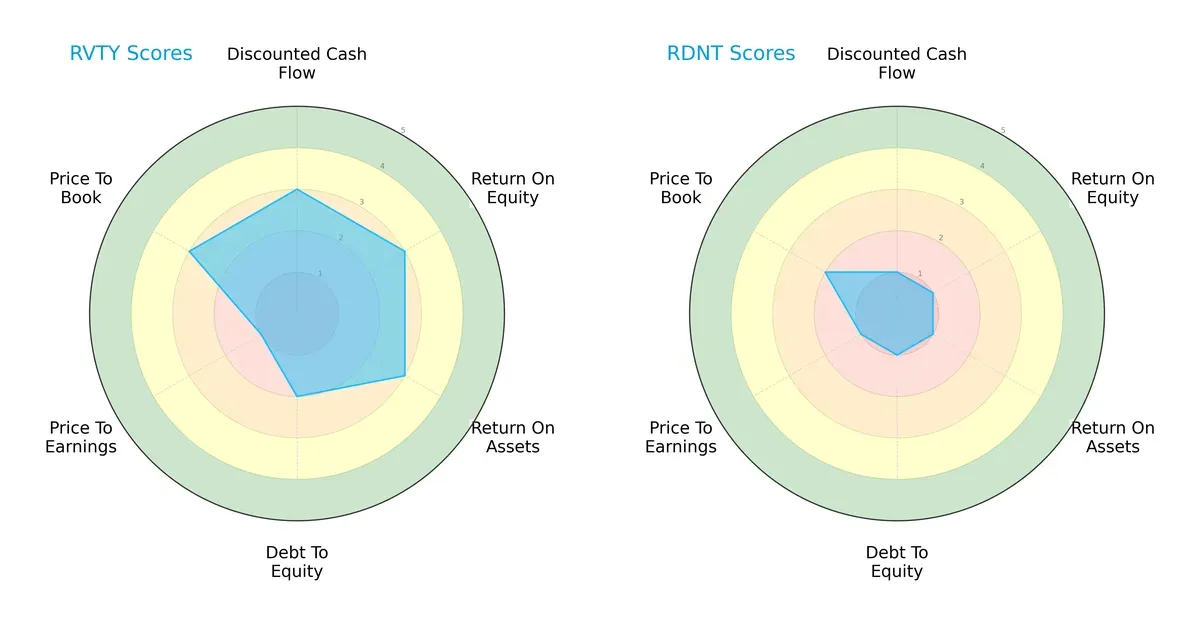
Revvity shows a balanced approach with moderate scores in DCF, ROE, and ROA, signaling efficient asset use and profitability. Its debt-to-equity is moderate but better than RadNet’s weak leverage profile. RadNet’s scores reveal a heavy reliance on low valuation multiples but suffer broadly in performance and financial stability metrics. Revvity’s profile is more robust and diversified, while RadNet depends on a singular valuation edge.
Bankruptcy Risk: Solvency Showdown
The Altman Z-Score difference places both firms in the grey zone, highlighting moderate bankruptcy risk in this economic cycle:
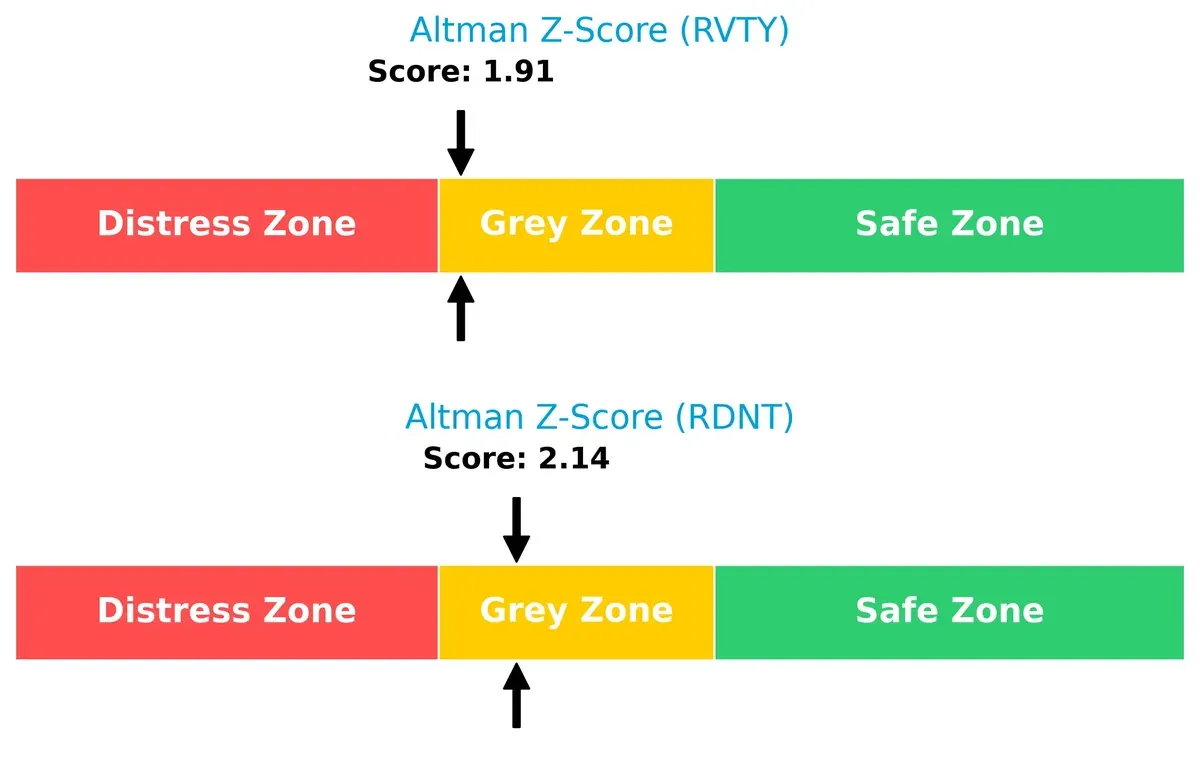
Revvity’s 1.91 versus RadNet’s 2.14 signals that neither company is in immediate distress but both face moderate solvency concerns. Investors must watch for operational or market shocks that could tip these firms into financial distress.
Financial Health: Quality of Operations
The Piotroski F-Score exposes a stark contrast in operational quality and financial strength:
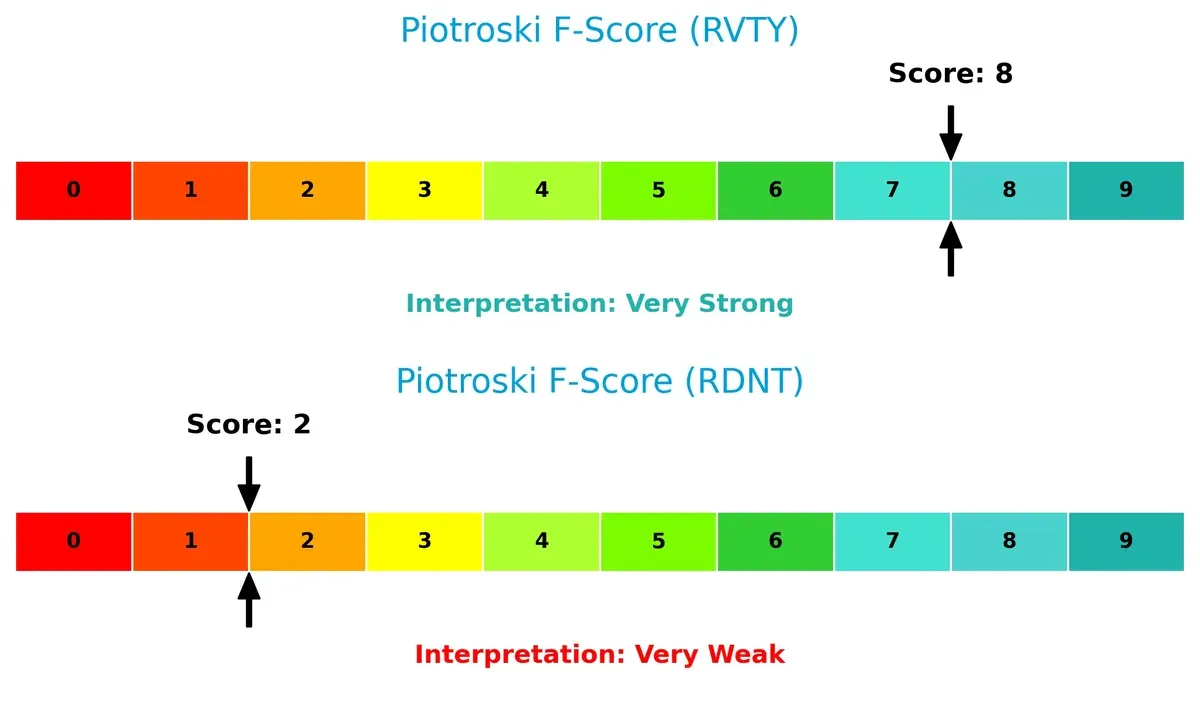
Revvity scores an impressive 8, indicating very strong financial health with disciplined capital allocation and profitability. RadNet’s score of 2 flags serious red flags in internal metrics. This suggests RadNet struggles with profitability, leverage, or liquidity, making it the riskier choice between the two.
How are the two companies positioned?
This section dissects the operational DNA of Revvity and RadNet by comparing their revenue distribution and internal strengths and weaknesses. The goal is to confront their economic moats to identify which model offers the most resilient competitive advantage today.
Revenue Segmentation: The Strategic Mix
This visual comparison dissects how Revvity, Inc. and RadNet, Inc. diversify their income streams and reveals where their primary sector bets lie:
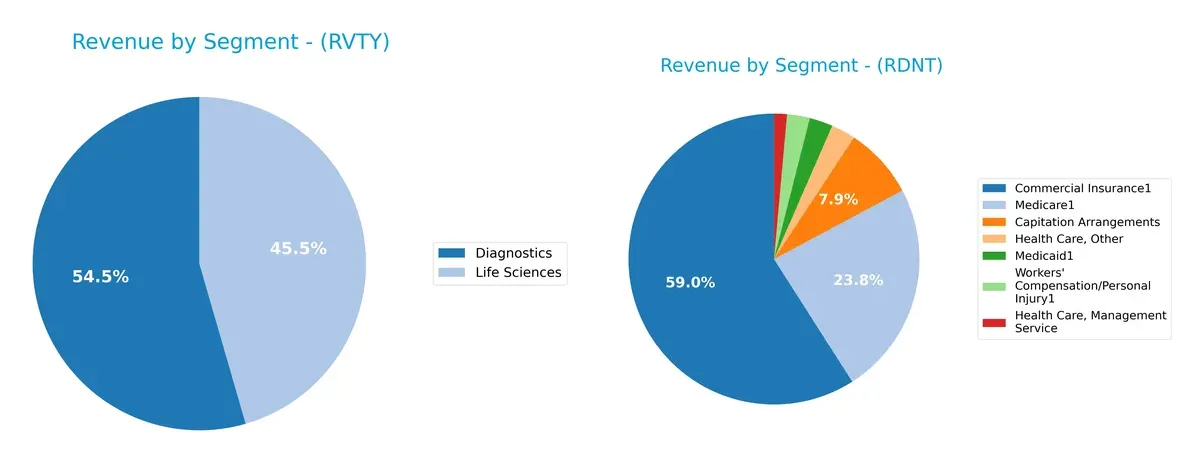
Revvity anchors its revenue in two nearly balanced segments: Diagnostics at $1.5B and Life Sciences at $1.25B. RadNet shows a far more fragmented mix, with Commercial Insurance dominating at $1B, but supported by Medicare ($410M), Capitation Arrangements ($137M), and several smaller healthcare services. Revvity’s focused dual-segment approach suggests specialization strength, while RadNet’s spread mitigates concentration risk but may dilute strategic focus.
Strengths and Weaknesses Comparison
This table compares the Strengths and Weaknesses of Revvity and RadNet based on diversification, profitability, financials, innovation, global presence, and market share:
Revvity Strengths
- Diversified revenue across Diagnostics and Life Sciences segments
- Strong global presence with significant sales in China, UK, and other international markets
- Favorable current and quick ratios indicate solid liquidity
- Low debt-to-assets ratio shows conservative financial management
RadNet Strengths
- High current and quick ratios suggest strong liquidity
- Neutral asset turnover indicates effective use of assets
- Focused US market presence with substantial revenue
- Diverse payer mix including commercial insurance and Medicare
Revvity Weaknesses
- Unfavorable ROE and ROIC imply low profitability relative to capital cost
- High P/E ratio signals overvaluation risk
- Moderate net margin and dividend yield raise profitability concerns
- Asset turnover is low, hinting at inefficient asset use
RadNet Weaknesses
- Low net margin and ROE indicate weak profitability
- High debt-to-equity and debt-to-assets ratios raise financial risk
- Very high P/E and P/B ratios suggest overvaluation
- Interest coverage is poor, increasing risk of debt servicing issues
- No dividend yield limits income appeal
Despite Revvity’s global diversification and stronger liquidity, its profitability metrics and valuation raise caution. RadNet shows liquidity strengths but suffers from profitability and leverage weaknesses, indicating higher financial risk. Both companies face challenges in balancing growth with efficient capital use.
The Moat Duel: Analyzing Competitive Defensibility
A structural moat is the only reliable shield protecting long-term profits from relentless competition erosion:
Revvity, Inc.: Intangible Assets Driving Scientific Precision
Revvity’s moat stems from its proprietary instruments and reagents critical to life sciences. Despite high gross margins (53%) and stable margins, its declining ROIC signals weakening value creation. Innovation in genomics may deepen its moat if executed well.
RadNet, Inc.: Scale and AI-Enhanced Service Network
RadNet leverages a broad outpatient imaging network and AI tools to improve diagnostics. Unlike Revvity’s product focus, RadNet’s moat is service-based. Its growing ROIC and strong revenue growth (71% over five years) reflect strengthening competitive positioning.
Instruments & Innovation vs. Service Scale & AI
RadNet exhibits a wider moat with improving profitability and growth, while Revvity’s declining ROIC warns of erosion. RadNet is better equipped to defend and expand its market share in 2026.
Which stock offers better returns?
The past year reveals contrasting stock trajectories: Revvity, Inc. shows a mild overall decline but recent gains, while RadNet, Inc. exhibits a strong annual rise with a recent pullback.
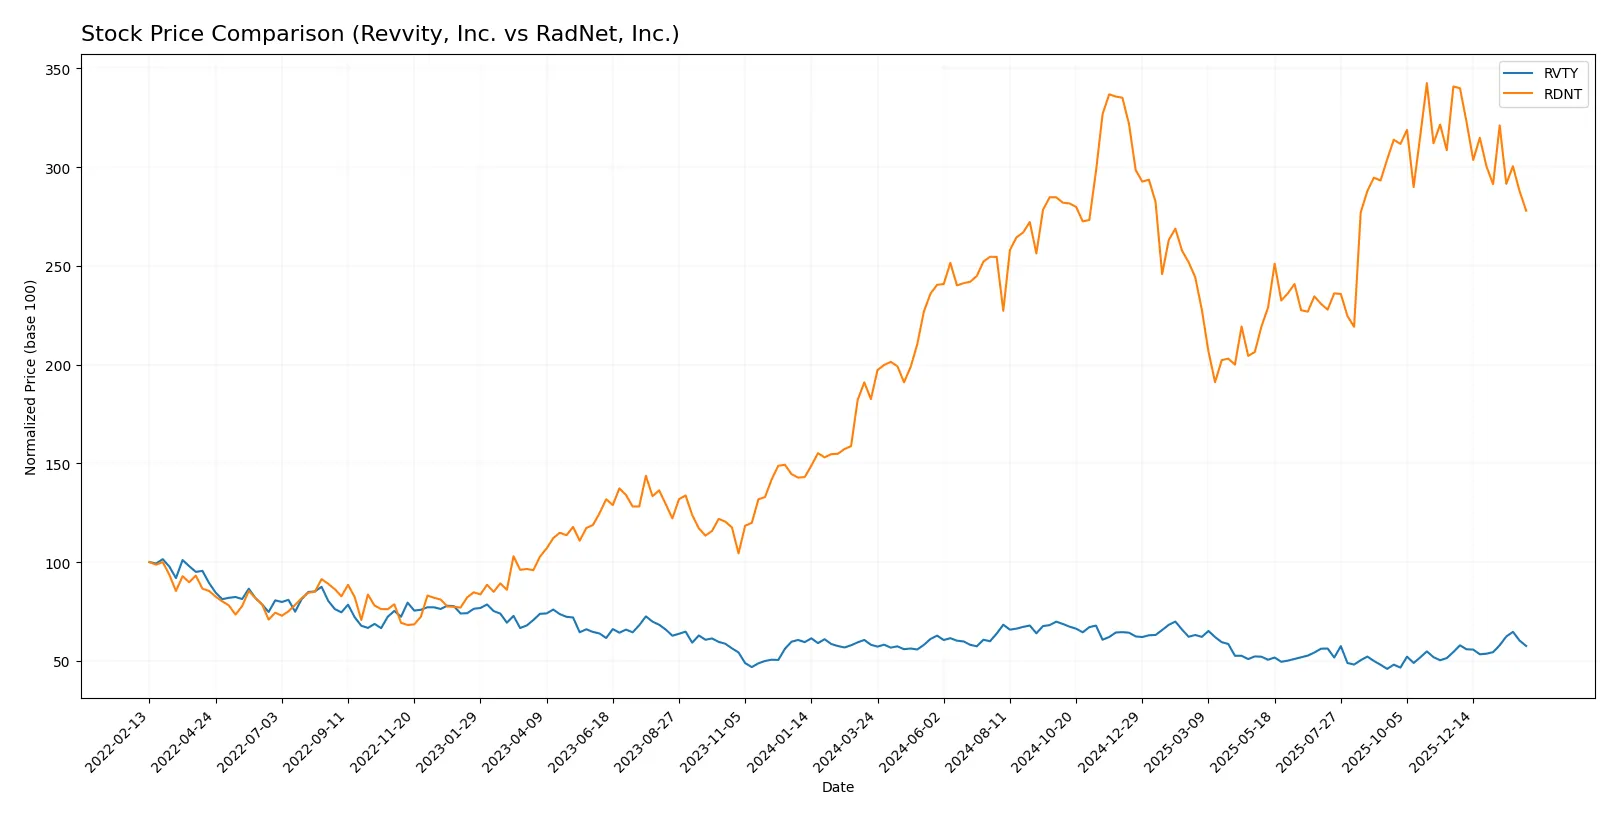
Trend Comparison
Revvity, Inc. declined by 1.02% over the past year, marking a bearish trend with accelerating momentum. Its price ranged between 82.87 and 126.13, showing recent recovery of 5.66%.
RadNet, Inc. gained 52.26% in the same period, indicating a bullish trend despite decelerating strength. The stock hit a high of 83.41 and a low of 44.45, but recently dropped 18.46%.
RadNet clearly outperformed Revvity over the last year, delivering the highest market return despite its recent short-term weakness.
Target Prices
Analysts present a cautiously optimistic target consensus for both Revvity, Inc. and RadNet, Inc.
| Company | Target Low | Target High | Consensus |
|---|---|---|---|
| Revvity, Inc. | 105 | 129 | 115.14 |
| RadNet, Inc. | 90 | 95 | 92.25 |
Revvity’s consensus target of 115.14 implies upside from its current 103.83 price, reflecting confidence in its diagnostics and research segments. RadNet’s consensus near 92.25 also suggests significant room for growth above the 67.68 market price.

Don’t Let Luck Decide Your Entry Point
Optimize your entry points with our advanced ProRealTime indicators. You’ll get efficient buy signals with precise price targets for maximum performance. Start outperforming now!
How do institutions grade them?
Here is a comparison of the recent institutional grades for both companies:
Revvity, Inc. Grades
The following table summarizes Revvity’s latest grades from reputable firms.
| Grading Company | Action | New Grade | Date |
|---|---|---|---|
| Evercore ISI Group | Maintain | Outperform | 2026-02-03 |
| Wells Fargo | Maintain | Equal Weight | 2026-02-03 |
| JP Morgan | Maintain | Neutral | 2026-02-03 |
| Jefferies | Maintain | Hold | 2026-02-03 |
| TD Cowen | Maintain | Buy | 2026-02-03 |
| Barclays | Maintain | Overweight | 2026-02-03 |
| Wells Fargo | Maintain | Equal Weight | 2025-12-15 |
| Barclays | Maintain | Overweight | 2025-12-15 |
| Barclays | Maintain | Overweight | 2025-10-28 |
| Baird | Maintain | Outperform | 2025-10-28 |
RadNet, Inc. Grades
Below is a summary of RadNet’s recent institutional grades.
| Grading Company | Action | New Grade | Date |
|---|---|---|---|
| B. Riley Securities | Maintain | Buy | 2025-12-01 |
| Barclays | Maintain | Overweight | 2025-11-13 |
| Truist Securities | Maintain | Buy | 2025-11-12 |
| Truist Securities | Maintain | Buy | 2025-09-03 |
| Barclays | Maintain | Overweight | 2025-09-03 |
| Raymond James | Maintain | Strong Buy | 2025-08-13 |
| Truist Securities | Maintain | Buy | 2025-04-11 |
| Barclays | Maintain | Overweight | 2025-03-24 |
| Raymond James | Upgrade | Strong Buy | 2025-03-05 |
| Barclays | Maintain | Overweight | 2025-01-22 |
Which company has the best grades?
RadNet consistently receives stronger buy and overweight ratings than Revvity, reflecting higher institutional conviction. This may affect investor sentiment and stock demand favorably for RadNet.
Risks specific to each company
In 2026’s complex market, these categories reveal critical pressure points and systemic threats challenging both firms’ resilience and growth prospects:
1. Market & Competition
Revvity, Inc.
- Operates in diversified diagnostics and life sciences; faces innovation-driven competitive pressure.
RadNet, Inc.
- Focuses on outpatient diagnostic imaging; confronts intense pricing and regional competition.
2. Capital Structure & Debt
Revvity, Inc.
- Maintains moderate leverage (D/E 0.46) with favorable debt ratios and interest coverage.
RadNet, Inc.
- High leverage (D/E 1.92), weak interest coverage (1.56), signaling elevated financial risk.
3. Stock Volatility
Revvity, Inc.
- Beta near 1.09 shows moderate correlation with market swings; relatively stable.
RadNet, Inc.
- Higher beta at 1.49 indicates elevated stock volatility and investor risk sensitivity.
4. Regulatory & Legal
Revvity, Inc.
- Subject to healthcare and environmental regulations across multiple markets; manageable risk.
RadNet, Inc.
- Faces strict imaging and patient data regulations; potential for costly compliance issues.
5. Supply Chain & Operations
Revvity, Inc.
- Complex global supply chain for instruments and reagents; risk from global disruptions.
RadNet, Inc.
- Dependent on equipment and technology vendors; regional operational risks present.
6. ESG & Climate Transition
Revvity, Inc.
- Increasing pressure to meet sustainability goals in chemical and diagnostics sectors.
RadNet, Inc.
- Limited ESG disclosures; climate transition risk less articulated but emerging.
7. Geopolitical Exposure
Revvity, Inc.
- Global footprint exposes it to geopolitical tensions and trade policy shifts.
RadNet, Inc.
- Primarily US-focused, reducing geopolitical risk but sensitive to domestic healthcare policy changes.
Which company shows a better risk-adjusted profile?
Revvity’s moderate leverage and diversified business model reduce financial vulnerability. RadNet’s high debt and weak profitability amplify risk. Revvity’s Altman Z-score and Piotroski score indicate better financial health. RadNet’s extreme valuation multiples and poor financial metrics raise caution.
Revvity’s strongest risk is market competition in innovation-driven diagnostics. RadNet’s greatest threat is its stretched capital structure and associated default risk. Recent data show Revvity maintains healthier liquidity and leverage, supporting superior risk-adjusted resilience in 2026’s volatile healthcare sector.
Final Verdict: Which stock to choose?
Revvity, Inc. (RVTY) excels as a cash-efficient innovator with a strong intangible asset base driving its niche biotech solutions. Its key point of vigilance is declining profitability and value destruction, which tempers enthusiasm. RVTY suits investors targeting aggressive growth with tolerance for operational headwinds.
RadNet, Inc. (RDNT) offers a strategic moat through its growing profitability and improving ROIC trend, signaling operational improvements. It maintains a safer liquidity profile than RVTY but carries heavier debt and weaker earnings quality. RDNT aligns well with growth-at-a-reasonable-price investors seeking improving fundamentals with moderate risk.
If you prioritize aggressive innovation and can accept short-term margin pressures, RVTY is the compelling choice due to its unique biotech positioning. However, if you seek a steadily improving profitability story with better liquidity safeguards, RDNT offers better stability despite its debt load and valuation concerns.
Disclaimer: Investment carries a risk of loss of initial capital. The past performance is not a reliable indicator of future results. Be sure to understand risks before making an investment decision.
Go Further
I encourage you to read the complete analyses of Revvity, Inc. and RadNet, Inc. to enhance your investment decisions: