In the rapidly evolving healthcare sector, diagnostic services play a crucial role in patient care and medical innovation. Quest Diagnostics Incorporated (DGX) and RadNet, Inc. (RDNT) are two prominent players specializing in diagnostic testing and imaging, respectively. Both companies leverage cutting-edge technology to enhance diagnostic accuracy and efficiency. This article will explore their strengths and growth prospects to help you identify which company holds the most promise for your investment portfolio.

Table of contents
Companies Overview
I will begin the comparison between Quest Diagnostics Incorporated and RadNet, Inc. by providing an overview of these two companies and their main differences.
Quest Diagnostics Incorporated Overview
Quest Diagnostics is a leading provider of diagnostic testing, information, and services in the US and internationally. It offers a wide range of clinical testing and diagnostic services through various brands, serving patients, clinicians, hospitals, and healthcare organizations. Founded in 1967 and headquartered in Secaucus, NJ, Quest Diagnostics operates with a workforce of 55,000 employees and emphasizes robust IT solutions alongside its diagnostic services.
RadNet, Inc. Overview
RadNet, Inc. specializes in outpatient diagnostic imaging services across the United States, including MRI, CT, PET, and mammography. The company also develops computerized systems and AI solutions to support diagnostic imaging and cancer detection. Founded in 1981 and based in Los Angeles, CA, RadNet operates 347 centers and employs 11,000 people, focusing on enhancing radiologist interpretation with advanced technology.
Key similarities and differences
Both Quest Diagnostics and RadNet operate in the medical diagnostics and research sector, providing diagnostic services to healthcare providers. Quest Diagnostics has a broader scope with extensive laboratory testing and IT solutions, while RadNet concentrates on imaging services and technological innovation in diagnostic imaging. Quest has a significantly larger workforce and market capitalization compared to RadNet, reflecting their differing scales and service focuses.
Income Statement Comparison
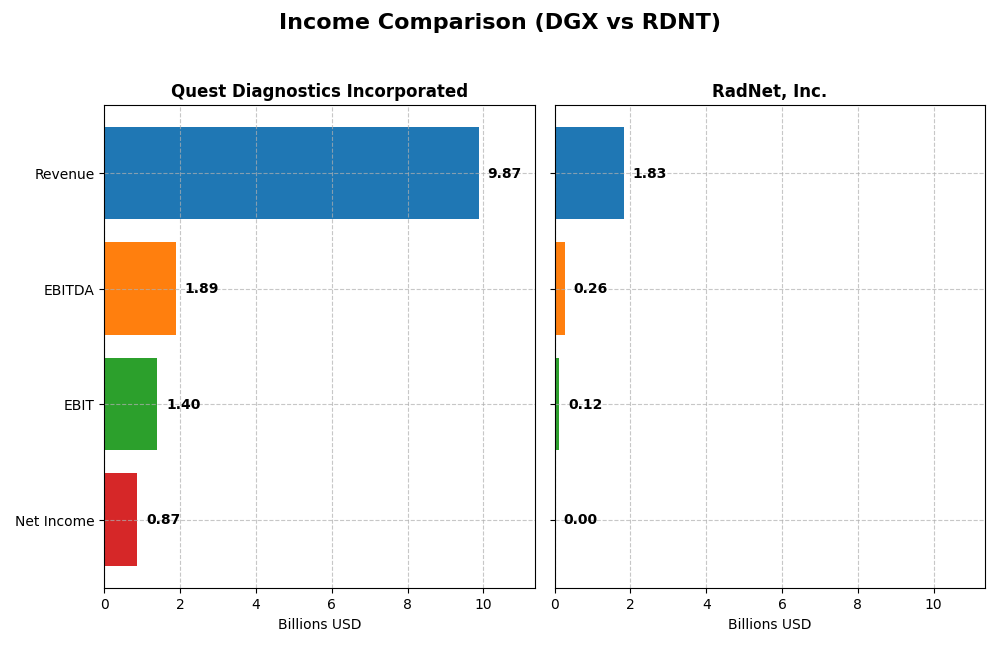
This table presents a side-by-side comparison of key income statement metrics for Quest Diagnostics Incorporated and RadNet, Inc. for the fiscal year 2024, highlighting their financial scale and profitability.
| Metric | Quest Diagnostics Incorporated (DGX) | RadNet, Inc. (RDNT) |
|---|---|---|
| Market Cap | 19.5B | 6.0B |
| Revenue | 9.87B | 1.83B |
| EBITDA | 1.89B | 263M |
| EBIT | 1.40B | 125M |
| Net Income | 871M | 2.8M |
| EPS | 7.80 | 0.038 |
| Fiscal Year | 2024 | 2024 |
Income Statement Interpretations
Quest Diagnostics Incorporated
Quest Diagnostics’ revenue showed moderate volatility from 2020 to 2024, peaking at 10.79B in 2021 and settling at 9.87B in 2024. Net income declined significantly over the period, from 1.99B in 2021 to 871M in 2024, with net margins contracting by 41.82%. The latest year showed a 6.7% revenue growth but a slight net margin decline, indicating mixed operational efficiency.
RadNet, Inc.
RadNet experienced strong revenue growth from 1.07B in 2020 to 1.83B in 2024, reflecting a 70.7% increase. Net income improved sharply, growing 118.82% over the period, reaching 2.79M in 2024, though net margin remained low at 0.15%. The recent year saw favorable revenue and EBIT growth but a decline in net margin and EPS, signaling ongoing margin pressures.
Which one has the stronger fundamentals?
Both companies show favorable overall income statement evaluations, but Quest Diagnostics maintains higher gross and EBIT margins with more stable interest expenses, indicating stronger profitability. RadNet shows stronger revenue and net income growth but struggles with very thin net margins. Consequently, Quest Diagnostics exhibits more solid fundamentals in profitability, whereas RadNet demonstrates higher growth dynamics but weaker margin control.
Financial Ratios Comparison
The table below presents a side-by-side comparison of key financial ratios for Quest Diagnostics Incorporated (DGX) and RadNet, Inc. (RDNT) based on their most recent fiscal year data (2024).
| Ratios | Quest Diagnostics (DGX) | RadNet (RDNT) |
|---|---|---|
| ROE | 12.85% | 0.31% |
| ROIC | 6.96% | 3.14% |
| P/E | 19.23 | 1826.32 |
| P/B | 2.47 | 5.65 |
| Current Ratio | 1.10 | 2.12 |
| Quick Ratio | 1.02 | 2.12 |
| D/E (Debt-to-Equity) | 1.05 | 1.92 |
| Debt-to-Assets | 43.87% | 52.60% |
| Interest Coverage | 5.96 | 1.31 |
| Asset Turnover | 0.61 | 0.56 |
| Fixed Asset Turnover | 3.57 | 1.37 |
| Payout ratio | 38.00% | 0% |
| Dividend yield | 1.98% | 0% |
Interpretation of the Ratios
Quest Diagnostics Incorporated
Quest Diagnostics shows mostly neutral to slightly favorable financial ratios with a stable net margin of 8.82% and a return on equity of 12.85%, signaling moderate profitability. The debt-to-equity ratio is unfavorable at 1.05, suggesting some leverage concerns. The company pays dividends with a 1.98% yield, supported by a balanced payout ratio and consistent free cash flow coverage, indicating sustainable shareholder returns.
RadNet, Inc.
RadNet’s ratios reflect several weaknesses, including a very low net margin of 0.15% and a minimal return on equity of 0.31%, highlighting profitability challenges. Its debt levels are high with a debt-to-equity ratio of 1.92 and unfavorable interest coverage at 1.56. The company does not pay dividends, likely prioritizing reinvestment or growth, which is typical given its financial constraints and operational focus.
Which one has the best ratios?
Comparing both, Quest Diagnostics possesses stronger and more balanced financial ratios with favorable coverage on profitability and shareholder returns. RadNet exhibits significant financial weaknesses and high leverage, resulting in an unfavorable overall ratios profile. Therefore, Quest Diagnostics holds the more favorable financial position based on these metrics.
Strategic Positioning
This section compares the strategic positioning of Quest Diagnostics (DGX) and RadNet (RDNT) based on Market position, Key segments, and exposure to disruption:
Quest Diagnostics (DGX)
- Leading diagnostics provider with $19.5B market cap, lower beta (0.64), faces moderate competitive pressure.
- Focused on diagnostic information services, routine and advanced clinical testing, pathology, with diverse client base.
- Limited explicit exposure to technological disruption, mainly through IT solutions supporting diagnostics.
RadNet (RDNT)
- Smaller $6.0B market cap, higher beta (1.51), operates in competitive outpatient diagnostic imaging market.
- Concentrated on outpatient imaging services, including MRI, CT, PET, plus AI solutions for cancer detection.
- Active development and deployment of AI suites enhancing radiologist imaging interpretation.
Quest Diagnostics vs RadNet Positioning
DGX pursues a diversified diagnostic testing portfolio serving various healthcare sectors, while RDNT concentrates on outpatient imaging and AI-driven diagnostics. DGX benefits from scale and brand diversity; RDNT emphasizes innovation in imaging technology and AI applications.
Which has the best competitive advantage?
Both DGX and RDNT are shedding value per their MOAT evaluations, with DGX showing declining profitability and RDNT improving profitability despite value destruction. Neither currently demonstrates a strong competitive advantage based on ROIC versus WACC analysis.
Stock Comparison
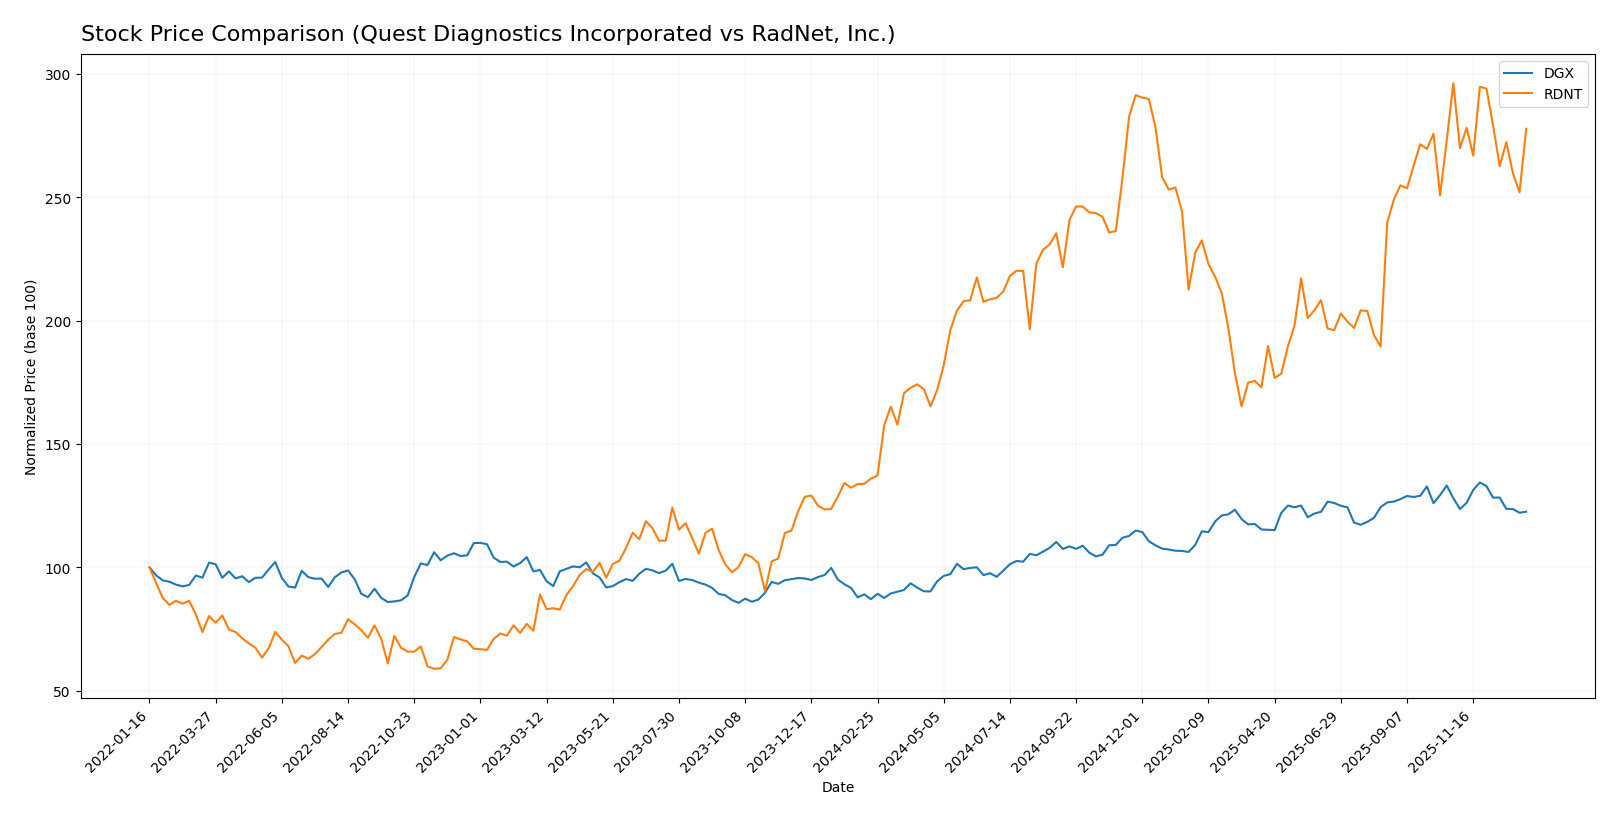
The stock prices of Quest Diagnostics Incorporated (DGX) and RadNet, Inc. (RDNT) have exhibited strong upward momentum over the past year, with both showing notable gains followed by a recent pullback in the last quarter.
Trend Analysis
Quest Diagnostics Incorporated (DGX) posted a 40.68% price increase over the past 12 months, indicating a bullish trend with deceleration. The stock reached a high of 191.25 and a low of 124.0, with volatility measured by a standard deviation of 18.03.
RadNet, Inc. (RDNT) showed a 104.23% price gain over the same period, also bullish but decelerating. Its price ranged between 38.29 and 83.41, with a lower volatility standard deviation of 11.02 compared to DGX.
Comparing the two, RadNet delivered the highest market performance with a stronger overall price increase, despite both stocks experiencing a recent mild downward trend.
Target Prices
Here is the current target price consensus from verified analysts for selected healthcare diagnostics companies:
| Company | Target High | Target Low | Consensus |
|---|---|---|---|
| Quest Diagnostics Incorporated | 215 | 190 | 201.6 |
| RadNet, Inc. | 95 | 90 | 92.25 |
Analysts expect Quest Diagnostics’ stock to appreciate significantly from its current price of 174.44 USD, indicating confidence in growth potential. RadNet’s consensus target also suggests upside from its present 78.2 USD, reflecting optimistic market sentiment.
Analyst Opinions Comparison
This section compares the analysts’ ratings and grades for Quest Diagnostics Incorporated and RadNet, Inc.:
Rating Comparison
DGX Rating
- Rating: B, evaluated as Very Favorable overall
- Discounted Cash Flow Score: 4, Favorable indication of valuation
- ROE Score: 4, Favorable efficient profit generation
- ROA Score: 4, Favorable asset utilization
- Debt To Equity Score: 1, Very Unfavorable financial risk due to high debt
- Overall Score: 3, Moderate overall financial standing
RDNT Rating
- Rating: D+, evaluated as Very Favorable overall
- Discounted Cash Flow Score: 1, Very Unfavorable indication
- ROE Score: 1, Very Unfavorable efficiency
- ROA Score: 1, Very Unfavorable asset utilization
- Debt To Equity Score: 1, Very Unfavorable financial risk
- Overall Score: 1, Very Unfavorable overall financial standing
Which one is the best rated?
Based strictly on the provided data, DGX is better rated than RDNT, with higher scores in discounted cash flow, ROE, ROA, and overall financial standing. Both have equally low debt-to-equity scores.
Scores Comparison
The comparison of scores between Quest Diagnostics (DGX) and RadNet (RDNT) is as follows:
DGX Scores
- Altman Z-Score: 3.20, indicating a safe zone with low bankruptcy risk.
- Piotroski Score: 7, classified as strong financial health.
RDNT Scores
- Altman Z-Score: 2.16, placing the company in the grey zone with moderate bankruptcy risk.
- Piotroski Score: 2, considered very weak financial strength.
Which company has the best scores?
Based strictly on the data, DGX exhibits better financial health with a safe zone Altman Z-Score and a strong Piotroski Score, while RDNT falls into the grey zone with a very weak Piotroski Score.
Grades Comparison
The following presents the latest reliable grade data for Quest Diagnostics Incorporated and RadNet, Inc.:
Quest Diagnostics Incorporated Grades
This table shows recent grades from recognized grading companies for Quest Diagnostics Incorporated.
| Grading Company | Action | New Grade | Date |
|---|---|---|---|
| Piper Sandler | Maintain | Neutral | 2025-10-27 |
| Truist Securities | Maintain | Hold | 2025-10-22 |
| Barclays | Maintain | Equal Weight | 2025-10-22 |
| Leerink Partners | Maintain | Outperform | 2025-10-21 |
| Jefferies | Maintain | Buy | 2025-10-21 |
| Mizuho | Maintain | Outperform | 2025-10-17 |
| UBS | Maintain | Neutral | 2025-10-17 |
| Evercore ISI Group | Maintain | In Line | 2025-10-08 |
| Barclays | Maintain | Equal Weight | 2025-10-02 |
| Baird | Downgrade | Neutral | 2025-08-25 |
Overall, Quest Diagnostics grades mostly indicate a neutral to hold consensus, with occasional outperform and buy ratings, showing moderate confidence but some caution.
RadNet, Inc. Grades
This table presents recent grades from reputable grading firms for RadNet, Inc.
| Grading Company | Action | New Grade | Date |
|---|---|---|---|
| B. Riley Securities | Maintain | Buy | 2025-12-01 |
| Barclays | Maintain | Overweight | 2025-11-13 |
| Truist Securities | Maintain | Buy | 2025-11-12 |
| Truist Securities | Maintain | Buy | 2025-09-03 |
| Barclays | Maintain | Overweight | 2025-09-03 |
| Raymond James | Maintain | Strong Buy | 2025-08-13 |
| Truist Securities | Maintain | Buy | 2025-04-11 |
| Barclays | Maintain | Overweight | 2025-03-24 |
| Raymond James | Upgrade | Strong Buy | 2025-03-05 |
| Barclays | Maintain | Overweight | 2025-01-22 |
RadNet’s grades consistently favor buy and strong buy ratings, demonstrating strong positive sentiment among analysts.
Which company has the best grades?
RadNet, Inc. has received generally stronger grades, with numerous buy and strong buy recommendations, compared to Quest Diagnostics’ predominantly hold and neutral ratings. This suggests RadNet may be viewed as having higher growth potential or better market positioning by analysts, potentially impacting investors’ confidence differently.
Strengths and Weaknesses
Below is a comparative overview of key strengths and weaknesses for Quest Diagnostics Incorporated (DGX) and RadNet, Inc. (RDNT) based on the most recent financial and operational data.
| Criterion | Quest Diagnostics Incorporated (DGX) | RadNet, Inc. (RDNT) |
|---|---|---|
| Diversification | Focused mainly on Diagnostic Information Services with limited segment diversification but stable revenue streams (~$9.6B in 2024). | More diversified revenue sources including Capitation, Commercial Insurance, Medicare, Medicaid, and other healthcare services. |
| Profitability | Moderate profitability with net margin ~8.8%, ROE ~12.9%, ROIC ~7.0%; slightly favorable WACC (5.7%). | Very low profitability; net margin near 0.15%, ROE 0.31%, ROIC 3.14%; high WACC at 8.8%, indicating inefficiency. |
| Innovation | Moderate innovation, steady diagnostic services but ROIC declining over recent years (-42%). | Innovation is limited; ROIC improving (+31.5%) but still below cost of capital, indicating ongoing value destruction. |
| Global presence | Primarily U.S.-focused diagnostic services with strong brand recognition. | Mainly U.S.-based with regional healthcare imaging and services; less global reach. |
| Market Share | Leader in diagnostic testing with consistent revenue growth in core segment. | Smaller market share with modest revenue growth; fragmented healthcare service market. |
Key takeaways: Quest Diagnostics shows stable core business profitability with slightly unfavorable declining returns on capital, while RadNet is more diversified but struggles with profitability and value creation despite recent ROIC improvement. Risk-conscious investors should weigh DGX’s stability against RDNT’s growth potential tempered by financial weaknesses.
Risk Analysis
Below is a comparative risk overview of Quest Diagnostics Incorporated (DGX) and RadNet, Inc. (RDNT) based on their most recent financial and operational data for 2024.
| Metric | Quest Diagnostics (DGX) | RadNet, Inc. (RDNT) |
|---|---|---|
| Market Risk | Beta 0.64 (lower volatility) | Beta 1.505 (higher volatility) |
| Debt Level | Debt to Equity 1.05 (unfavorable) | Debt to Equity 1.92 (very unfavorable) |
| Regulatory Risk | Moderate (healthcare industry) | Moderate (healthcare industry) |
| Operational Risk | Large network, 55K employees, stable operations | Smaller scale, 11K employees, higher operational leverage |
| Environmental Risk | Standard healthcare compliance | Standard healthcare compliance |
| Geopolitical Risk | Low (primarily US operations) | Low (primarily US operations) |
The most significant risks are RadNet’s high debt level and operational leverage, which coupled with its weak profitability and financial distress signals, pose considerable financial risk. Quest Diagnostics shows a more stable risk profile, with moderate debt and lower market volatility, making it comparatively less risky for investors.
Which Stock to Choose?
Quest Diagnostics Incorporated (DGX) shows stable income evolution with a favorable gross and EBIT margin, though net margin growth is negative overall. Its financial ratios are mostly neutral to slightly favorable, with moderate profitability and a somewhat high debt level. The rating is very favorable with strong equity and asset returns but a weak debt-to-equity score.
RadNet, Inc. (RDNT) demonstrates strong revenue and net income growth overall, but profitability ratios remain very low and mostly unfavorable. It carries a higher debt burden and weaker interest coverage. Despite a very favorable rating label, its core financial scores are unfavorable, and liquidity ratios are favorable but overshadowed by financial risk.
Investors focused on financial stability and quality might find DGX’s balanced profitability and solid rating more appealing, while those tolerant of higher risk and seeking growth could interpret RDNT’s rapid income growth and bullish price trend as potential opportunities, despite its weaker profitability and higher leverage.
Disclaimer: Investment carries a risk of loss of initial capital. The past performance is not a reliable indicator of future results. Be sure to understand risks before making an investment decision.
Go Further
I encourage you to read the complete analyses of Quest Diagnostics Incorporated and RadNet, Inc. to enhance your investment decisions: