In the fast-evolving semiconductor industry, QUALCOMM Incorporated and Tower Semiconductor Ltd. stand out as influential players with distinct yet overlapping market roles. QUALCOMM leads in wireless technology innovation and licensing, while Tower excels as a specialized foundry serving diverse analog and mixed-signal applications. Comparing these companies reveals insights into their strategic approaches and growth potential. Join me as we explore which stock could be the smarter choice for your investment portfolio in 2026.

Table of contents
Companies Overview
I will begin the comparison between QUALCOMM and Tower Semiconductor by providing an overview of these two companies and their main differences.
QUALCOMM Overview
QUALCOMM Incorporated focuses on developing and commercializing foundational wireless technologies globally. Operating through three segments, it supplies integrated circuits and system software for wireless communications and licenses intellectual property related to 3G, 4G, and 5G standards. The company also invests in early-stage tech ventures, supporting innovations across various industries. QUALCOMM is headquartered in San Diego, CA, and employs approximately 49,000 people.
Tower Semiconductor Overview
Tower Semiconductor Ltd. is an independent foundry manufacturing analog intensive mixed-signal semiconductor devices. It provides customizable process technologies and wafer fabrication services for various markets, including consumer electronics, automotive, aerospace, and medical devices. Headquartered in Migdal Haemek, Israel, Tower Semiconductor employs around 5,613 people and serves integrated device manufacturers and fabless companies internationally.
Key similarities and differences
Both QUALCOMM and Tower Semiconductor operate within the semiconductor industry, focusing on technology innovation and manufacturing. QUALCOMM emphasizes wireless communication technologies and intellectual property licensing, while Tower specializes in foundry services and analog mixed-signal semiconductor fabrication. QUALCOMM’s business model integrates development, licensing, and strategic investments, contrasting with Tower’s focus on manufacturing processes and design enablement platforms.
Income Statement Comparison
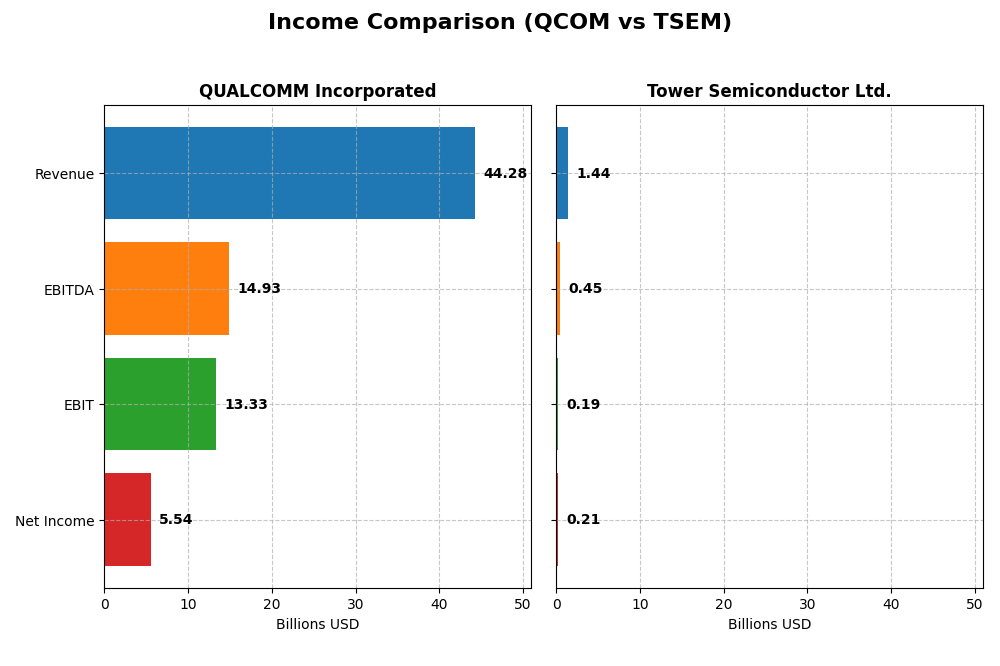
Below is a comparison of key income statement metrics for QUALCOMM Incorporated and Tower Semiconductor Ltd. for their most recent fiscal years.
| Metric | QUALCOMM Incorporated | Tower Semiconductor Ltd. |
|---|---|---|
| Market Cap | 175.4B | 14.3B |
| Revenue | 44.3B | 1.44B |
| EBITDA | 14.9B | 451M |
| EBIT | 13.3B | 185M |
| Net Income | 5.54B | 208M |
| EPS | 5.06 | 1.87 |
| Fiscal Year | 2025 | 2024 |
Income Statement Interpretations
QUALCOMM Incorporated
QUALCOMM’s revenue increased steadily from $33.6B in 2021 to $44.3B in 2025, with a gross margin consistently above 55%. However, net income declined from $9.0B in 2021 to $5.5B in 2025, reflecting a weakening net margin. The most recent year showed a 13.7% revenue rise and margin stability, but net income and EPS fell sharply, indicating margin compression.
Tower Semiconductor Ltd.
Tower Semiconductor’s revenue grew modestly from $1.27B in 2020 to $1.44B in 2024, with gross margins around 24%. Net income rose significantly overall, from $82M to $208M, supporting improved net margins. Yet, the latest year saw flat revenue and a sharp net income drop by 60%, highlighting recent operational challenges and margin declines despite long-term growth.
Which one has the stronger fundamentals?
QUALCOMM exhibits stronger scale, higher margins, and solid revenue growth but faces net income contraction and margin pressure recently. Tower Semiconductor shows smaller scale with lower margins but impressive net income and margin growth over the period, offset by recent declines. Both have favorable evaluations, though QUALCOMM’s size and margin leadership contrast with Tower’s volatility.
Financial Ratios Comparison
The following table presents the most recent financial ratios for QUALCOMM Incorporated (QCOM) and Tower Semiconductor Ltd. (TSEM) based on their fiscal year 2025 and 2024 data respectively, providing a snapshot of profitability, liquidity, leverage, efficiency, and dividend metrics.
| Ratios | QUALCOMM Incorporated (2025) | Tower Semiconductor Ltd. (2024) |
|---|---|---|
| ROE | 26.1% | 7.8% |
| ROIC | 13.2% | 6.4% |
| P/E | 32.7 | 27.5 |
| P/B | 8.54 | 2.16 |
| Current Ratio | 2.82 | 6.18 |
| Quick Ratio | 2.10 | 5.23 |
| D/E | 0.70 | 0.07 |
| Debt-to-Assets | 29.5% | 5.9% |
| Interest Coverage | 18.6 | 32.6 |
| Asset Turnover | 0.88 | 0.47 |
| Fixed Asset Turnover | 9.44 | 1.11 |
| Payout ratio | 68.7% | 0% |
| Dividend yield | 2.10% | 0% |
Interpretation of the Ratios
QUALCOMM Incorporated
QUALCOMM displays mostly strong financial ratios, including favorable net margin at 12.51%, ROE at 26.13%, and ROIC at 13.19%, with solid liquidity reflected in a current ratio of 2.82. Concerns arise from high valuation multiples like PE of 32.7 and PB of 8.54, which appear unfavorable. The company offers a 2.1% dividend yield, supported by manageable payout levels and free cash flow coverage, with moderate risk from its buyback program.
Tower Semiconductor Ltd.
Tower Semiconductor shows a mixed ratio profile with a favorable net margin of 14.47% and strong interest coverage of 31.57. However, its ROE at 7.83% is weak, and asset turnover at 0.47 signals operational inefficiency. The very high current ratio of 6.18 is marked unfavorable, suggesting excess liquidity. The company does not pay dividends, likely due to prioritizing reinvestments and growth, without share buybacks indicated.
Which one has the best ratios?
QUALCOMM holds a clear advantage with a higher proportion of favorable ratios (64.29%) and robust profitability and liquidity metrics, despite some valuation concerns. Tower Semiconductor’s profile is less consistent, with significant unfavorable ratios (35.71%) and weaker returns on equity and asset use. Overall, QUALCOMM’s ratios present a more favorable financial standing in this comparison.
Strategic Positioning
This section compares the strategic positioning of QUALCOMM Incorporated and Tower Semiconductor Ltd., including market position, key segments, and exposure to technological disruption:
QUALCOMM Incorporated
- Leading global wireless technology developer; faces competition in semiconductors sector
- Key segments: Qualcomm CDMA Technologies (QCT), Technology Licensing (QTL), Strategic Initiatives (QSI)
- Invests in early-stage tech including 5G, AI, automotive, consumer, enterprise, cloud, and IoT
Tower Semiconductor Ltd.
- Independent semiconductor foundry with niche analog mixed-signal focus amid competitive foundry market
- Focus on analog intensive mixed-signal devices, wafer fabrication, and design enablement services
- Provides customizable process technologies such as SiGe, BiCMOS, RF CMOS, CMOS image sensors, and MEMS
QUALCOMM Incorporated vs Tower Semiconductor Ltd. Positioning
QUALCOMM shows a diversified strategic approach across integrated circuits, licensing, and investments, supporting broad wireless industry applications. Tower Semiconductor concentrates on analog mixed-signal foundry services, targeting specialized markets like automotive and industrial electronics. QUALCOMM’s scale contrasts with Tower’s focused niche.
Which has the best competitive advantage?
QUALCOMM demonstrates a slightly favorable moat by creating value despite a declining ROIC trend, indicating a sustainable competitive advantage. Tower Semiconductor’s slightly unfavorable moat reflects value destruction but improving profitability, signaling less established advantage.
Stock Comparison
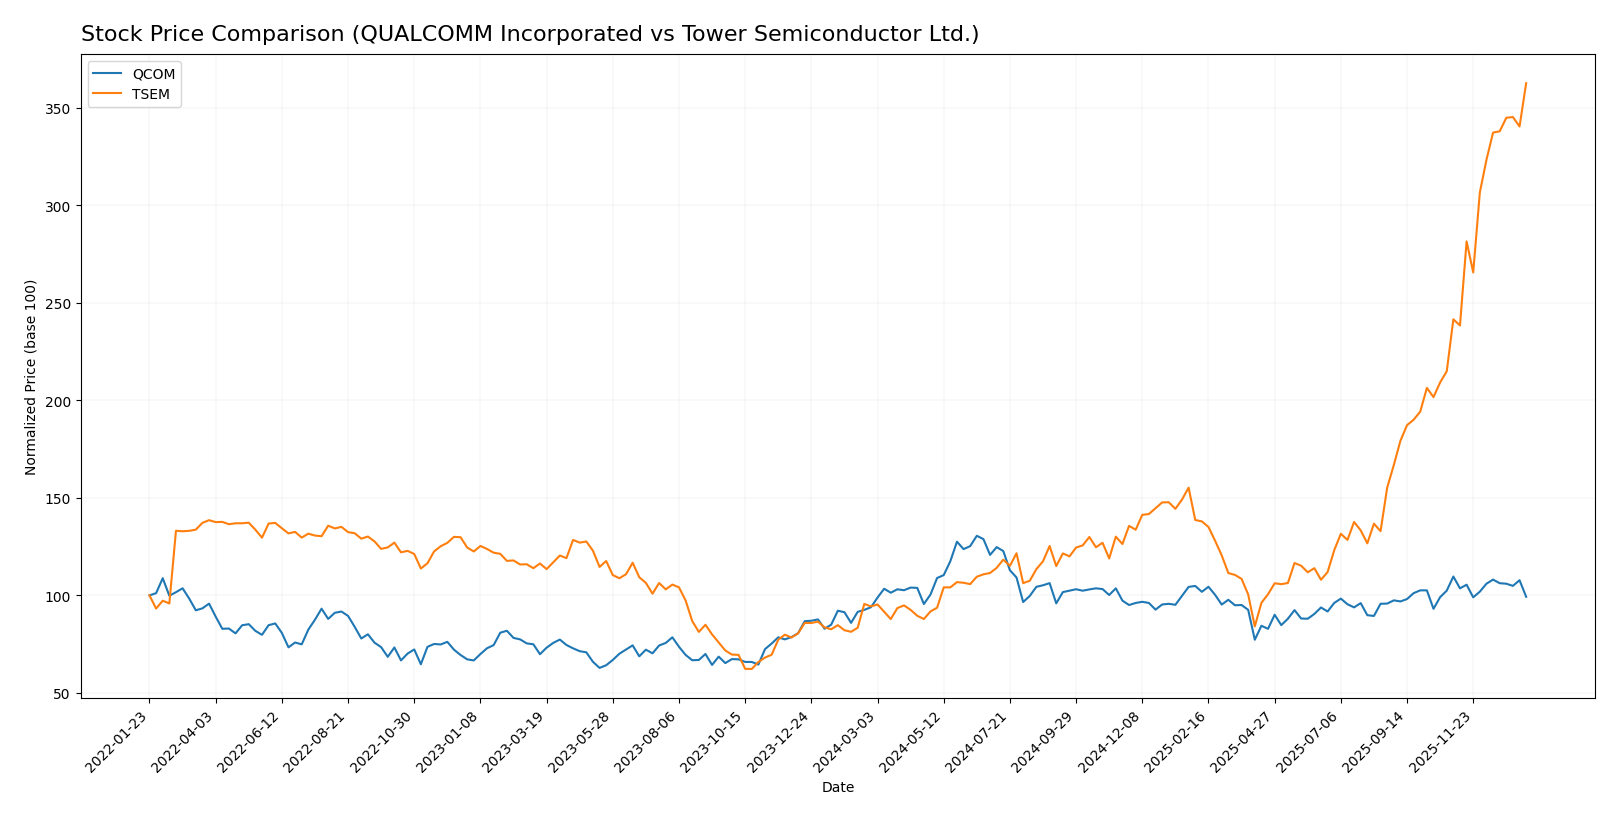
The stock price movements of QUALCOMM Incorporated and Tower Semiconductor Ltd. over the past 12 months reveal distinct bullish trends, with notable acceleration and contrasting recent period dynamics.
Trend Analysis
QUALCOMM Incorporated’s stock experienced a 5.71% increase over the past year, indicating a bullish trend with accelerating momentum, a high of 215.33, and a low of 127.46. Recent months show a slight deceleration with a -9.47% price drop.
Tower Semiconductor Ltd. posted a substantial 284.32% price gain over the last 12 months, reflecting a strong bullish trend with acceleration, a high of 127.86, and a low of 29.65. Recent activity confirms continued acceleration with a 50.13% rise.
Comparing both, Tower Semiconductor Ltd. has delivered significantly higher market performance than QUALCOMM Incorporated over the analyzed period.
Target Prices
The consensus target prices for QUALCOMM Incorporated and Tower Semiconductor Ltd. indicate analysts’ expectations for moderate to strong growth potential.
| Company | Target High | Target Low | Consensus |
|---|---|---|---|
| QUALCOMM Incorporated | 210 | 165 | 185.71 |
| Tower Semiconductor Ltd. | 125 | 66 | 96 |
Analysts expect QUALCOMM’s price to rise moderately above its current 163.73 USD, while Tower Semiconductor’s consensus target suggests a potential slight correction from its current 128.17 USD.
Analyst Opinions Comparison
This section compares analysts’ ratings and grades for QUALCOMM Incorporated and Tower Semiconductor Ltd.:
Rating Comparison
QUALCOMM Rating
- Rating: B+ indicating a very favorable outlook from analysts.
- Discounted Cash Flow Score: 4, reflecting a favorable assessment of future cash flows.
- ROE Score: 5, very favorable, indicating efficient profit generation from equity.
- ROA Score: 5, very favorable, showing excellent asset utilization.
- Debt To Equity Score: 1, very unfavorable, indicating high financial risk.
- Overall Score: 3, moderate overall financial standing.
Tower Semiconductor Rating
- Rating: B+ also indicating a very favorable analyst outlook.
- Discounted Cash Flow Score: 3, showing a moderate view on future cash flows.
- ROE Score: 3, moderate, indicating average efficiency in using shareholders’ equity.
- ROA Score: 4, favorable, demonstrating good asset use to generate earnings.
- Debt To Equity Score: 4, favorable, reflecting lower financial risk and stronger balance sheet.
- Overall Score: 3, also moderate overall financial standing.
Which one is the best rated?
Both QUALCOMM and Tower Semiconductor have the same overall rating of B+ and an identical overall score of 3, reflecting moderate financial standing. QUALCOMM scores higher on ROE and ROA but has weaker debt management, while Tower Semiconductor shows better debt-to-equity health.
Scores Comparison
The following table presents a comparison of the Altman Z-Score and Piotroski Score for QUALCOMM and Tower Semiconductor:
QUALCOMM Scores
- Altman Z-Score: 6.37, indicating a safe zone with low bankruptcy risk.
- Piotroski Score: 7, classified as strong financial health.
Tower Semiconductor Scores
- Altman Z-Score: 20.26, indicating a safe zone with very low bankruptcy risk.
- Piotroski Score: 7, classified as strong financial health.
Which company has the best scores?
Tower Semiconductor has a significantly higher Altman Z-Score than QUALCOMM, indicating lower bankruptcy risk. Both companies share the same strong Piotroski Score of 7, reflecting comparable financial strength.
Grades Comparison
The following presents a comparison of recent grades from established grading companies for QUALCOMM Incorporated and Tower Semiconductor Ltd.:
QUALCOMM Incorporated Grades
This table summarizes recent grades assigned to QUALCOMM by recognized grading companies.
| Grading Company | Action | New Grade | Date |
|---|---|---|---|
| Mizuho | Downgrade | Neutral | 2026-01-09 |
| Rosenblatt | Maintain | Buy | 2025-11-06 |
| B of A Securities | Maintain | Buy | 2025-11-06 |
| Mizuho | Maintain | Outperform | 2025-11-06 |
| Wells Fargo | Maintain | Underweight | 2025-11-06 |
| Piper Sandler | Maintain | Overweight | 2025-11-06 |
| UBS | Maintain | Neutral | 2025-11-06 |
| JP Morgan | Maintain | Overweight | 2025-11-04 |
| Citigroup | Maintain | Neutral | 2025-10-28 |
| Rosenblatt | Maintain | Buy | 2025-10-28 |
QUALCOMM’s grades exhibit a mixed but generally positive consensus, with multiple buy and outperform ratings alongside some neutral and underweight assessments.
Tower Semiconductor Ltd. Grades
Below is the summary of recent grades from established grading companies for Tower Semiconductor.
| Grading Company | Action | New Grade | Date |
|---|---|---|---|
| Benchmark | Maintain | Buy | 2026-01-09 |
| Wedbush | Downgrade | Neutral | 2025-12-31 |
| Benchmark | Maintain | Buy | 2025-11-11 |
| Susquehanna | Maintain | Positive | 2025-11-11 |
| Wedbush | Maintain | Outperform | 2025-11-11 |
| Barclays | Maintain | Equal Weight | 2025-11-11 |
| Benchmark | Maintain | Buy | 2025-09-08 |
| Susquehanna | Maintain | Positive | 2025-08-05 |
| Benchmark | Maintain | Buy | 2025-08-05 |
| Benchmark | Maintain | Buy | 2025-08-04 |
Tower Semiconductor shows a strong buy consensus with stable buy and positive ratings, despite a recent downgrade by Wedbush to neutral.
Which company has the best grades?
Both QUALCOMM and Tower Semiconductor have a consensus rating of “Buy,” but QUALCOMM displays more diversity in grades including outperform and overweight ratings, while Tower Semiconductor maintains more consistent buy and positive grades. This variation could affect investors’ perceptions of stability versus potential upside in each stock.
Strengths and Weaknesses
Below is a comparison of key strengths and weaknesses for QUALCOMM Incorporated (QCOM) and Tower Semiconductor Ltd. (TSEM) based on recent financial and operational data.
| Criterion | QUALCOMM Incorporated (QCOM) | Tower Semiconductor Ltd. (TSEM) |
|---|---|---|
| Diversification | Strong product segmentation with dominant QCT segment generating $38.4B in 2025 | Less diversified, focused on semiconductor manufacturing |
| Profitability | High net margin (12.5%) and ROE (26.1%), creating value but with declining ROIC trend | Moderate net margin (14.5%), lower ROE (7.8%), shedding value but ROIC improving |
| Innovation | Significant R&D investment sustaining competitive edge in wireless tech | Moderate innovation, improving efficiency but less market-leading |
| Global presence | Extensive global footprint supporting diverse markets | More regional focus, smaller scale internationally |
| Market Share | Large market share in mobile chipset and licensing | Smaller market share, niche player in specialty semiconductors |
QUALCOMM shows strong profitability and diversified revenue streams but faces a declining trend in ROIC suggesting caution. Tower Semiconductor, while less profitable overall, demonstrates improving capital efficiency and growth potential. Investors should weigh QCOM’s established dominance against TSEM’s growth trajectory and risk profile.
Risk Analysis
Below is a comparative table highlighting key risks for QUALCOMM Incorporated and Tower Semiconductor Ltd. based on their latest financial and market data.
| Metric | QUALCOMM Incorporated (QCOM) | Tower Semiconductor Ltd. (TSEM) |
|---|---|---|
| Market Risk | Beta 1.21 indicates moderate market volatility exposure | Beta 0.88 shows below-market volatility, lower market risk |
| Debt Level | Debt/Equity 0.7 (neutral); Debt to Assets 29.54% (favorable) | Debt/Equity 0.07 (favorable); Debt to Assets 5.87% (favorable) |
| Regulatory Risk | High due to IP licensing disputes and government contracts | Moderate, with exposure to multiple international markets |
| Operational Risk | High complexity in 5G tech development; strong innovation needed | Moderate, dependent on foundry process technology and client demand |
| Environmental Risk | Moderate, semiconductor manufacturing impacts and energy usage | Moderate, with focus on analog and mixed-signal fabs |
| Geopolitical Risk | Elevated, US-China tech tensions affect supply chain and sales | Elevated, operating from Israel with exposure to global trade issues |
QUALCOMM’s higher debt ratio and significant regulatory challenges related to IP licensing and U.S. government contracts are the most impactful risks. Tower Semiconductor benefits from low leverage but faces geopolitical risks due to its international footprint. Both companies maintain financial stability with Altman Z-Scores indicating low bankruptcy risk. Market volatility remains a moderate threat for QUALCOMM, while Tower’s lower beta suggests some resilience.
Which Stock to Choose?
QUALCOMM Incorporated (QCOM) shows a favorable income evolution with 13.66% revenue growth in 2025, strong profitability, and a solid financial ratio profile including a 26.13% ROE and 12.51% net margin. Its debt level is moderate with a net debt to EBITDA of 0.62, and the overall rating is very favorable (B+).
Tower Semiconductor Ltd. (TSEM) presents a slightly favorable global financial ratio evaluation with a 14.47% net margin but lower profitability metrics, including a 7.83% ROE. Its debt is low (debt-to-equity 0.07), and despite some unfavorable one-year income growth, it holds a very favorable rating (B+) and a slightly unfavorable moat status.
Investors focused on stable profitability and strong returns might find QCOM’s robust income statement and financial ratios more appealing, while those with a tolerance for growth volatility could see TSEM’s improving profitability and accelerating stock trend as a potential opportunity.
Disclaimer: Investment carries a risk of loss of initial capital. The past performance is not a reliable indicator of future results. Be sure to understand risks before making an investment decision.
Go Further
I encourage you to read the complete analyses of QUALCOMM Incorporated and Tower Semiconductor Ltd. to enhance your investment decisions: