Home > Comparison > Technology > QCOM vs TXN
The strategic rivalry between QUALCOMM Incorporated and Texas Instruments Incorporated shapes the semiconductor sector’s evolution. QUALCOMM excels as an innovation-driven wireless technology leader, while Texas Instruments operates as a diversified semiconductor manufacturer focused on analog and embedded processing. This head-to-head contrasts cutting-edge connectivity solutions against broad industrial applications. This analysis aims to identify which company offers a superior risk-adjusted trajectory for investors seeking balanced exposure to technology growth and stability.
Table of contents
Companies Overview
QUALCOMM and Texas Instruments both anchor the semiconductor industry with distinct market footprints and technology portfolios.
QUALCOMM Incorporated: Wireless Technology Pioneer
QUALCOMM dominates wireless technology by developing integrated circuits and system software for 3G/4G/5G communications. Its revenue engine hinges on licensing a vast intellectual property portfolio and supplying chips for mobile and IoT devices. In 2026, QUALCOMM doubled down on advancing 5G and artificial intelligence through strategic investments and government contracts, reinforcing its technology leadership.
Texas Instruments Incorporated: Analog & Embedded Powerhouse
Texas Instruments specializes in analog and embedded processing semiconductors that power industrial, automotive, and personal electronics. It generates revenue by selling power management chips, microcontrollers, and signal processors globally via direct sales and distributors. In 2026, TI focused on expanding its analog product lines to meet rising demand in energy-efficient and automotive applications.
Strategic Collision: Similarities & Divergences
Both firms operate in semiconductors but follow contrasting philosophies: QUALCOMM leverages a licensing-heavy model emphasizing wireless innovation, while Texas Instruments centers on broad analog and embedded hardware sales. Their primary battleground is in emerging IoT and automotive markets where connectivity and power efficiency intersect. Investors face distinct profiles—QUALCOMM as a high-beta growth play, Texas Instruments as a stable dividend-paying industrial stalwart.
Income Statement Comparison
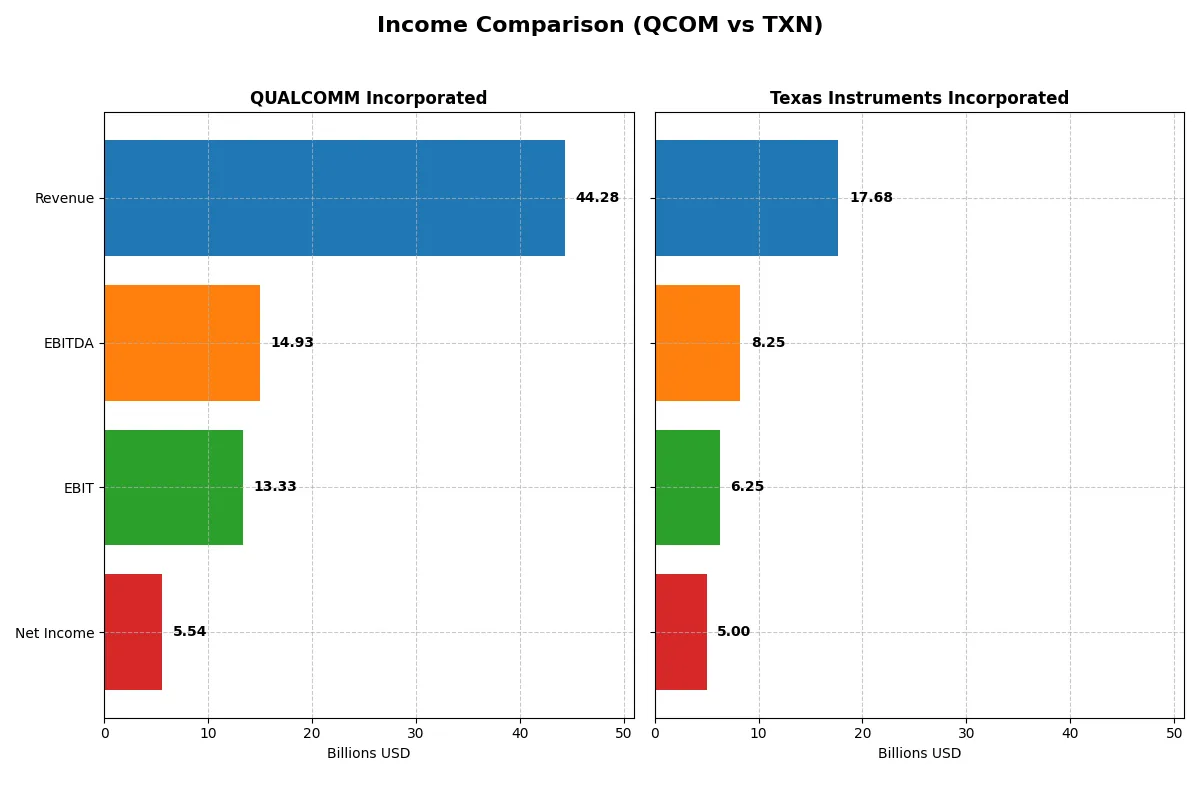
This data dissects the core profitability and scalability of both corporate engines to reveal who dominates the bottom line:
| Metric | QUALCOMM Incorporated (QCOM) | Texas Instruments Incorporated (TXN) |
|---|---|---|
| Revenue | 44.3B | 17.7B |
| Cost of Revenue | 19.7B | 7.6B |
| Operating Expenses | 12.2B | 4.1B |
| Gross Profit | 24.5B | 10.1B |
| EBITDA | 14.9B | 8.3B |
| EBIT | 13.3B | 6.3B |
| Interest Expense | 664M | 543M |
| Net Income | 5.5B | 5.0B |
| EPS | 5.06 | 5.45 |
| Fiscal Year | 2025 | 2025 |
Income Statement Analysis: The Bottom-Line Duel
This income statement comparison reveals the true efficiency and financial momentum powering each company’s engine over recent years.
QUALCOMM Incorporated Analysis
QUALCOMM’s revenue climbed steadily from $33.6B in 2021 to $44.3B in 2025, reflecting a strong 31.9% growth over five years. Gross margin held favorably at 55.4%, while EBIT margin advanced to 30.1%. Despite revenue and EBIT growth, net income declined sharply in 2025 to $5.5B, halving the previous year’s figure, signaling margin pressures or tax burdens affecting bottom-line profits.
Texas Instruments Incorporated Analysis
Texas Instruments posted more modest revenue growth, peaking at $20B in 2022 before dipping to $17.7B in 2025, marking a slight overall decline. The company sustains a higher gross margin of 57% and an EBIT margin of 35.4%, exhibiting operational efficiency. Net income stood at $5B in 2025, with a healthier net margin of 28.3%, though growth has been uneven and net income dropped 35.6% over five years.
Margin Strength vs. Revenue Expansion
QUALCOMM leads in revenue scale and EBIT growth, but its net income and margins weakened notably in 2025. Texas Instruments delivers superior margin quality and more stable net profitability despite slower revenue growth. For investors prioritizing margin resilience and consistent earnings, Texas Instruments’ profile appears more attractive than QUALCOMM’s revenue-driven yet volatile earnings.
Financial Ratios Comparison
These vital ratios act as a diagnostic tool to expose the underlying fiscal health, valuation premiums, and capital efficiency of the companies analyzed:
| Ratios | QUALCOMM Incorporated (QCOM) | Texas Instruments Incorporated (TXN) |
|---|---|---|
| ROE | 26.1% | 30.7% |
| ROIC | 13.2% | 16.5% |
| P/E | 32.7 | 31.5 |
| P/B | 8.54 | 9.69 |
| Current Ratio | 2.82 | 4.35 |
| Quick Ratio | 2.10 | 2.83 |
| D/E | 0.70 | 0.86 |
| Debt-to-Assets | 29.5% | 40.6% |
| Interest Coverage | 18.6 | 11.1 |
| Asset Turnover | 0.88 | 0.51 |
| Fixed Asset Turnover | 9.44 | 1.44 |
| Payout ratio | 68.7% | 100.0% |
| Dividend yield | 2.10% | 3.17% |
| Fiscal Year | 2025 | 2025 |
Efficiency & Valuation Duel: The Vital Signs
Financial ratios act as a company’s DNA, revealing hidden risks and operational strengths that numbers alone cannot show.
QUALCOMM Incorporated
QUALCOMM displays a solid ROE of 26.13% and a net margin of 12.51%, signaling efficient profitability. However, its P/E of 32.7 and P/B of 8.54 mark it as somewhat expensive. The company returns value through a 2.1% dividend yield, balancing shareholder payouts with reinvestment in R&D for growth.
Texas Instruments Incorporated
Texas Instruments boasts a higher net margin at 28.28% and a ROE of 30.73%, reflecting superior profitability. Its P/E stands at 31.53, slightly lower than QUALCOMM’s, yet the P/B ratio at 9.69 suggests a stretched valuation. The 3.17% dividend yield highlights a strong commitment to shareholder returns amid moderate reinvestment.
Premium Valuation vs. Operational Safety
Texas Instruments offers stronger profitability but carries a more stretched valuation and lower asset turnover. QUALCOMM balances efficiency with a more favorable liquidity position and a solid dividend. Investors seeking operational safety might prefer QUALCOMM, while those prioritizing higher margins and dividends might lean toward Texas Instruments.
Which one offers the Superior Shareholder Reward?
I compare QUALCOMM and Texas Instruments’ dividend yields and payout ratios. QUALCOMM yields 2.1% with a moderate 69% payout, backed by strong free cash flow (FCF) coverage at 2.8x, signaling dividend sustainability. Texas Instruments yields higher at 3.17% but pays nearly 100% of its FCF, risking payout pressure. QUALCOMM’s significant buybacks complement its dividend, enhancing total return. Texas Instruments’ buyback intensity is lower, relying more on dividends. I see QUALCOMM’s balanced distribution and buyback blend as more sustainable, offering a superior total return profile for 2026 investors.
Comparative Score Analysis: The Strategic Profile
The radar chart reveals the fundamental DNA and trade-offs of QUALCOMM and Texas Instruments, highlighting their distinct financial strengths and vulnerabilities:
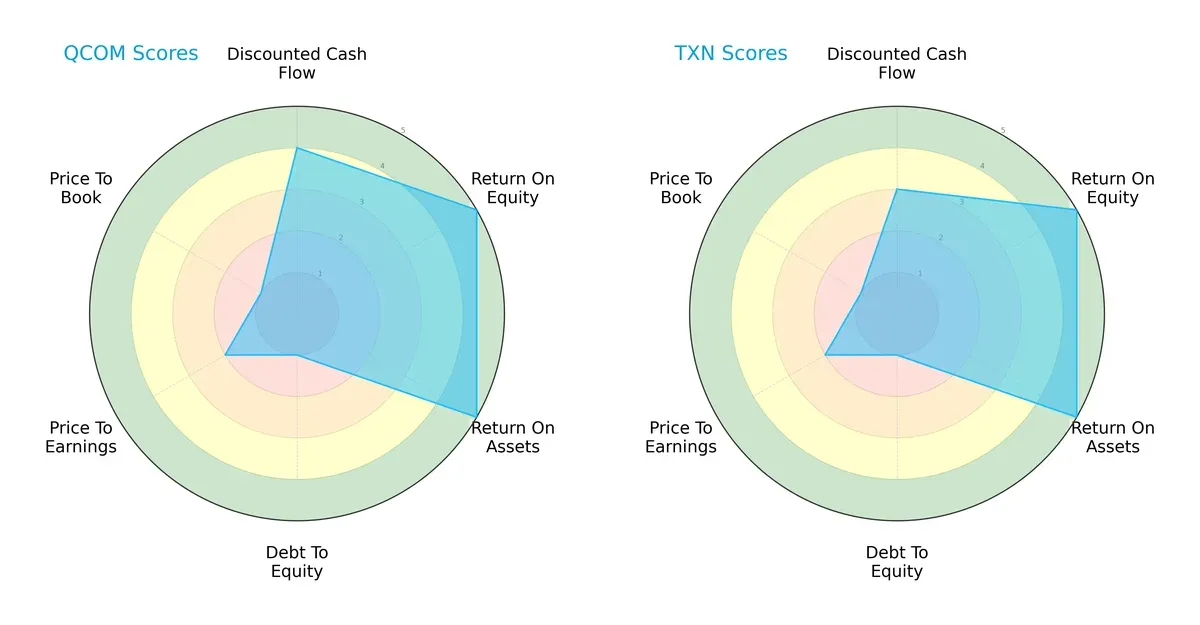
QUALCOMM edges Texas Instruments with a stronger discounted cash flow (DCF) score (4 vs. 3), while both share top marks in return on equity (ROE) and return on assets (ROA) at 5 each. However, both firms carry a significant debt burden, reflected in equally low debt-to-equity scores (1). Valuation metrics (PE and PB) remain moderate to unfavorable for both, suggesting market skepticism or premium pricing. QUALCOMM’s higher DCF score hints at greater cash flow potential, yet Texas Instruments presents a more balanced risk-return profile without overreliance on a single financial strength.
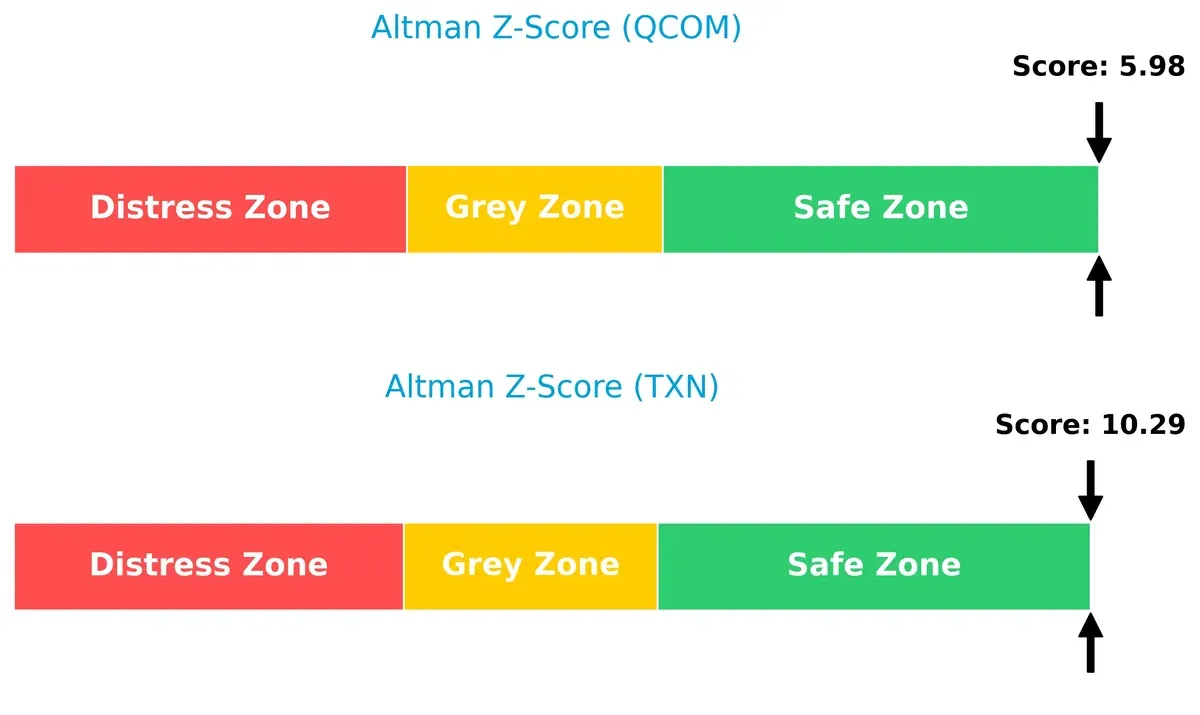
Bankruptcy Risk: Solvency Showdown
The Altman Z-Score gap favors Texas Instruments significantly, indicating a lower bankruptcy risk and stronger solvency for long-term survival in a volatile cycle:
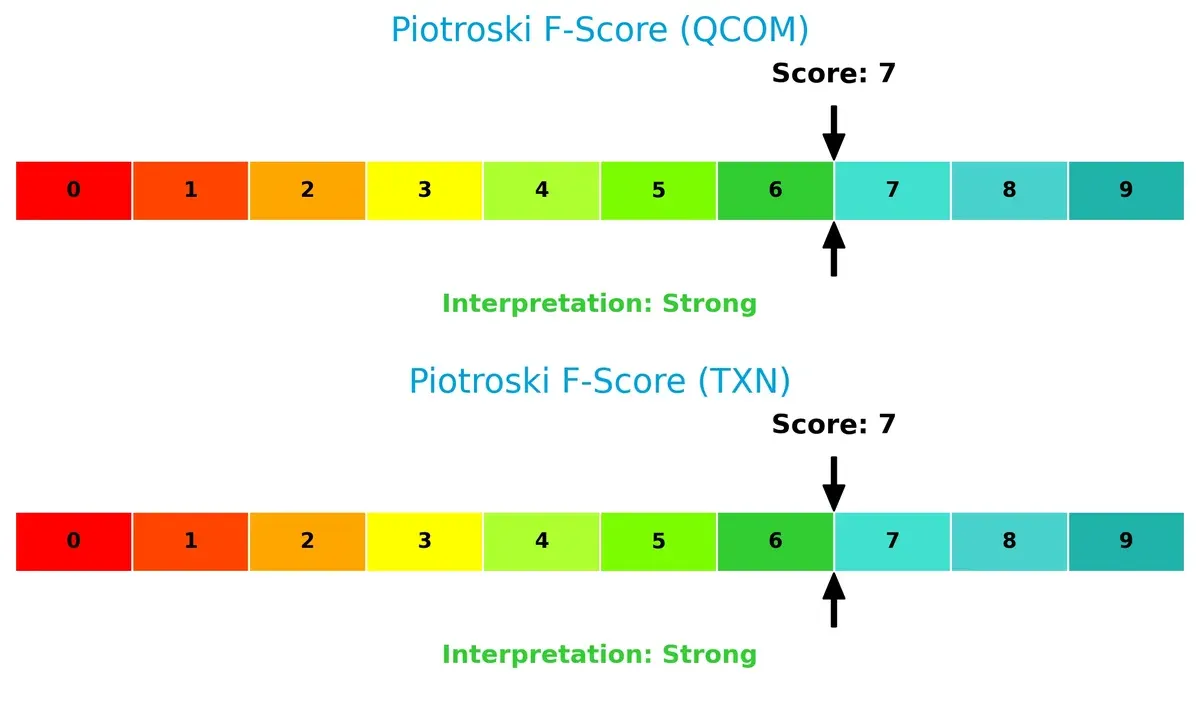
Financial Health: Quality of Operations
Both QUALCOMM and Texas Instruments score a robust 7 on the Piotroski F-Score, signaling strong internal financial health with no immediate red flags detected in operational quality:
How are the two companies positioned?
This section dissects QUALCOMM and Texas Instruments’ operational DNA by comparing revenue distribution and internal strengths and weaknesses. It aims to confront their economic moats to identify the most resilient competitive advantage today.
Revenue Segmentation: The Strategic Mix
This visual comparison dissects how QUALCOMM and Texas Instruments diversify their income streams and where their primary sector bets lie:
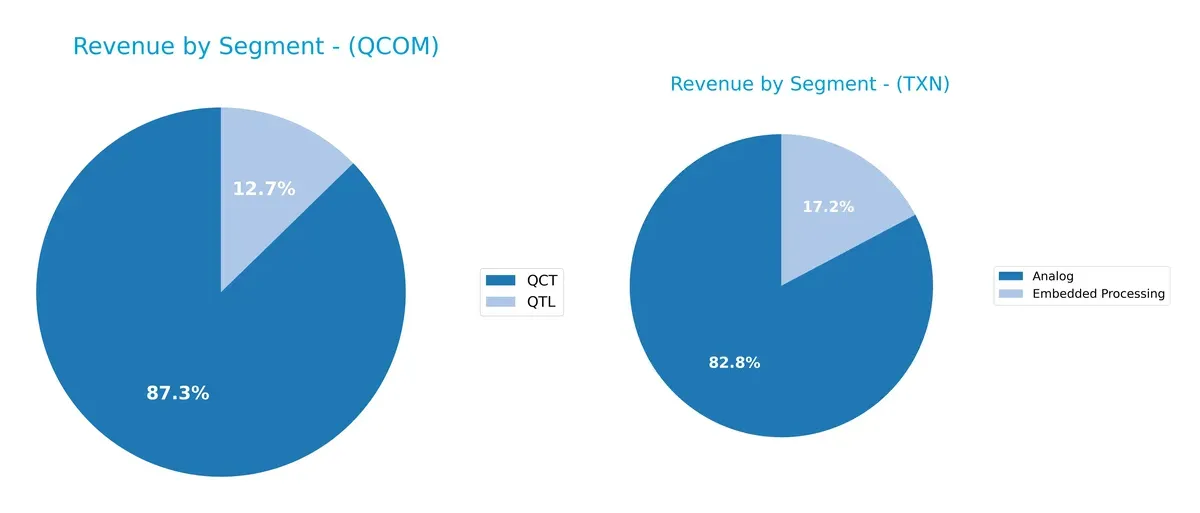
QUALCOMM anchors its revenue heavily in QCT, with $38.4B in 2025, dwarfing QTL at $5.6B. This concentration signals reliance on chipset dominance and ecosystem lock-in. Texas Instruments presents a more balanced mix, with Analog at $12.2B and Embedded Processing at $2.5B, reflecting diverse industrial and consumer electronics exposure. TI’s broader base reduces concentration risk, while QUALCOMM pivots on high-margin mobile technology.
Strengths and Weaknesses Comparison
This table compares the Strengths and Weaknesses of QUALCOMM and Texas Instruments:
QUALCOMM Strengths
- Strong profitability with 12.5% net margin and 26.1% ROE
- Favorable liquidity ratios: current 2.82, quick 2.1
- Low debt to assets at 29.5% and high interest coverage
- High fixed asset turnover (9.44) indicating efficient asset use
- Diversified revenue streams from QCT and QTL segments
- Significant global presence with major sales in China and Vietnam
Texas Instruments Strengths
- Superior profitability: 28.3% net margin and 30.7% ROE
- Strong ROIC of 16.5% above WACC
- Higher dividend yield at 3.17%
- Favorable quick ratio at 2.83 supports liquidity
- Broad geographic diversification including strong U.S. and Asia exposure
- Diversified revenue from Analog and Embedded Processing segments
QUALCOMM Weaknesses
- Elevated P/E (32.7) and P/B (8.54) ratios may pressure valuation
- Neutral debt-to-equity at 0.7 with some leverage risk
- Asset turnover is moderate (0.88), below sector leaders
- Heavy revenue dependence on China exposes geopolitical risk
- Limited diversification outside core QCT and QTL segments
Texas Instruments Weaknesses
- High P/B ratio at 9.69 and P/E at 31.5 may limit upside
- Unfavorable current ratio at 4.35 suggests excess short-term assets
- Higher debt to assets (40.6%) indicates increased leverage
- Asset turnover metrics below QUALCOMM at 0.51 fixed asset turnover low
- Less revenue concentration in emerging markets compared to competitors
Both companies show strong profitability and innovation-driven revenues. QUALCOMM’s strengths lie in its liquidity and asset efficiency, while Texas Instruments excels in margin and dividend yield. Each faces valuation and leverage risks that could affect strategic flexibility.
The Moat Duel: Analyzing Competitive Defensibility
A structural moat shields long-term profits from relentless competition erosion. Let’s dissect how QUALCOMM and Texas Instruments defend their turf:
QUALCOMM Incorporated: Intellectual Property Licensing Powerhouse
QUALCOMM’s moat stems from its vast patent portfolio and licensing model. This generates stable, high ROIC near 4%, sustaining premium margins despite profitability pressures. Emerging 5G and IoT products could deepen this moat but geopolitical risks loom in China.
Texas Instruments Incorporated: Analog Market Leadership with Cost Advantage
Texas Instruments relies on a cost advantage in analog semiconductors, delivering a superior ROIC above 8%. Its broad industrial and automotive exposure stabilizes margins. Expansion into embedded processing and power management may bolster its position amid slowing overall revenue growth.
Licensing Dominance vs. Cost Leadership in Semiconductors
Both firms create value with strong moats, but Texas Instruments’ wider ROIC spread signals a deeper moat. Its diversified end markets and cost efficiency better equip it to defend share against cyclical risks and technological shifts.
Which stock offers better returns?
Over the past year, Texas Instruments showed strong gains with accelerating momentum, while QUALCOMM faced a sustained decline and decelerating negative trend.
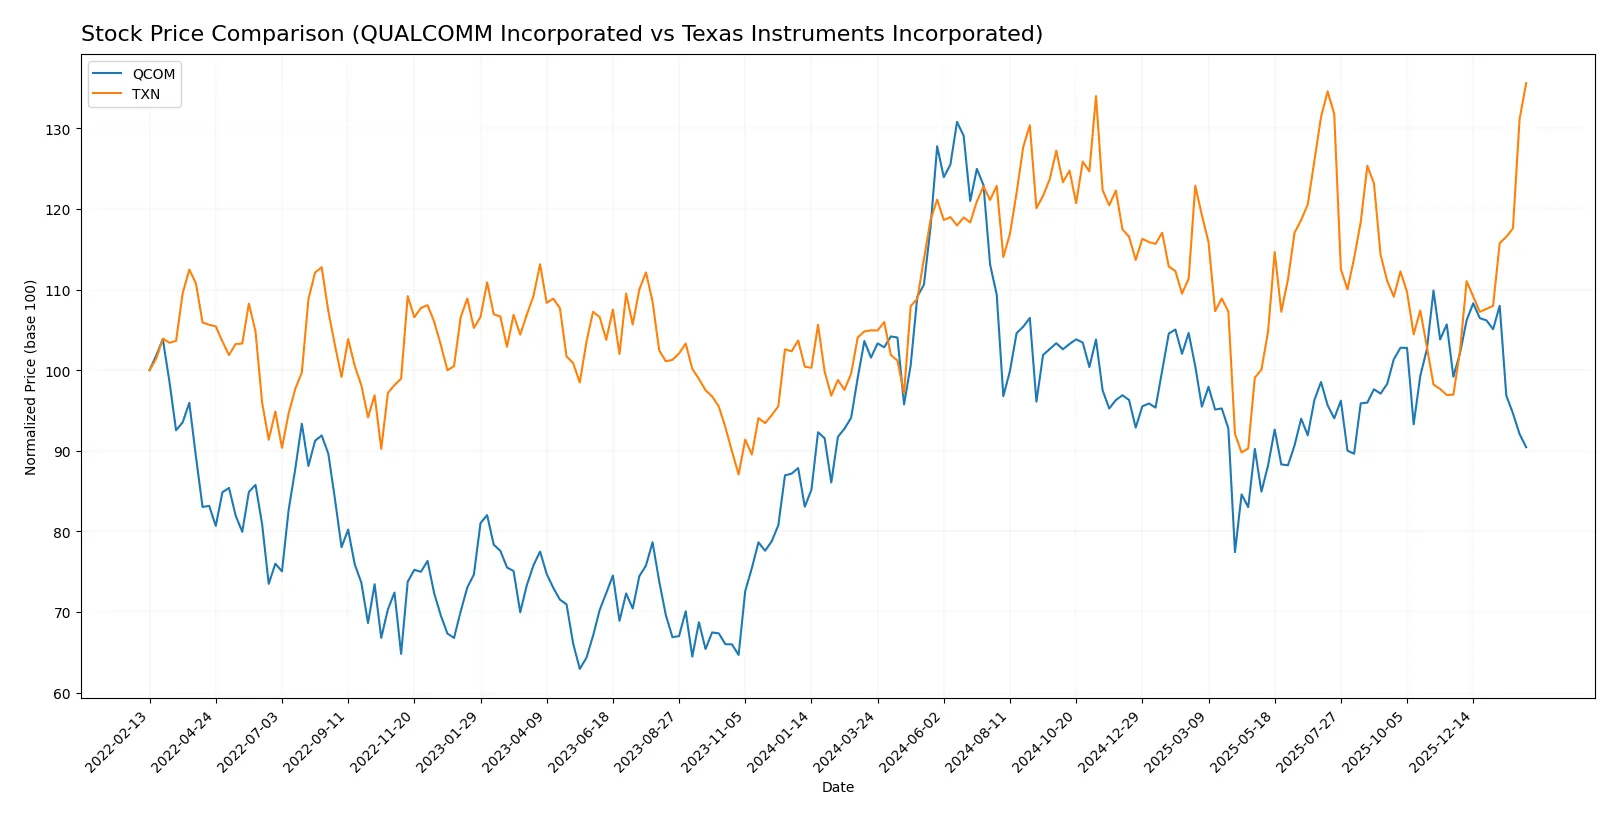
Trend Comparison
QUALCOMM’s stock fell 10.95% over 12 months, marking a bearish trend with deceleration. Its price ranged between 127.46 and 215.33, reflecting notable volatility (16.24% std deviation).
Texas Instruments gained 29.21% in the same period, establishing a bullish trend with acceleration. The price fluctuated from 147.6 to 222.92, exhibiting similar volatility (16.23% std deviation).
Texas Instruments outperformed QUALCOMM, delivering the highest market return and accelerating positive momentum over the past year.
Target Prices
Analysts present a moderately optimistic target consensus for these semiconductor leaders.
| Company | Target Low | Target High | Consensus |
|---|---|---|---|
| QUALCOMM Incorporated | 160 | 210 | 181.43 |
| Texas Instruments Incorporated | 160 | 260 | 204.64 |
The consensus targets exceed current prices: Qualcomm trades at $149, implying 22% upside; Texas Instruments at $223, indicating 8% potential gain. Analysts see room for appreciation amid sector dynamics.

Don’t Let Luck Decide Your Entry Point
Optimize your entry points with our advanced ProRealTime indicators. You’ll get efficient buy signals with precise price targets for maximum performance. Start outperforming now!
How do institutions grade them?
The following tables summarize recent institutional grades for QUALCOMM Incorporated and Texas Instruments Incorporated:
QUALCOMM Incorporated Grades
This table lists recent grades from reputable financial institutions for QUALCOMM:
| Grading Company | Action | New Grade | Date |
|---|---|---|---|
| Cantor Fitzgerald | Maintain | Neutral | 2026-02-02 |
| UBS | Maintain | Neutral | 2026-01-26 |
| Mizuho | Maintain | Neutral | 2026-01-26 |
| Mizuho | Downgrade | Neutral | 2026-01-09 |
| UBS | Maintain | Neutral | 2025-11-06 |
| Piper Sandler | Maintain | Overweight | 2025-11-06 |
| Wells Fargo | Maintain | Underweight | 2025-11-06 |
| Mizuho | Maintain | Outperform | 2025-11-06 |
| Rosenblatt | Maintain | Buy | 2025-11-06 |
| B of A Securities | Maintain | Buy | 2025-11-06 |
Texas Instruments Incorporated Grades
This table lists recent grades from reputable financial institutions for Texas Instruments:
| Grading Company | Action | New Grade | Date |
|---|---|---|---|
| Jefferies | Maintain | Hold | 2026-01-28 |
| Cantor Fitzgerald | Maintain | Neutral | 2026-01-28 |
| Goldman Sachs | Maintain | Sell | 2026-01-28 |
| Truist Securities | Maintain | Hold | 2026-01-28 |
| Deutsche Bank | Maintain | Hold | 2026-01-28 |
| Stifel | Maintain | Hold | 2026-01-28 |
| UBS | Maintain | Buy | 2026-01-28 |
| B of A Securities | Upgrade | Neutral | 2026-01-28 |
| Wells Fargo | Maintain | Equal Weight | 2026-01-28 |
| JP Morgan | Maintain | Overweight | 2026-01-28 |
Which company has the best grades?
QUALCOMM shows a broader range of positive grades including Buy and Outperform ratings. Texas Instruments carries more Hold and Neutral grades with one Sell rating. QUALCOMM’s stronger grades may imply better institutional confidence, affecting investor sentiment accordingly.
Risks specific to each company
The following categories identify the critical pressure points and systemic threats facing QUALCOMM Incorporated and Texas Instruments Incorporated in the 2026 market environment:
1. Market & Competition
QUALCOMM Incorporated
- Faces intense competition in wireless tech and licensing amid rapid 5G and AI adoption.
Texas Instruments Incorporated
- Competes in analog and embedded processing with slower growth but stable industrial demand.
2. Capital Structure & Debt
QUALCOMM Incorporated
- Moderate leverage (Debt/Equity 0.7), strong interest coverage (20x) supports stability.
Texas Instruments Incorporated
- Higher leverage (Debt/Equity 0.86), interest coverage of 11.5x poses moderate risk in downturns.
3. Stock Volatility
QUALCOMM Incorporated
- Beta of 1.24 indicates above-market volatility, sensitive to tech cycles.
Texas Instruments Incorporated
- Beta near 1.0 suggests market-level volatility, less sensitive to sector swings.
4. Regulatory & Legal
QUALCOMM Incorporated
- Licensing business exposed to patent disputes and antitrust scrutiny.
Texas Instruments Incorporated
- Faces regulatory risks mainly in manufacturing and export controls.
5. Supply Chain & Operations
QUALCOMM Incorporated
- Complex global supply chains vulnerable to semiconductor shortages and geopolitical tensions.
Texas Instruments Incorporated
- More vertically integrated with stable supply chain but exposed to raw material price risks.
6. ESG & Climate Transition
QUALCOMM Incorporated
- Growing pressure to improve sustainability in wireless tech production and licensing.
Texas Instruments Incorporated
- Focused on energy-efficient analog products but must enhance climate risk disclosures.
7. Geopolitical Exposure
QUALCOMM Incorporated
- Significant exposure to China-US tech tensions impacting licensing and component sales.
Texas Instruments Incorporated
- Also exposed to geopolitical risks but with a more diversified industrial customer base.
Which company shows a better risk-adjusted profile?
QUALCOMM’s primary risk lies in regulatory and market competition pressures linked to its licensing model and higher stock volatility. Texas Instruments faces greater capital structure risk and geopolitical supply chain challenges but benefits from more stable demand and lower beta. I view Texas Instruments as having a slightly better risk-adjusted profile. Its Altman Z-Score of 10.3 versus QUALCOMM’s 6.0 signals stronger financial resilience. Meanwhile, QUALCOMM’s elevated beta (1.24) and patent litigation risks justify caution despite robust profitability.
Final Verdict: Which stock to choose?
QUALCOMM’s superpower lies in its unmatched efficiency in converting invested capital into profits, supported by solid cash flow generation. Its declining profitability trend warrants vigilance, especially for those sensitive to earnings volatility. This profile suits investors focused on aggressive growth with a tolerance for cyclical swings.
Texas Instruments commands a strategic moat through its robust recurring revenue and strong operational stability, reflected in a more resilient balance sheet. While it offers less explosive growth than QUALCOMM, its steady cash generation and bullish price momentum fit investors seeking growth at a reasonable price with better defensive qualities.
If you prioritize dynamic growth potential and are comfortable with earnings variability, QUALCOMM outshines as a compelling choice due to its operational efficiency and cash machine status. However, if you seek better stability and a more consistent income profile, Texas Instruments offers superior safety and steady expansion, commanding a premium for risk-averse growth investors.
Disclaimer: Investment carries a risk of loss of initial capital. The past performance is not a reliable indicator of future results. Be sure to understand risks before making an investment decision.
Go Further
I encourage you to read the complete analyses of QUALCOMM Incorporated and Texas Instruments Incorporated to enhance your investment decisions: