Home > Comparison > Technology > QCOM vs TER
The strategic rivalry between QUALCOMM Incorporated and Teradyne, Inc. shapes the competitive landscape of the semiconductor sector. QUALCOMM operates as a technology innovator focused on wireless communications and intellectual property licensing. Teradyne, by contrast, specializes in automated test equipment and industrial automation. This analysis aims to identify which business model offers superior risk-adjusted returns amid evolving industry dynamics, guiding investors toward an optimal portfolio allocation.

Table of contents
Companies Overview
QUALCOMM Incorporated and Teradyne, Inc. both hold pivotal roles in the semiconductor industry, shaping the technology landscape through innovation and specialized expertise.
QUALCOMM Incorporated: Wireless Technology Pioneer
QUALCOMM dominates as a foundational player in wireless technology, generating revenue primarily through integrated circuits and licensing its extensive intellectual property portfolio. Its business model leverages patent licensing alongside chipset development for 3G/4G/5G communications. In 2026, QUALCOMM focuses strategically on expanding 5G applications, AI integration, and early-stage investments in emerging technologies to maintain its competitive edge.
Teradyne, Inc.: Automated Test Equipment Leader
Teradyne specializes in designing and manufacturing automatic test equipment for semiconductors and wireless devices. Its revenue stems from testing platforms that validate chips across automotive, industrial, and consumer electronics sectors. In 2026, Teradyne emphasizes growth in industrial automation and wireless test solutions, targeting advanced robotics and next-gen wireless device testing to capitalize on rising demand.
Strategic Collision: Similarities & Divergences
QUALCOMM and Teradyne share a commitment to semiconductor innovation but diverge sharply in approach—QUALCOMM focuses on IP licensing and chipset design, while Teradyne centers on testing and automation equipment. Their primary battleground lies in the evolution of 5G and IoT device ecosystems. Investors face distinct profiles: QUALCOMM offers broad tech exposure with licensing royalties; Teradyne provides niche industrial automation growth with cyclical semiconductor test demand.
Income Statement Comparison
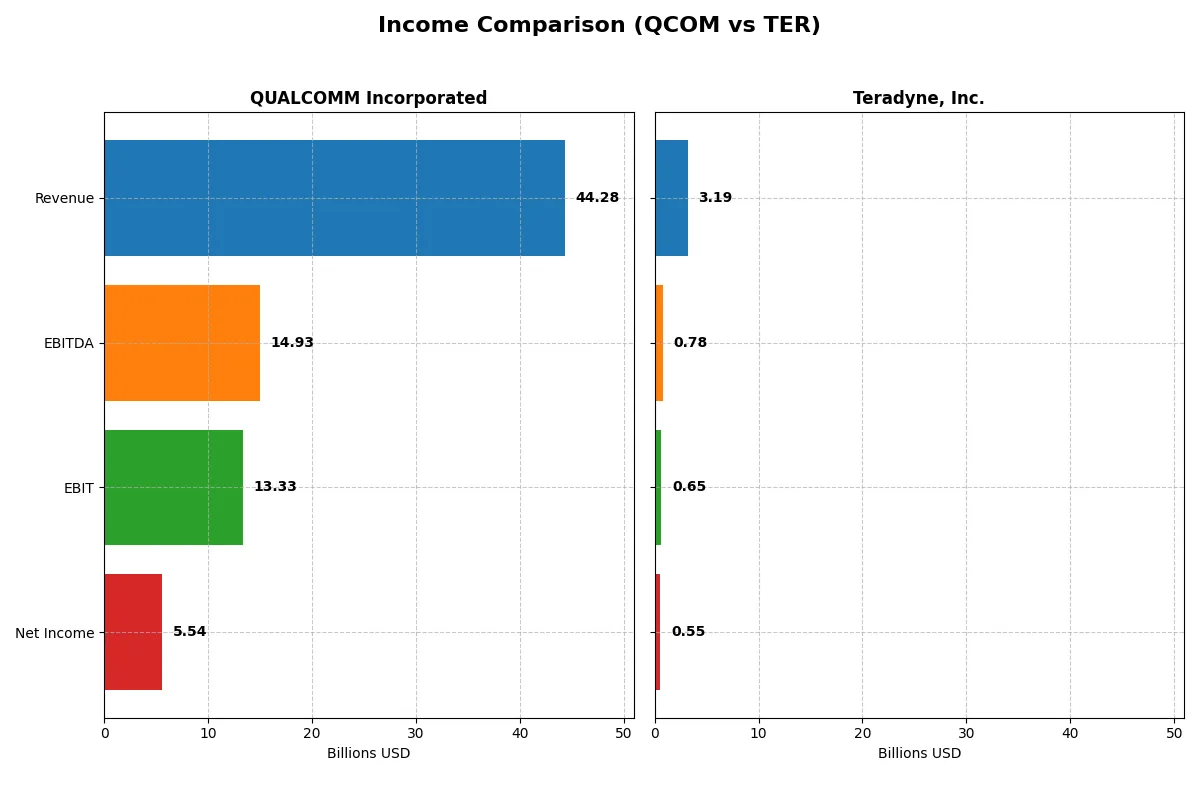
This data dissects the core profitability and scalability of both corporate engines to reveal who dominates the bottom line:
| Metric | QUALCOMM Incorporated (QCOM) | Teradyne, Inc. (TER) |
|---|---|---|
| Revenue | 44.3B | 3.19B |
| Cost of Revenue | 19.7B | 1.32B |
| Operating Expenses | 12.2B | 1.17B |
| Gross Profit | 24.5B | 1.87B |
| EBITDA | 14.9B | 780M |
| EBIT | 13.3B | 653M |
| Interest Expense | 664M | 8.0M |
| Net Income | 5.54B | 554M |
| EPS | 5.06 | 3.49 |
| Fiscal Year | 2025 | 2025 |
Income Statement Analysis: The Bottom-Line Duel
This income statement comparison reveals which company runs its business with superior efficiency and sustainable profit generation.
QUALCOMM Incorporated Analysis
QUALCOMM’s revenue climbs steadily to $44.3B in 2025, reflecting a 13.7% growth year-over-year. Gross margin holds strong at 55.4%, and EBIT margin outperforms at 30.1%, underscoring operational efficiency. However, net income dips sharply to $5.5B in 2025, halving from the previous year, signaling margin pressure despite solid top-line momentum.
Teradyne, Inc. Analysis
Teradyne posts $3.19B revenue in 2025, up 13.1% from 2024, with a robust gross margin of 58.6%, slightly superior to QUALCOMM’s. EBIT margin trails at 20.5%, but net margin remains healthier at 17.4%, delivering $554M net income. Despite slower EBIT growth, Teradyne sustains better bottom-line resilience and EPS growth on a smaller scale.
Margin Strength vs. Profit Scale
QUALCOMM shows dominant revenue scale and operational margins but suffers a steep net income decline. Teradyne delivers superior net margin and steadier earnings growth, albeit at a much smaller revenue base. For investors prioritizing margin stability and consistent profits, Teradyne’s profile appears more attractive, while QUALCOMM’s scale offers growth potential tempered by recent bottom-line volatility.
Financial Ratios Comparison
These vital ratios act as a diagnostic tool to expose the underlying fiscal health, valuation premiums, and capital efficiency of the companies compared below:
| Ratios | QUALCOMM Incorporated (QCOM) | Teradyne, Inc. (TER) |
|---|---|---|
| ROE | 26.13% | 19.82% |
| ROIC | 13.19% | 18.45% |
| P/E | 32.70 | 54.64 |
| P/B | 8.54 | 10.83 |
| Current Ratio | 2.82 | 1.76 |
| Quick Ratio | 2.10 | 1.41 |
| D/E | 0.70 | 0.12 |
| Debt-to-Assets | 29.54% | 8.32% |
| Interest Coverage | 18.61 | 86.44 |
| Asset Turnover | 0.88 | 0.76 |
| Fixed Asset Turnover | 9.44 | 4.99 |
| Payout Ratio | 68.67% | 13.77% |
| Dividend Yield | 2.10% | 0.25% |
| Fiscal Year | 2025 | 2025 |
Efficiency & Valuation Duel: The Vital Signs
Financial ratios act as a company’s DNA, revealing hidden risks and operational excellence that numbers alone cannot show.
QUALCOMM Incorporated
QUALCOMM delivers a robust 26.1% ROE and solid 12.5% net margin, demonstrating efficient profitability. Its P/E of 32.7 and P/B of 8.54 suggest a stretched valuation relative to the sector. The company supports shareholders with a 2.1% dividend yield, reflecting confidence in steady cash flow and disciplined capital allocation.
Teradyne, Inc.
Teradyne posts a strong 19.8% ROE and an impressive 17.4% net margin, signaling operational effectiveness. However, its P/E of 54.6 and P/B of 10.8 mark an expensive valuation, raising caution. The dividend yield stands at a modest 0.25%, indicating a focus on reinvestment and growth over immediate shareholder payouts.
Premium Valuation vs. Operational Safety
QUALCOMM balances high profitability with a more reasonable valuation and attractive dividend yield. Teradyne’s superior margins come at a steep price and limited income return. Investors seeking a blend of operational safety and income may prefer QUALCOMM, while growth-focused profiles might tolerate Teradyne’s valuation stretch.
Which one offers the Superior Shareholder Reward?
I see QUALCOMM (QCOM) pays a meaningful dividend yield around 2.1% with a high payout ratio near 69%, well covered by strong free cash flow at 91%. Its share buybacks are substantial, supporting total returns. Teradyne (TER), by contrast, yields a meager 0.25% with a low payout ratio near 14%, prioritizing reinvestment in growth. TER’s buybacks are modest but less intense than QCOM’s. Historically, in tech hardware, a balanced dividend plus aggressive buybacks like QCOM’s often sustain long-term shareholder value better than TER’s growth-first model. I judge QCOM offers a more attractive total return profile for 2026 investors, blending income with capital return, while TER leans heavily on growth, which carries higher execution risk.
Comparative Score Analysis: The Strategic Profile
The radar chart reveals the fundamental DNA and trade-offs of QUALCOMM Incorporated and Teradyne, Inc., highlighting their financial strengths and vulnerabilities:

QUALCOMM exhibits superior returns with top scores in ROE (5) and ROA (5), and a favorable DCF score (4), but suffers from a highly leveraged balance sheet (Debt/Equity score 1). Teradyne shows a more moderate but balanced profile, with decent returns (ROE 4, ROA 5) and better debt management (Debt/Equity score 3). QUALCOMM relies heavily on operational efficiency yet carries significant financial risk, while Teradyne presents a steadier financial structure despite lower cash flow valuation scores.
Bankruptcy Risk: Solvency Showdown
The Altman Z-Score gap indicates Teradyne’s far stronger solvency position over QUALCOMM in this cycle:
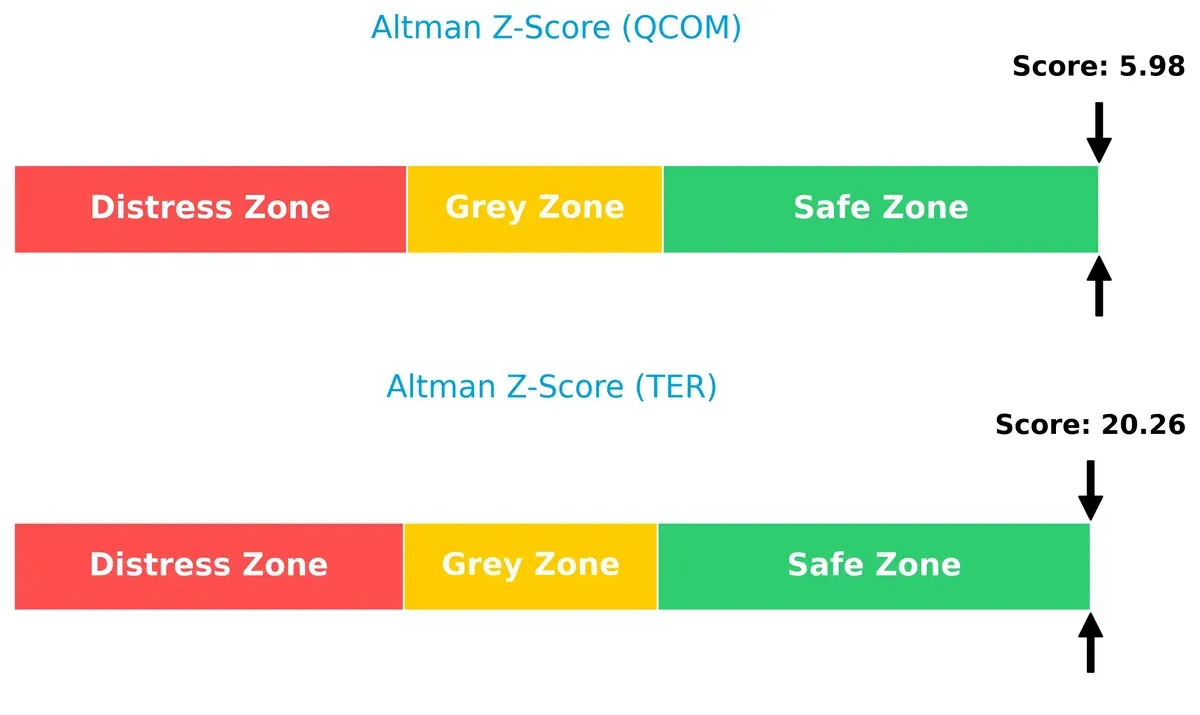
Teradyne scores an exceptionally safe 20.3, signaling robust financial health and minimal bankruptcy risk. QUALCOMM’s 6.0 is still comfortably in the safe zone but reflects higher leverage and potential vulnerability under stress.
Financial Health: Quality of Operations
QUALCOMM’s Piotroski F-Score of 7 signals strong operational quality, surpassing Teradyne’s average score of 6:
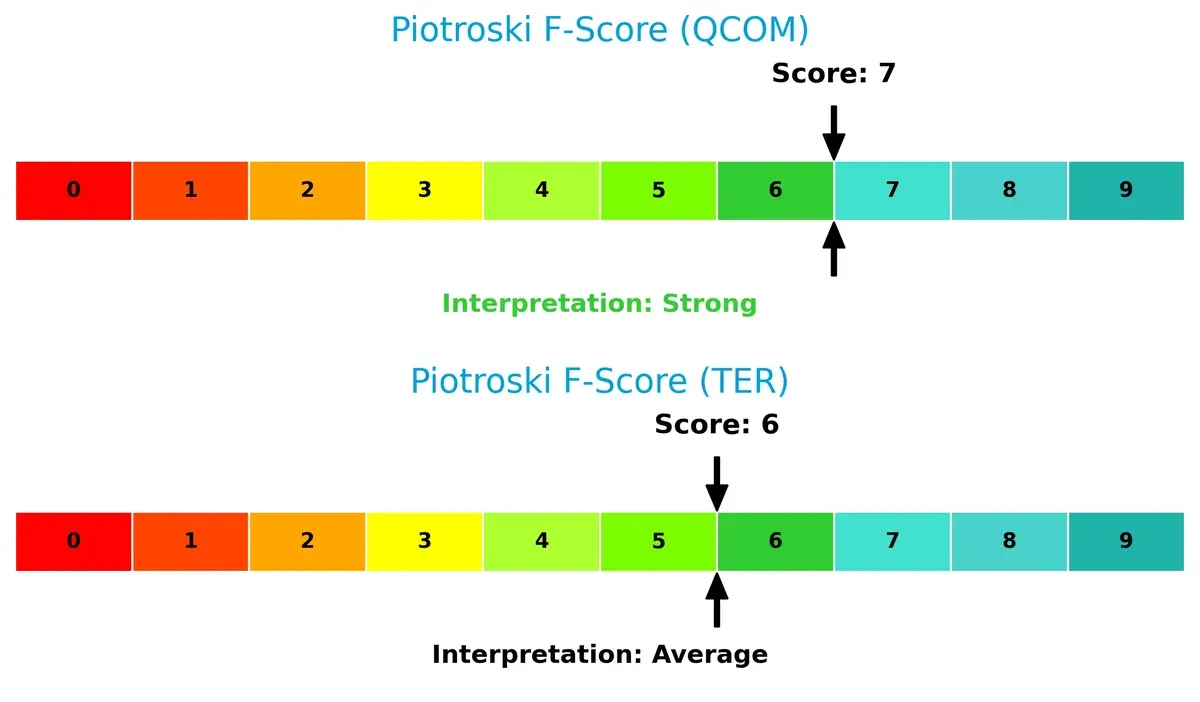
QUALCOMM shows better internal financial metrics, pointing to superior profitability and efficiency. Teradyne, while solid, may face some internal pressures impacting its overall financial strength relative to QUALCOMM.
How are the two companies positioned?
This section dissects the operational DNA of QUALCOMM and Teradyne by comparing their revenue distribution and internal dynamics. The goal is to confront their economic moats and identify which model offers the most resilient competitive advantage today.
Revenue Segmentation: The Strategic Mix
This comparison dissects how QUALCOMM Incorporated and Teradyne, Inc. diversify their income streams and reveals where their primary sector bets lie:
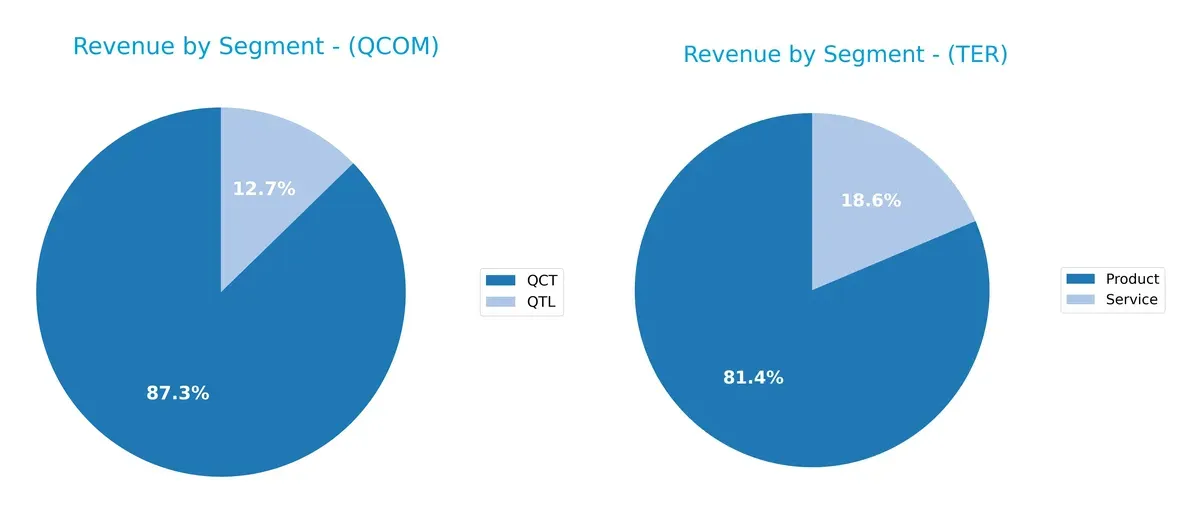
QUALCOMM’s revenue heavily pivots on its QCT segment, generating $38.4B in 2025, dwarfing its QTL segment at $5.6B. This concentration anchors its dominance in chipset technology but exposes concentration risk. Teradyne presents a more balanced mix, with $2.3B from Product and $525M from Service in 2024, reflecting a strategic diversification that mitigates reliance on a single revenue source and supports infrastructure resilience.
Strengths and Weaknesses Comparison
This table compares the strengths and weaknesses of QUALCOMM and Teradyne based on key financial and market metrics:
QUALCOMM Strengths
- Strong global presence with significant revenue from China and Vietnam
- Favorable profitability metrics: net margin 12.51%, ROE 26.13%, ROIC 13.19%
- Solid liquidity ratios: current ratio 2.82, quick ratio 2.1
- Low debt-to-assets at 29.54% with high interest coverage of 20.07
- High fixed asset turnover at 9.44 supports efficient asset use
Teradyne Strengths
- Higher net margin at 17.37% and superior ROIC at 18.45%
- Very low debt-to-assets at 8.32% and excellent interest coverage of 81.43
- Favorable liquidity metrics: current ratio 1.76, quick ratio 1.41
- Diversified revenue streams from product and service segments
- Global geographic reach with presence in key Asian and US markets
QUALCOMM Weaknesses
- Unfavorable valuation metrics: P/E 32.7, P/B 8.54 indicating high market expectations
- Neutral debt/equity ratio at 0.7 may limit financial flexibility
- Asset turnover moderate at 0.88, below typical tech sector leaders
- Dividend yield moderate at 2.1%, lower growth potential
Teradyne Weaknesses
- Unfavorable high WACC at 12.35% increases capital costs
- Very high P/E of 54.64 and P/B of 10.83 indicate overvaluation risk
- Dividend yield low at 0.25%, limiting income appeal
- Asset turnover moderate at 0.76, reflecting less efficient asset use
Overall, both companies show strong profitability and favorable liquidity. QUALCOMM benefits from a robust global footprint and efficient asset utilization. Teradyne excels in margin performance and capital structure conservatism but faces valuation and capital cost challenges. These factors influence each company’s strategic options in competitive markets.
The Moat Duel: Analyzing Competitive Defensibility
A structural moat protects long-term profits from relentless competition erosion. Here’s how QUALCOMM and Teradyne defend their turf:
QUALCOMM Incorporated: Intellectual Property and Licensing Power
QUALCOMM’s moat stems from its vast patent portfolio and licensing business. This intangible asset drives strong ROIC above WACC, reflecting efficient capital use. New 5G and AI initiatives could deepen its moat, but geopolitical risks in China pose challenges.
Teradyne, Inc.: Technological Expertise and Automation Scale
Teradyne thrives on advanced automation and testing technology, differentiating from QUALCOMM’s IP focus. Its higher ROIC premium signals robust value creation. Expansion into industrial robotics and AI testing could extend its competitive edge amid rising automation demand.
Moat Strength Battle: Patent Licensing vs. Automation Innovation
Both firms create value with ROIC well above WACC, yet Teradyne’s wider ROIC margin suggests a deeper moat. However, QUALCOMM’s global licensing footprint better defends its market share against emerging rivals. Teradyne’s moat is growing, but QUALCOMM remains better equipped to protect long-term profits.
Which stock offers better returns?
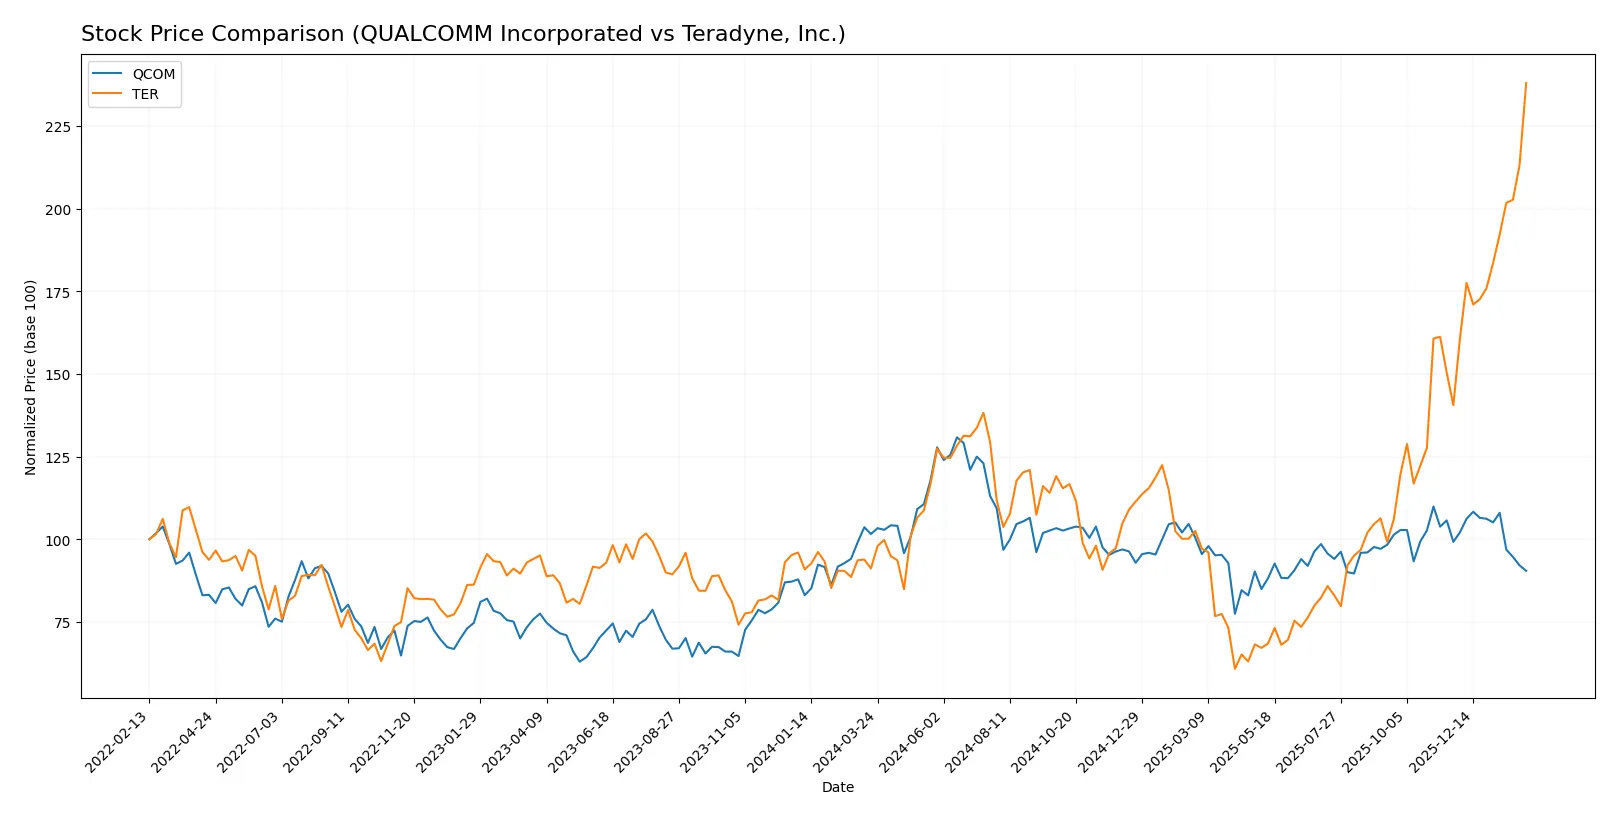
Over the past 12 months, QUALCOMM’s shares declined sharply, while Teradyne’s stock surged with accelerating momentum and strong buyer dominance.
Trend Comparison
QUALCOMM’s stock fell 10.95% over the past year, showing a bearish trend with deceleration and a high volatility of 16.24%. The price ranged between 127.46 and 215.33.
Teradyne’s stock surged 161.08% in the same period, reflecting a strong bullish trend with accelerating momentum and notable volatility at 39.2%. Its price spiked from 68.72 to 269.07.
Teradyne delivered far superior market performance compared to QUALCOMM, demonstrating robust upward momentum and stronger buyer dominance.
Target Prices
Analysts present a bullish consensus for both QUALCOMM Incorporated and Teradyne, Inc., signaling upside potential from current prices.
| Company | Target Low | Target High | Consensus |
|---|---|---|---|
| QUALCOMM Incorporated | 160 | 210 | 181.43 |
| Teradyne, Inc. | 175 | 335 | 276.08 |
QUALCOMM trades at $148.89, below the $181.43 consensus, suggesting room for appreciation. Teradyne’s current price of $269.07 is close to its $276.08 target, indicating moderate upside.

Don’t Let Luck Decide Your Entry Point
Optimize your entry points with our advanced ProRealTime indicators. You’ll get efficient buy signals with precise price targets for maximum performance. Start outperforming now!
How do institutions grade them?
This section compares the latest institutional grades for QUALCOMM Incorporated and Teradyne, Inc.:
QUALCOMM Incorporated Grades
The following table summarizes recent grades from leading financial institutions for QUALCOMM:
| Grading Company | Action | New Grade | Date |
|---|---|---|---|
| Cantor Fitzgerald | Maintain | Neutral | 2026-02-02 |
| UBS | Maintain | Neutral | 2026-01-26 |
| Mizuho | Maintain | Neutral | 2026-01-26 |
| Mizuho | Downgrade | Neutral | 2026-01-09 |
| UBS | Maintain | Neutral | 2025-11-06 |
| Piper Sandler | Maintain | Overweight | 2025-11-06 |
| Wells Fargo | Maintain | Underweight | 2025-11-06 |
| Mizuho | Maintain | Outperform | 2025-11-06 |
| Rosenblatt | Maintain | Buy | 2025-11-06 |
| B of A Securities | Maintain | Buy | 2025-11-06 |
Teradyne, Inc. Grades
Here are the most recent institutional grades for Teradyne, Inc.:
| Grading Company | Action | New Grade | Date |
|---|---|---|---|
| Stifel | Maintain | Buy | 2026-02-04 |
| Goldman Sachs | Maintain | Buy | 2026-02-04 |
| Citigroup | Maintain | Buy | 2026-02-04 |
| Cantor Fitzgerald | Maintain | Overweight | 2026-02-04 |
| Evercore ISI Group | Maintain | Outperform | 2026-02-04 |
| Evercore ISI Group | Maintain | Outperform | 2026-02-03 |
| Cantor Fitzgerald | Maintain | Overweight | 2026-02-02 |
| Stifel | Maintain | Buy | 2026-01-30 |
| UBS | Maintain | Buy | 2026-01-26 |
| B of A Securities | Maintain | Buy | 2026-01-22 |
Which company has the best grades?
Teradyne consistently earns Buy and Outperform ratings from top firms, signaling broad institutional confidence. QUALCOMM’s grades cluster around Neutral, with some divergence, indicating mixed sentiment. This contrast could influence investor perception and risk tolerance.
Risks specific to each company
The following categories identify critical pressure points and systemic threats facing QUALCOMM Incorporated and Teradyne, Inc. in the 2026 market environment:
1. Market & Competition
QUALCOMM Incorporated
- Faces intense rivalry in semiconductors with rapid tech shifts, requiring constant innovation to maintain licensing revenue.
Teradyne, Inc.
- Competes in test equipment with diverse clients but faces pressure from automation tech cycles and industry fragmentation.
2. Capital Structure & Debt
QUALCOMM Incorporated
- Moderate leverage with debt-to-assets at 29.54% and strong interest coverage of 20x; however, debt-to-equity score is very unfavorable.
Teradyne, Inc.
- Very low debt-to-assets (8.32%) and excellent interest coverage at 81x, reflecting conservative financing and solid balance sheet.
3. Stock Volatility
QUALCOMM Incorporated
- Beta of 1.24 indicates moderate volatility aligned with tech sector norms.
Teradyne, Inc.
- Higher beta of 1.82 signals greater stock price swings, increasing risk for investors in turbulent markets.
4. Regulatory & Legal
QUALCOMM Incorporated
- Subject to licensing and antitrust scrutiny globally, posing ongoing legal and compliance costs.
Teradyne, Inc.
- Faces fewer regulatory risks but must comply with export controls impacting automated test equipment sales.
5. Supply Chain & Operations
QUALCOMM Incorporated
- Relies on complex semiconductor supply chains vulnerable to geopolitical tensions and material shortages.
Teradyne, Inc.
- Benefits from diversified industrial automation supply but exposed to component sourcing delays and manufacturing costs.
6. ESG & Climate Transition
QUALCOMM Incorporated
- Faces pressure to reduce emissions in semiconductor manufacturing and improve governance of intellectual property.
Teradyne, Inc.
- Increasing focus on sustainability in industrial robotics but lower public ESG scrutiny compared to chipmakers.
7. Geopolitical Exposure
QUALCOMM Incorporated
- Significant exposure to US-China tech tensions affecting supply chains and licensing revenues.
Teradyne, Inc.
- More diversified global footprint but still vulnerable to trade restrictions impacting automated test systems.
Which company shows a better risk-adjusted profile?
Teradyne’s strongest advantage lies in its pristine balance sheet and low leverage, reducing financial risk sharply. QUALCOMM’s biggest vulnerability is regulatory and legal pressures linked to its licensing model amid global antitrust scrutiny. Teradyne’s higher stock volatility offsets some balance sheet strength. Overall, Teradyne offers a cleaner risk-adjusted profile, but QUALCOMM’s strong operational cash flow and dividend yield provide resilience. Teradyne’s recent 4.9% stock drop highlights volatility risk, while QUALCOMM’s stable dividend underpins steady income despite valuation concerns.
Final Verdict: Which stock to choose?
QUALCOMM’s superpower lies in its unmatched capital efficiency and robust cash flow generation. Its slightly declining profitability urges vigilance but doesn’t overshadow its strong position. It fits portfolios seeking steady income with moderate growth—more aligned with Income and Quality Growth investors.
Teradyne’s strategic moat is its specialization in automation and testing equipment, delivering consistent returns on invested capital. It offers superior balance sheet safety and a more dynamic growth profile than QUALCOMM. It suits Growth at a Reasonable Price (GARP) portfolios that tolerate valuation premiums for future expansion.
If you prioritize stable cash generation and a proven capital allocation record, QUALCOMM is the compelling choice due to its reliable income and operational efficiency. However, if you seek accelerated growth with a strong moat in industrial tech, Teradyne offers better upside potential and balance sheet safety despite a higher valuation. Both present slightly favorable moats but diverge on risk and growth profiles.
Disclaimer: Investment carries a risk of loss of initial capital. The past performance is not a reliable indicator of future results. Be sure to understand risks before making an investment decision.
Go Further
I encourage you to read the complete analyses of QUALCOMM Incorporated and Teradyne, Inc. to enhance your investment decisions: