Taiwan Semiconductor Manufacturing Company Limited (TSM) and QUALCOMM Incorporated (QCOM) are two giants in the semiconductor industry, each shaping the future of technology through innovation and strategic market positioning. TSM excels in advanced wafer fabrication, while QUALCOMM leads in wireless communication technologies and intellectual property licensing. This comparison will help investors understand which company offers the most promising opportunity in a rapidly evolving tech landscape. Let’s discover which stock deserves a place in your portfolio.

Table of contents
Companies Overview
I will begin the comparison between Taiwan Semiconductor Manufacturing Company Limited and QUALCOMM Incorporated by providing an overview of these two companies and their main differences.
Taiwan Semiconductor Manufacturing Company Limited Overview
Taiwan Semiconductor Manufacturing Company Limited (TSM) operates as a leading semiconductor manufacturer providing integrated circuits and related devices globally. Founded in 1987 and headquartered in Hsinchu City, Taiwan, it offers wafer fabrication processes, including CMOS logic and radio frequency technologies. TSMC’s products serve high performance computing, smartphones, automotive, and digital consumer electronics markets, supported by extensive engineering and customer services.
QUALCOMM Incorporated Overview
QUALCOMM Incorporated (QCOM), based in San Diego, California, develops and commercializes foundational wireless technologies worldwide. Incorporated in 1985, it operates through segments focusing on integrated circuits for wireless communications, technology licensing for patents related to 3G/4G/5G standards, and strategic investments in emerging industries like AI and IoT. QUALCOMM also provides services to U.S. government agencies, emphasizing innovation in voice and data communications.
Key similarities and differences
Both TSM and QCOM operate in the semiconductor industry, focusing on advanced technologies essential for wireless and digital communications. TSM primarily manufactures semiconductor wafers and devices, while QUALCOMM concentrates on integrated circuit development, patent licensing, and strategic investments. TSM’s business model emphasizes manufacturing and engineering support, whereas QUALCOMM’s combines product development with intellectual property monetization and diversified technology initiatives.
Income Statement Comparison
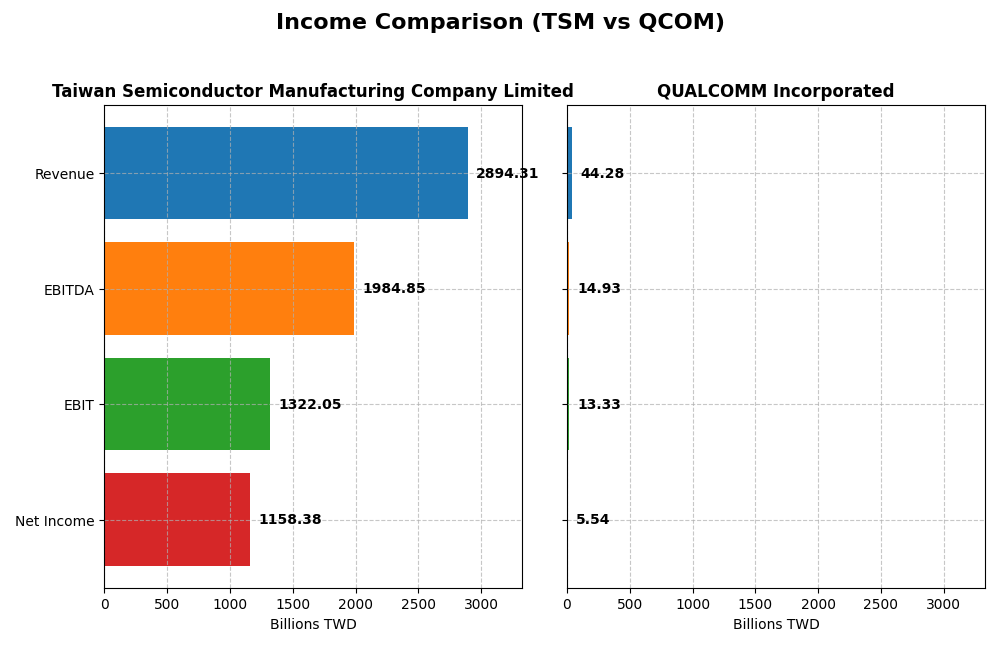
This table presents a side-by-side comparison of the most recent fiscal year income statement metrics for Taiwan Semiconductor Manufacturing Company Limited (TSM) and QUALCOMM Incorporated (QCOM).
| Metric | Taiwan Semiconductor Manufacturing Company Limited (TSM) | QUALCOMM Incorporated (QCOM) |
|---|---|---|
| Market Cap | 1.70T TWD | 176B USD |
| Revenue | 2.89T TWD | 44.28B USD |
| EBITDA | 1.98T TWD | 14.93B USD |
| EBIT | 1.32T TWD | 13.33B USD |
| Net Income | 1.16T TWD | 5.54B USD |
| EPS | 223.4 TWD | 5.06 USD |
| Fiscal Year | 2024 | 2025 |
Income Statement Interpretations
Taiwan Semiconductor Manufacturing Company Limited
TSMC showed strong revenue growth from 2020 to 2024, with revenue rising from 1.34T TWD to 2.89T TWD, and net income growing even faster from 510B TWD to 1.16T TWD. Margins remained robust and stable, with a gross margin of 56.12% and net margin at 40.02% in the latest year. The 2024 fiscal year marked continued favorable growth, particularly in revenue and EPS, supporting solid profitability.
QUALCOMM Incorporated
QUALCOMM’s revenue increased from $33.6B in 2021 to $44.3B in 2025, but net income declined from $9B to $5.5B over the same period. Margins showed a downward trend, with net margin falling to 12.51% in 2025 despite a stable gross margin near 55%. The most recent year saw slower revenue growth but significant declines in net margin and EPS, reflecting some operational challenges.
Which one has the stronger fundamentals?
TSMC demonstrates stronger fundamentals with consistently favorable revenue and net income growth, high and stable margins, and positive earnings growth. QUALCOMM, while showing revenue growth, faces declining net income and margin pressures, with unfavorable trends in profitability metrics over the period. Overall, TSMC’s income statement indicators suggest a more robust financial position.
Financial Ratios Comparison
The table below presents a side-by-side comparison of key financial ratios for Taiwan Semiconductor Manufacturing Company Limited (TSM) and QUALCOMM Incorporated (QCOM), based on the most recent fiscal year data available.
| Ratios | Taiwan Semiconductor Manufacturing Company Limited (TSM) FY 2024 | QUALCOMM Incorporated (QCOM) FY 2025 |
|---|---|---|
| ROE | 27.29% | 26.13% |
| ROIC | 19.99% | 13.19% |
| P/E | 29.04 | 32.70 |
| P/B | 7.92 | 8.54 |
| Current Ratio | 2.36 | 2.82 |
| Quick Ratio | 2.14 | 2.10 |
| D/E | 0.25 | 0.70 |
| Debt-to-Assets | 15.65% | 29.54% |
| Interest Coverage | 126.0 | 18.61 |
| Asset Turnover | 0.43 | 0.88 |
| Fixed Asset Turnover | 0.88 | 9.44 |
| Payout ratio | 31.34% | 68.67% |
| Dividend yield | 1.08% | 2.10% |
Interpretation of the Ratios
Taiwan Semiconductor Manufacturing Company Limited
TSMC’s financial ratios show strength in profitability and liquidity, with a favorable net margin of 40.02% and a current ratio of 2.36. However, its price-to-earnings (PE) and price-to-book (PB) ratios appear elevated, indicating potential overvaluation concerns. The dividend yield is modest at 1.08%, reflecting a stable but cautious shareholder return policy supported by consistent free cash flow coverage.
QUALCOMM Incorporated
QUALCOMM exhibits solid profitability with a 12.51% net margin and strong returns on equity and capital employed. Its liquidity ratios are favorable, though the debt-to-equity ratio is neutral at 0.7, suggesting moderate leverage. The dividend yield stands at 2.1%, supported by steady payout and share buybacks, indicating a shareholder-friendly approach balanced with investment in growth and R&D.
Which one has the best ratios?
Both companies demonstrate favorable overall financial health, but QUALCOMM presents a higher proportion of favorable ratios, particularly in asset efficiency and dividend yield, with fewer unfavorable metrics. TSMC excels in profitability and liquidity but faces challenges from higher valuation multiples and asset turnover ratios, making QUALCOMM’s ratios comparatively stronger in this context.
Strategic Positioning
This section compares the strategic positioning of TSM and QCOM, including market position, key segments, and exposure to technological disruption:
TSM
- Leading global semiconductor manufacturer with significant scale, facing competitive pressure globally.
- Focused on wafer fabrication for integrated circuits used in high-performance computing and consumer electronics.
- Moderate exposure through continuous investment in advanced wafer fabrication and technology startups.
QCOM
- Major wireless technology developer with strong market presence, facing competition in chipsets and licensing.
- Diversified across integrated circuits, technology licensing, and strategic investments in emerging tech.
- High exposure via development of wireless tech standards and investment in AI, 5G, automotive, and IoT.
TSM vs QCOM Positioning
TSM’s strategy centers on a concentrated business model in semiconductor manufacturing, offering scale advantages but exposure to fabrication risks. QCOM’s diversified approach spans chipsets, licensing, and strategic initiatives, providing multiple revenue streams but with complex market dynamics.
Which has the best competitive advantage?
Both companies create value with slightly favorable moats, yet both face declining ROIC trends. TSM shows higher ROIC over WACC, indicating a stronger efficiency in capital use despite similar profitability challenges.
Stock Comparison
The stock price chart highlights significant bullish momentum for Taiwan Semiconductor Manufacturing Company Limited (TSM) with strong acceleration, while QUALCOMM Incorporated (QCOM) shows a moderate bullish trend overall but recent weakening in price performance.

Trend Analysis
Taiwan Semiconductor Manufacturing Company Limited (TSM) exhibited a strong bullish trend over the past 12 months with a 152.54% increase, showing acceleration and high volatility, peaking at 327.11 and bottoming at 127.7.
QUALCOMM Incorporated (QCOM) showed a moderate bullish trend over the same period with a 6.22% gain and acceleration, but recently experienced a 9.04% decline, indicating a short-term bearish reversal.
Comparing both stocks, TSM delivered the highest market performance with a substantial price increase, while QCOM’s gains were smaller and recently reversed, reflecting stronger investor momentum in TSM.
Target Prices
The consensus target prices for Taiwan Semiconductor Manufacturing Company Limited and QUALCOMM Incorporated indicate positive analyst outlooks.
| Company | Target High | Target Low | Consensus |
|---|---|---|---|
| Taiwan Semiconductor Manufacturing Company Limited | 400 | 330 | 361.25 |
| QUALCOMM Incorporated | 210 | 165 | 185.71 |
Analysts expect Taiwan Semiconductor’s stock to appreciate from its current price of 327.11 USD toward the consensus target of 361.25 USD. QUALCOMM’s target consensus of 185.71 USD similarly suggests upside potential from its current 164.54 USD price.
Analyst Opinions Comparison
This section compares analysts’ ratings and grades for Taiwan Semiconductor Manufacturing Company Limited (TSM) and QUALCOMM Incorporated (QCOM):
Rating Comparison
TSM Rating
- Rating: A-, rated very favorable by analysts.
- Discounted Cash Flow Score: 5, very favorable, indicating strong cash flow projections.
- ROE Score: 5, very favorable, showing excellent profit generation from equity.
- ROA Score: 5, very favorable, reflecting effective asset utilization.
- Debt To Equity Score: 3, moderate, indicating average financial risk.
- Overall Score: 4, favorable, demonstrating solid overall financial health.
QCOM Rating
- Rating: B+, also rated very favorable but lower than TSM.
- Discounted Cash Flow Score: 4, favorable, slightly below TSM’s score.
- ROE Score: 5, very favorable, equal to TSM in profit generation efficiency.
- ROA Score: 5, very favorable, comparable asset efficiency to TSM.
- Debt To Equity Score: 1, very unfavorable, signaling higher financial risk.
- Overall Score: 3, moderate, somewhat lower overall financial standing.
Which one is the best rated?
Based strictly on the provided data, TSM holds a superior rating overall with an A- grade and higher overall and discounted cash flow scores. QCOM, while also rated very favorable, scores lower on overall and debt metrics, positioning TSM as the better rated company.
Scores Comparison
The scores comparison of TSM and QCOM highlights their financial stability and strength:
TSM Scores
- Altman Z-Score: 2.94, in the grey zone indicating moderate bankruptcy risk.
- Piotroski Score: 8, very strong financial health indicating good value.
QCOM Scores
- Altman Z-Score: 6.37, in the safe zone indicating low bankruptcy risk.
- Piotroski Score: 7, strong financial health indicating good value.
Which company has the best scores?
QCOM has a higher Altman Z-Score in the safe zone, showing lower bankruptcy risk, while TSM has a slightly better Piotroski Score, indicating stronger financial health. Overall, QCOM shows stronger financial stability.
Grades Comparison
Here is the grades comparison for Taiwan Semiconductor Manufacturing Company Limited and QUALCOMM Incorporated:
Taiwan Semiconductor Manufacturing Company Limited Grades
This table shows recent grades and actions from reputable grading companies for TSM:
| Grading Company | Action | New Grade | Date |
|---|---|---|---|
| Bernstein | Maintain | Outperform | 2025-12-08 |
| Needham | Maintain | Buy | 2025-10-27 |
| Barclays | Maintain | Overweight | 2025-10-17 |
| Needham | Maintain | Buy | 2025-10-16 |
| Susquehanna | Maintain | Positive | 2025-10-10 |
| Barclays | Maintain | Overweight | 2025-10-09 |
| Barclays | Maintain | Overweight | 2025-09-16 |
| Needham | Maintain | Buy | 2025-07-17 |
| Susquehanna | Maintain | Positive | 2025-07-14 |
| Needham | Maintain | Buy | 2025-07-01 |
Overall, TSM’s grades consistently maintain a positive outlook, dominated by Buy and Outperform ratings.
QUALCOMM Incorporated Grades
This table presents recent grades and actions from respected grading companies for QCOM:
| Grading Company | Action | New Grade | Date |
|---|---|---|---|
| Mizuho | Downgrade | Neutral | 2026-01-09 |
| Rosenblatt | Maintain | Buy | 2025-11-06 |
| B of A Securities | Maintain | Buy | 2025-11-06 |
| Mizuho | Maintain | Outperform | 2025-11-06 |
| Wells Fargo | Maintain | Underweight | 2025-11-06 |
| Piper Sandler | Maintain | Overweight | 2025-11-06 |
| UBS | Maintain | Neutral | 2025-11-06 |
| JP Morgan | Maintain | Overweight | 2025-11-04 |
| Citigroup | Maintain | Neutral | 2025-10-28 |
| Rosenblatt | Maintain | Buy | 2025-10-28 |
QCOM’s grades show a mixed sentiment with a recent downgrade to Neutral and a range of Buy, Neutral, Overweight, and Underweight ratings.
Which company has the best grades?
TSM has received consistently positive grades mostly rated Buy or better, whereas QCOM shows a more varied rating profile including Neutral and Underweight. This suggests TSM’s outlook is viewed more favorably by analysts, potentially impacting investor confidence and perceived risk.
Strengths and Weaknesses
Below is a comparative table highlighting key strengths and weaknesses of Taiwan Semiconductor Manufacturing Company Limited (TSM) and QUALCOMM Incorporated (QCOM) based on their latest financial and operational data.
| Criterion | Taiwan Semiconductor Manufacturing Company Limited (TSM) | QUALCOMM Incorporated (QCOM) |
|---|---|---|
| Diversification | Primarily focused on wafer manufacturing with limited diversification beyond semiconductor fabrication. | More diversified with segments like QCT (chipsets) and QTL (licensing), providing multiple revenue streams. |
| Profitability | High net margin of 40.02%, ROE 27.29%, and ROIC 20%, indicating strong profitability. | Moderate net margin of 12.51%, ROE 26.13%, and ROIC 13.19%, still profitable but less than TSM. |
| Innovation | Strong in semiconductor manufacturing technology but facing declining ROIC trend (-10.37%), signaling potential innovation or efficiency challenges. | Innovation-driven in wireless technology but also with a steep declining ROIC trend (-51.85%), indicating recent profitability pressures. |
| Global presence | Global leader in foundry services with a broad international customer base. | Global footprint in wireless communications and licensing, significant presence in multiple markets. |
| Market Share | Dominant market share in wafer fabrication, especially for advanced nodes. | Leading player in mobile chipsets and licensing but with more competition impacting market share growth. |
Key takeaways: Both companies create value with favorable profitability metrics, but their declining ROIC trends warrant caution. TSM excels in manufacturing efficiency, while QCOM benefits from diversified revenue but faces sharper profitability declines. Investors should consider these dynamics alongside market conditions.
Risk Analysis
Below is a comparative table summarizing the key risks associated with Taiwan Semiconductor Manufacturing Company Limited (TSMC) and QUALCOMM Incorporated (QCOM) based on the most recent data from 2025-2026.
| Metric | Taiwan Semiconductor Manufacturing Company Limited (TSM) | QUALCOMM Incorporated (QCOM) |
|---|---|---|
| Market Risk | Moderate: Beta 1.274 indicates above-average volatility | Moderate: Beta 1.212 suggests similar volatility |
| Debt Level | Low: Debt-to-Equity 0.25, Debt-to-Assets 15.65% (favorable) | Moderate: Debt-to-Equity 0.70 (neutral), Debt-to-Assets 29.54% (favorable) |
| Regulatory Risk | High: Exposure to Taiwan-China geopolitical tensions and global trade policies | Moderate: Subject to US regulatory scrutiny and patent litigations |
| Operational Risk | Moderate: Complex supply chain and reliance on advanced manufacturing | Moderate: Dependency on licensing revenue and technological innovation |
| Environmental Risk | Moderate: Energy-intensive semiconductor manufacturing with increasing sustainability demands | Moderate: Manufacturing and product lifecycle environmental impacts |
| Geopolitical Risk | High: Taiwan-China tensions pose significant operational risks | Moderate: US-China trade tensions affect global market access |
The most impactful and likely risks for TSMC are geopolitical tensions related to Taiwan’s political status, which can disrupt operations significantly. For QUALCOMM, regulatory and patent litigation risks, along with moderate geopolitical exposure, are key concerns. Both companies maintain strong financial health but require vigilance regarding external macro risks.
Which Stock to Choose?
Taiwan Semiconductor Manufacturing Company Limited (TSM) shows strong income growth with a 33.89% revenue increase in 2024 and a favorable profitability profile, including a 40.02% net margin and a 27.29% ROE. Its debt levels are low and well-covered, reflected in a very favorable A- rating.
QUALCOMM Incorporated (QCOM) displays moderate income growth at 13.66% in 2025, with solid profitability metrics such as a 12.51% net margin and 26.13% ROE. The company has higher debt relative to equity but maintains a very favorable B+ rating overall.
Considering ratings and financials, TSM’s higher profitability and stronger income growth might appeal to growth-oriented investors, while QCOM’s stable ratios and moderate debt could be seen as more suitable for those prioritizing steady income and quality. Both companies show a slightly favorable economic moat despite declining ROIC trends.
Disclaimer: Investment carries a risk of loss of initial capital. The past performance is not a reliable indicator of future results. Be sure to understand risks before making an investment decision.
Go Further
I encourage you to read the complete analyses of Taiwan Semiconductor Manufacturing Company Limited and QUALCOMM Incorporated to enhance your investment decisions: