Home > Comparison > Technology > QCOM vs STM
The strategic rivalry between QUALCOMM Incorporated and STMicroelectronics N.V. shapes the semiconductor industry’s evolution. QUALCOMM excels as a technology licensor and integrated circuit innovator, while STMicroelectronics operates as a diversified semiconductor manufacturer with strong automotive and industrial segments. This head-to-head contrasts intellectual property dominance against broad market exposure. This analysis aims to identify which corporate model delivers superior risk-adjusted returns for a well-diversified portfolio.
Table of contents
Companies Overview
QUALCOMM Incorporated and STMicroelectronics N.V. are key players shaping the semiconductor sector globally.
QUALCOMM Incorporated: Pioneer in Wireless Technology
QUALCOMM dominates the wireless industry by developing integrated circuits and software for 3G to 5G communications. Its revenue streams hinge on its Qualcomm CDMA Technologies segment and lucrative technology licensing of essential patents. In 2026, QUALCOMM focuses strategically on expanding early-stage ventures in AI, automotive, and IoT, reinforcing its competitive advantage in foundational wireless technologies.
STMicroelectronics N.V.: Diverse Semiconductor Innovator
STMicroelectronics excels in designing semiconductor products across automotive, industrial, and consumer markets. Its revenue derives from integrated circuits, sensors, microcontrollers, and analog products, spanning three business segments. The company prioritizes innovation in power transistors, MEMS, and secure microcontrollers, emphasizing broad market penetration through diversified applications worldwide.
Strategic Collision: Similarities & Divergences
QUALCOMM and STMicroelectronics both lead in semiconductors but diverge in approach: QUALCOMM builds on proprietary wireless technologies and licensing, while STMicroelectronics pursues a broad product portfolio with open application scopes. Their primary battleground is the evolving wireless and automotive semiconductor markets. Investors face contrasting profiles: QUALCOMM offers strong IP-driven royalties, whereas STMicroelectronics presents growth via product diversity and geographic reach.
Income Statement Comparison
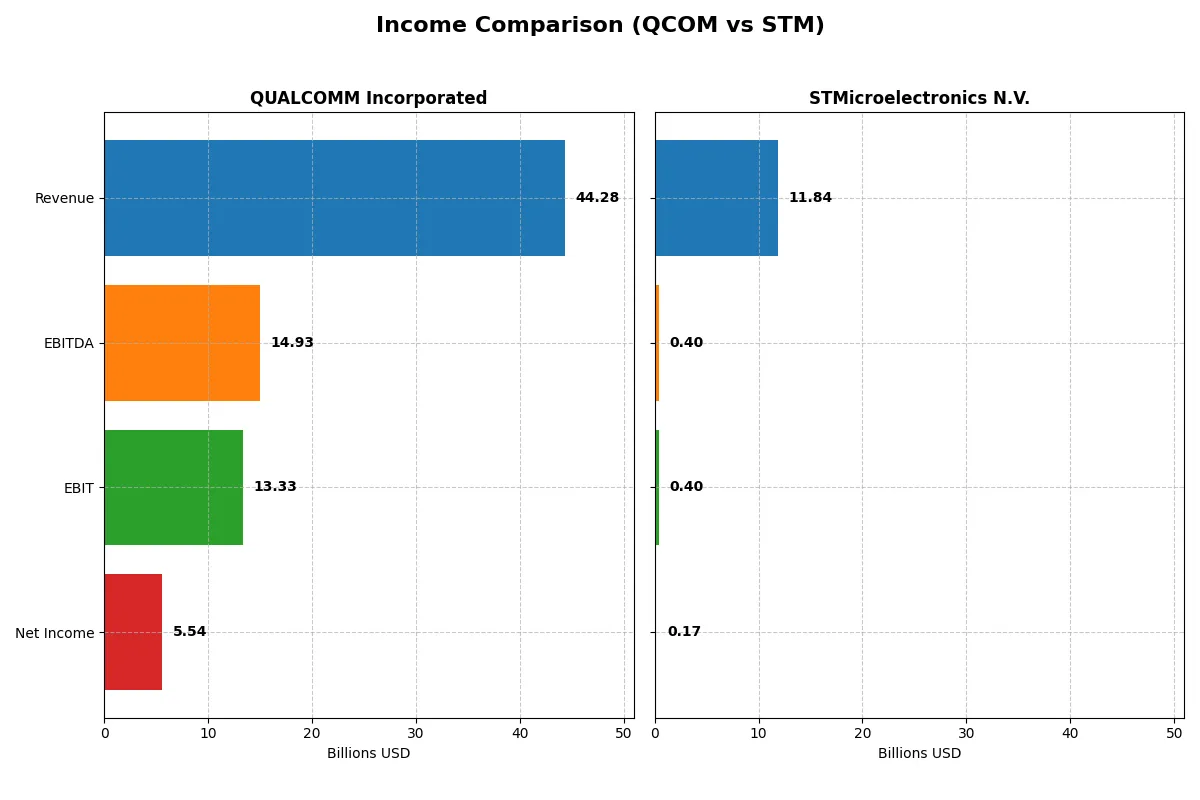
This data dissects the core profitability and scalability of both corporate engines to reveal who dominates the bottom line:
| Metric | QUALCOMM Incorporated (QCOM) | STMicroelectronics N.V. (STM) |
|---|---|---|
| Revenue | 44.3B | 11.8B |
| Cost of Revenue | 19.7B | 7.8B |
| Operating Expenses | 12.2B | 3.7B |
| Gross Profit | 24.5B | 4.0B |
| EBITDA | 14.9B | 401M |
| EBIT | 13.3B | 401M |
| Interest Expense | 664M | 0 |
| Net Income | 5.5B | 167M |
| EPS | 5.06 | 0.19 |
| Fiscal Year | 2025 | 2025 |
Income Statement Analysis: The Bottom-Line Duel
This income statement comparison reveals the true efficiency and profitability of QUALCOMM and STMicroelectronics’ corporate engines during recent market cycles.
QUALCOMM Incorporated Analysis
QUALCOMM’s revenue grew steadily from $33.6B in 2021 to $44.3B in 2025, peaking in 2022 at $44.2B. Net income showed volatility, dropping from $12.9B in 2022 to $5.5B in 2025. The company maintains strong gross margins above 55%, with a favorable EBIT margin around 30%. Despite a recent net margin decline, QUALCOMM’s operational efficiency and EBITDA growth demonstrate solid momentum.
STMicroelectronics N.V. Analysis
STMicroelectronics saw revenue contraction from $17.3B in 2023 to $11.8B in 2025, with net income falling sharply from $4.2B to $0.17B. Gross margins remain modest at approximately 34%, while EBIT and net margins hover near 3% and 1.4%, respectively, reflecting weaker profitability. The company’s declining revenue and earnings over five years highlight significant challenges in maintaining efficiency or growth momentum.
Margin Strength vs. Shrinking Scale
QUALCOMM clearly outperforms STMicroelectronics in scale and margin quality. QUALCOMM’s high gross and EBIT margins, combined with positive revenue growth, contrast sharply with ST’s shrinking revenue and compressed profitability. For investors prioritizing operational efficiency and resilient earnings, QUALCOMM’s profile offers more attractive fundamentals amid cyclical pressures.
Financial Ratios Comparison
These vital ratios act as a diagnostic tool to expose the underlying fiscal health, valuation premiums, and capital efficiency of QUALCOMM Incorporated and STMicroelectronics N.V.:
| Ratios | QUALCOMM (QCOM) | STMicroelectronics (STM) |
|---|---|---|
| ROE | 26.13% | 8.92% |
| ROIC | 13.19% | 6.34% |
| P/E | 32.70 | N/A |
| P/B | 8.54 | 1.29 |
| Current Ratio | 2.82 | 3.11 |
| Quick Ratio | 2.10 | 2.37 |
| D/E | 0.70 | 0.18 |
| Debt-to-Assets | 29.54% | 12.80% |
| Interest Coverage | 18.61 | 19.72 |
| Asset Turnover | 0.88 | 0.54 |
| Fixed Asset Turnover | 9.44 | 1.22 |
| Payout Ratio | 68.67% | 18.50% |
| Dividend Yield | 2.10% | 1.28% |
| Fiscal Year | 2025 | 2024 |
Efficiency & Valuation Duel: The Vital Signs
Financial ratios serve as a company’s DNA, uncovering operational strength and hidden risks beyond surface-level numbers.
QUALCOMM Incorporated
QUALCOMM boasts robust profitability with a 26.13% ROE and a solid 12.51% net margin, signaling operational efficiency. Its valuation appears stretched, reflected in a 32.7 P/E and 8.54 P/B ratio. The 2.1% dividend yield rewards shareholders, complemented by efficient capital allocation and favorable liquidity ratios.
STMicroelectronics N.V.
STMicroelectronics displays weak profitability, with a 0.93% ROE and 1.41% net margin, indicating limited operational efficiency. Its valuation metrics are favorable due to zero reported P/E and P/B ratios, but the company lacks dividend payouts, likely reinvesting in growth amid lower returns and moderate liquidity.
Premium Profitability vs. Conservative Valuation
QUALCOMM offers superior profitability and shareholder returns but trades at a premium, increasing valuation risk. STMicroelectronics presents a more conservative valuation but struggles with profitability and shareholder rewards. Investors prioritizing operational strength may favor QUALCOMM, while those seeking lower valuation risk might lean toward STMicroelectronics.
Which one offers the Superior Shareholder Reward?
I compare QUALCOMM and STMicroelectronics on dividends, payout ratios, and buybacks. QUALCOMM yields 2.1% with a 68.7% payout, supported by strong free cash flow of 11.7B. It also runs consistent buybacks, reflecting a shareholder-friendly capital allocation. STMicroelectronics pays a lower 1.28% yield with a 18.5% payout and less free cash flow, limiting buyback capacity. QUALCOMM’s model balances income and growth sustainably. I see QUALCOMM offering a superior total return profile for 2026 investors due to robust cash flow coverage and aggressive buybacks.
Comparative Score Analysis: The Strategic Profile
The radar chart reveals the fundamental DNA and trade-offs of QUALCOMM Incorporated and STMicroelectronics N.V., spotlighting their financial strengths and weaknesses:
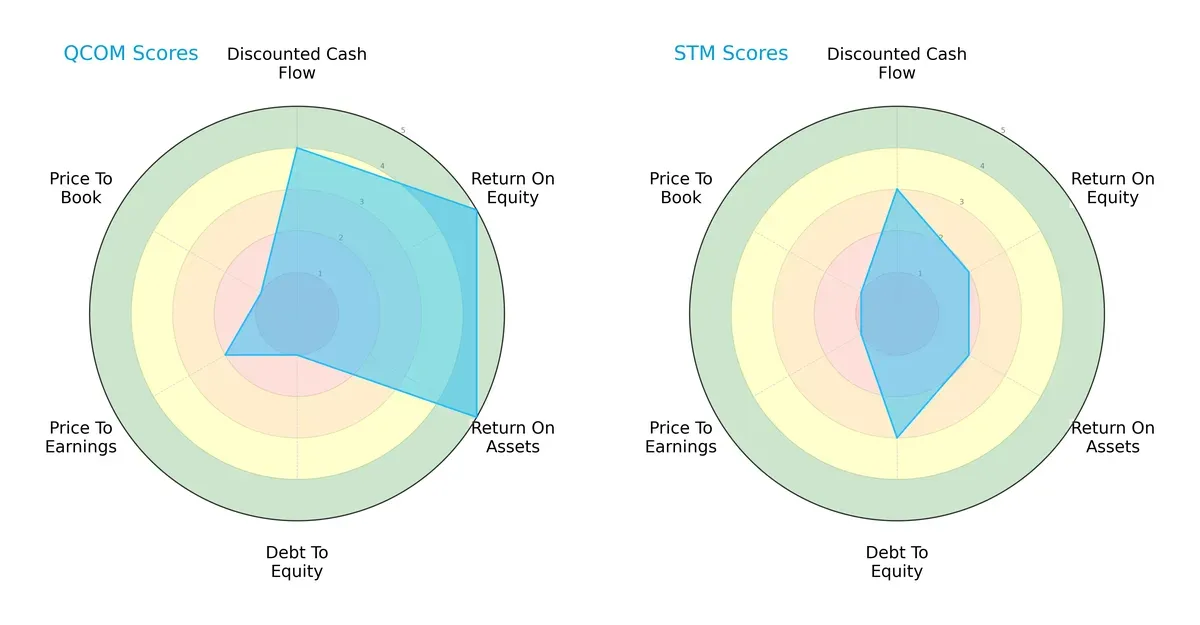
QUALCOMM shows superior returns with very favorable ROE and ROA scores (5 each), reflecting efficient asset and equity utilization. However, its balance sheet is riskier, evidenced by a very unfavorable debt-to-equity score (1). STMicroelectronics presents a more balanced financial risk profile with a moderate debt-to-equity score (3) but lags in profitability metrics, scoring only 2 in both ROE and ROA. QUALCOMM relies heavily on operational excellence but carries leverage risk. STMicroelectronics offers steadier financial leverage but weaker profitability and valuation scores.
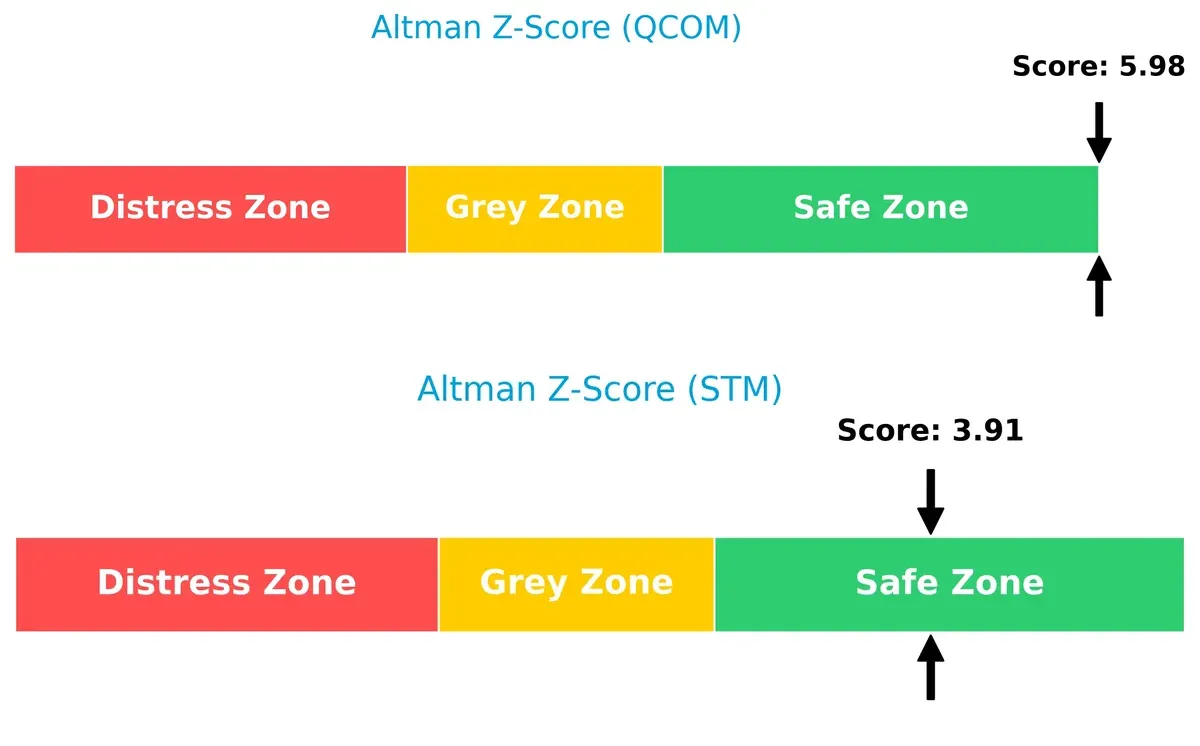
Bankruptcy Risk: Solvency Showdown
QUALCOMM’s Altman Z-Score of 5.98 and STMicroelectronics’ 3.91 both place them safely above the distress zone, signaling strong solvency and low bankruptcy risk in today’s cycle:
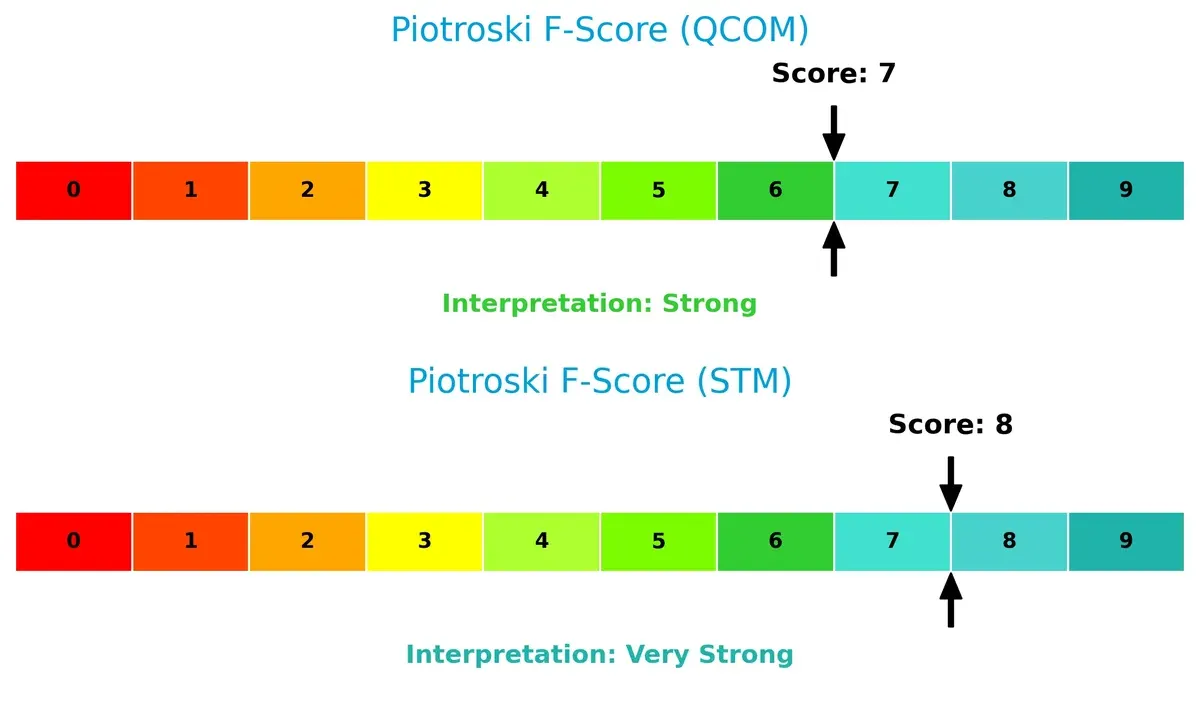
Financial Health: Quality of Operations
STMicroelectronics edges out QUALCOMM with a Piotroski score of 8 versus 7, indicating very strong financial health and operational quality. QUALCOMM’s score, while strong, suggests some internal metrics could improve:
How are the two companies positioned?
This section dissects QUALCOMM and STMicroelectronics’ operational DNA by comparing revenue distribution and internal strengths and weaknesses. The goal is to confront their economic moats to reveal which model offers the most resilient, sustainable advantage today.
Revenue Segmentation: The Strategic Mix
This visual comparison dissects how QUALCOMM Incorporated and STMicroelectronics N.V. diversify their income streams and reveals their primary sector bets:
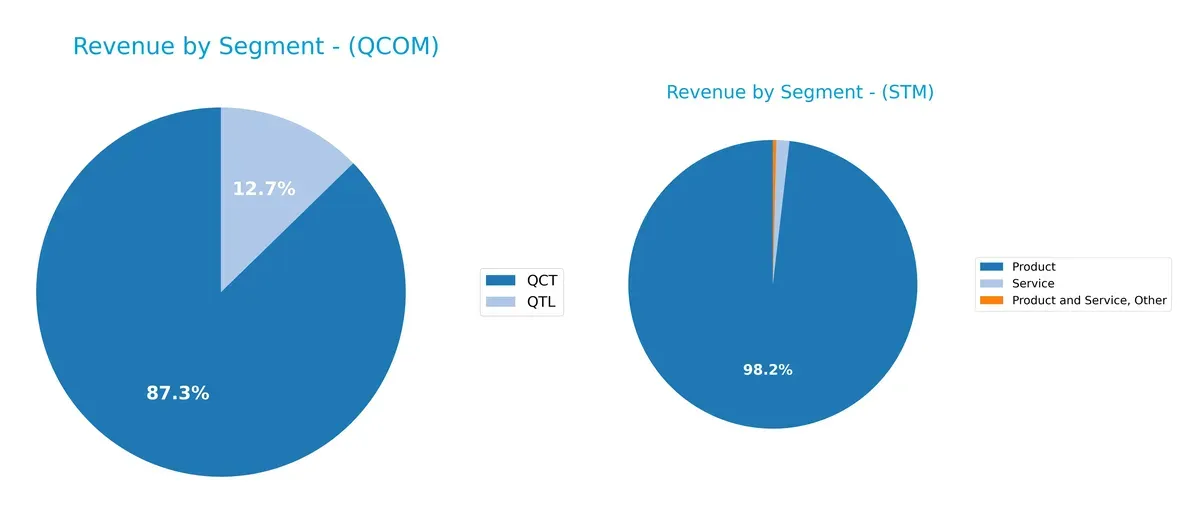
QUALCOMM anchors 2025 revenue with a dominant QCT segment at $38.4B, overshadowing QTL’s $5.6B. Its revenue mix leans heavily on chipset technology, exposing concentration risk but benefiting from ecosystem lock-in. Conversely, STMicroelectronics reports $13.2B in Product revenue and $196M in Services for 2024, reflecting a broader product-service balance. STM’s more diversified streams mitigate sector volatility, while QUALCOMM’s focus leverages infrastructure dominance in wireless technology.
Strengths and Weaknesses Comparison
This table compares the strengths and weaknesses of QUALCOMM and STMicroelectronics based on diversification, profitability, financials, innovation, global presence, and market share:
QUALCOMM Strengths
- Strong profitability with 12.5% net margin and 26.1% ROE
- Favorable liquidity ratios with 2.82 current and 2.1 quick ratio
- High interest coverage at 20x supports debt service
- Large and diversified revenue streams across segments
- Significant global presence, especially in China and Korea
- Solid market share in wireless chipset technology
STMicroelectronics Strengths
- Low debt-to-equity ratio at 0.12 indicates conservative leverage
- Favorable interest coverage with infinite ratio
- Diverse product groups including automotive and microcontrollers
- Geographic presence spans Americas, Asia Pacific, and EMEA
- Favorable PE and PB ratios suggest potential undervaluation
- Innovation in MEMS and analog segments supports niche markets
QUALCOMM Weaknesses
- High PE at 32.7 and PB at 8.54 may indicate valuation risk
- Moderate debt-to-equity ratio of 0.7 could constrain flexibility
- Neutral asset turnover at 0.88 suggests efficiency limits
- Heavy revenue reliance on China exposes geopolitical risks
- Limited diversification outside wireless and licensing
STMicroelectronics Weaknesses
- Low profitability with 1.4% net margin and sub-1% ROE
- Unfavorable asset turnover at 0.48 signals operational inefficiency
- Zero dividend yield may deter income-focused investors
- Unfavorable current ratio despite strong quick ratio
- Lower global revenue concentration compared to peers
Overall, QUALCOMM exhibits strong profitability and global reach but faces valuation and geographic concentration risks. STMicroelectronics shows financial conservatism and product diversity yet struggles with profitability and operational efficiency. These factors shape their respective strategic priorities.
The Moat Duel: Analyzing Competitive Defensibility
A structural moat is the only durable shield protecting long-term profits from relentless competitive erosion in semiconductors:
QUALCOMM Incorporated: Patent Powerhouse with Licensing Moat
QUALCOMM’s moat stems from its vast intellectual property portfolio, enforcing switching costs through patent licensing. This supports high ROIC and margin stability. In 2026, expansion in 5G and AI chips could deepen this advantage but geopolitical risks loom.
STMicroelectronics N.V.: Diversified Product Breadth, Yet Margin Pressure
STM relies on broad product diversification across automotive and industrial segments, contrasting QUALCOMM’s IP focus. However, its ROIC lags WACC, signaling weak capital efficiency. Market recovery and innovation in MEMS and power semiconductors offer growth potential but face execution challenges.
Licensing Dominance vs. Product Diversification: Who Holds the Stronger Moat?
QUALCOMM’s licensing moat creates a wider, more defensible economic moat with sustained value creation, despite a declining ROIC trend. STM’s value destruction and weak margins indicate a shallow moat. QUALCOMM is better positioned to defend market share amid intensifying competition.
Which stock offers better returns?
Over the past year, both QUALCOMM Incorporated and STMicroelectronics N.V. experienced significant price swings, with contrasting trend directions and volume dynamics shaping their trading profiles.
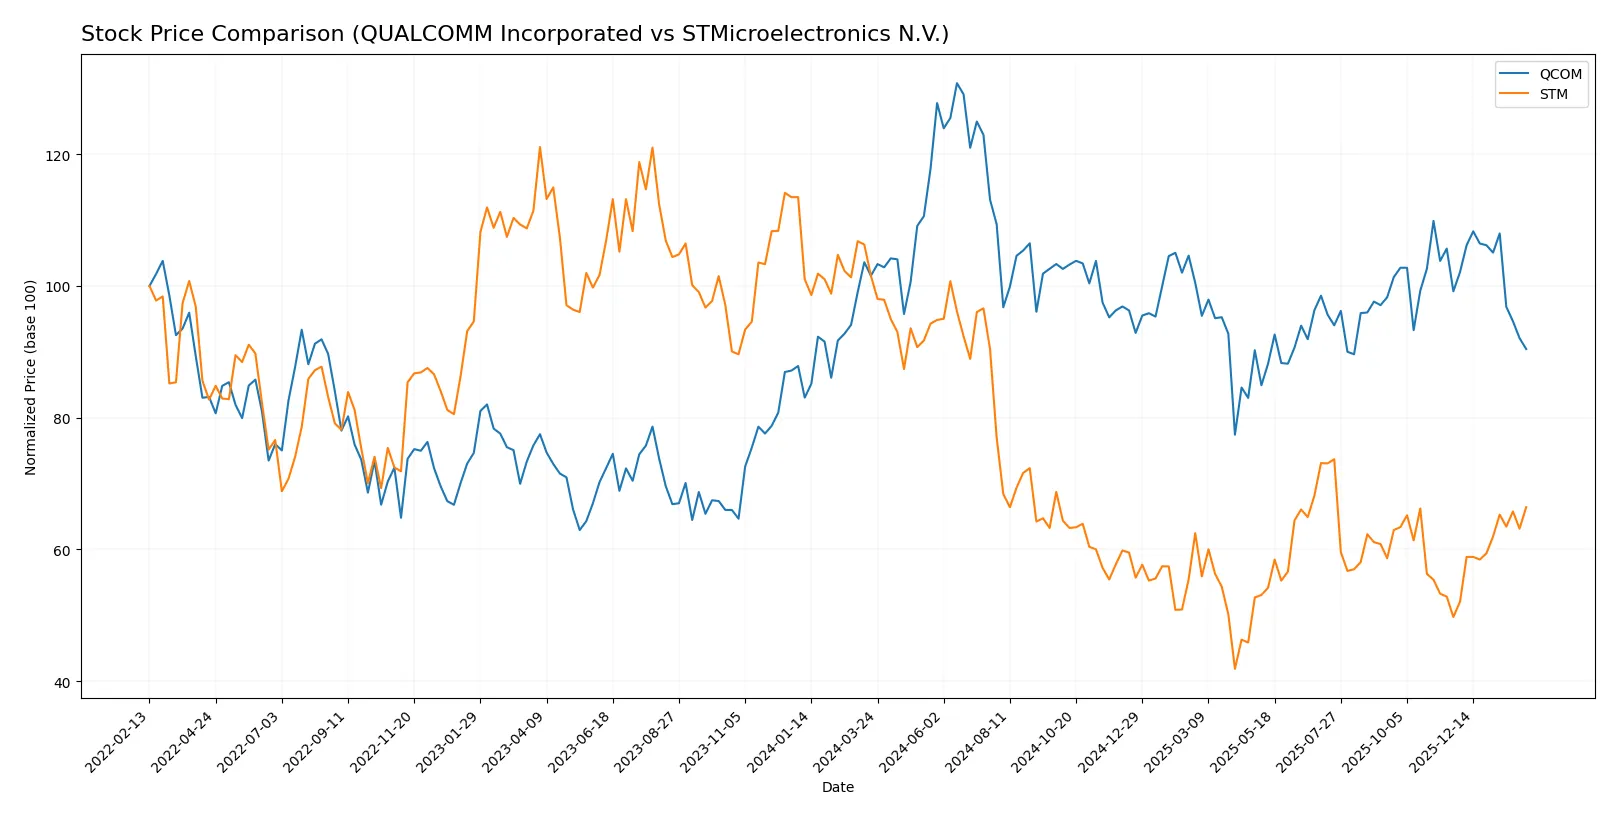
Trend Comparison
QUALCOMM’s stock fell 10.95% over the past 12 months, marking a bearish trend with decelerating losses. Price ranged between 127.46 and 215.33, showing high volatility (16.24 std deviation).
STMicroelectronics dropped 34.6% overall, also bearish but with accelerating declines. The stock’s price fluctuated from 18.49 to 44.85 with moderate volatility (6.54 std deviation).
Comparing the two, QUALCOMM’s decline was less severe than STMicroelectronics’, delivering the highest market performance over the year despite both trending downward.
Target Prices
Analysts project moderate upside for QUALCOMM Incorporated and STMicroelectronics N.V. based on current consensus targets.
| Company | Target Low | Target High | Consensus |
|---|---|---|---|
| QUALCOMM Incorporated | 160 | 210 | 181.43 |
| STMicroelectronics N.V. | 28 | 45 | 37.67 |
QUALCOMM’s consensus target of 181.43 suggests roughly 22% upside from the current 149 price. STMicroelectronics shows potential for 28% growth from 29.33, reflecting positive analyst sentiment.

Don’t Let Luck Decide Your Entry Point
Optimize your entry points with our advanced ProRealTime indicators. You’ll get efficient buy signals with precise price targets for maximum performance. Start outperforming now!
How do institutions grade them?
QUALCOMM Incorporated Grades
This table summarizes recent grades from credible financial institutions for QUALCOMM.
| Grading Company | Action | New Grade | Date |
|---|---|---|---|
| Cantor Fitzgerald | Maintain | Neutral | 2026-02-02 |
| UBS | Maintain | Neutral | 2026-01-26 |
| Mizuho | Maintain | Neutral | 2026-01-26 |
| Mizuho | Downgrade | Neutral | 2026-01-09 |
| UBS | Maintain | Neutral | 2025-11-06 |
| Piper Sandler | Maintain | Overweight | 2025-11-06 |
| Wells Fargo | Maintain | Underweight | 2025-11-06 |
| Mizuho | Maintain | Outperform | 2025-11-06 |
| Rosenblatt | Maintain | Buy | 2025-11-06 |
| B of A Securities | Maintain | Buy | 2025-11-06 |
STMicroelectronics N.V. Grades
The following table lists recent grades from notable grading firms for STMicroelectronics N.V.
| Grading Company | Action | New Grade | Date |
|---|---|---|---|
| TD Cowen | Maintain | Buy | 2025-10-24 |
| Susquehanna | Maintain | Positive | 2025-10-22 |
| Susquehanna | Maintain | Positive | 2025-07-25 |
| Baird | Upgrade | Outperform | 2025-07-22 |
| Susquehanna | Maintain | Positive | 2025-07-22 |
| Jefferies | Upgrade | Buy | 2025-02-19 |
| Bernstein | Downgrade | Market Perform | 2025-02-05 |
| Susquehanna | Maintain | Positive | 2025-01-31 |
| Barclays | Downgrade | Underweight | 2025-01-22 |
| JP Morgan | Downgrade | Neutral | 2024-12-09 |
Which company has the best grades?
STMicroelectronics shows a broader range of grades, including multiple upgrades to Buy and Outperform. QUALCOMM’s grades cluster around Neutral with some Buy and Outperform ratings but also Underweight. Investors may view STM’s more frequent positive upgrades as signaling stronger analyst conviction, while QUALCOMM’s mixed grades suggest more cautious sentiment.
Risks specific to each company
The following categories identify critical pressure points and systemic threats facing QUALCOMM Incorporated and STMicroelectronics N.V. in the 2026 market environment:
1. Market & Competition
QUALCOMM Incorporated
- Faces intense competition in 5G and wireless tech, but strong IP licensing supports moat.
STMicroelectronics N.V.
- Competes broadly in semiconductors with less pricing power and lower margins.
2. Capital Structure & Debt
QUALCOMM Incorporated
- Moderate debt-to-equity ratio at 0.7; interest coverage very strong at 20x.
STMicroelectronics N.V.
- Very low debt-to-equity at 0.12; virtually no interest expense risks.
3. Stock Volatility
QUALCOMM Incorporated
- Beta of 1.24 indicates moderate market sensitivity; price range wide but stable volume.
STMicroelectronics N.V.
- Beta higher at 1.32, suggesting more volatility; price range narrower but recent strong price gain.
4. Regulatory & Legal
QUALCOMM Incorporated
- Exposed to patent litigation and antitrust scrutiny globally due to licensing model.
STMicroelectronics N.V.
- Faces regulatory complexity across multiple regions but less IP litigation risk.
5. Supply Chain & Operations
QUALCOMM Incorporated
- Supply chain risks mitigated by diversified tech investments and US government contracts.
STMicroelectronics N.V.
- Supply chain more vulnerable due to broad geographic footprint and dependence on industrial customers.
6. ESG & Climate Transition
QUALCOMM Incorporated
- Increasing focus on sustainable tech; moderate risks from regulatory shifts.
STMicroelectronics N.V.
- Strong incentives to innovate in energy-efficient chips; ESG compliance critical for automotive segment.
7. Geopolitical Exposure
QUALCOMM Incorporated
- US-based with global sales; risks from US-China tech tensions persist.
STMicroelectronics N.V.
- European-headquartered with exposure to multiple trade zones; geopolitical fragmentation risk higher.
Which company shows a better risk-adjusted profile?
QUALCOMM’s most impactful risk is regulatory and legal exposure due to its IP licensing model. STMicroelectronics faces its greatest risk in market competition and supply chain vulnerabilities. Despite QUALCOMM’s legal pressures, its stronger financial metrics and stable capital structure yield a better risk-adjusted profile. STMicroelectronics’ weaker profitability and higher beta raise caution, despite a conservative debt position. The widening price range and recent robust volume in STMicroelectronics highlight market nervousness amid operational challenges.
Final Verdict: Which stock to choose?
QUALCOMM’s superpower lies in its robust capital efficiency and sustained value creation. Its declining profitability signals a point of vigilance, especially amid market cyclicality. It suits portfolios aiming for steady growth with a tolerance for tech sector volatility and premium valuation risks.
STMicroelectronics boasts a strategic moat in diversified semiconductor manufacturing and a solid balance sheet. It offers comparatively better liquidity and financial safety, albeit with weaker profitability. This aligns with investors favoring value-oriented plays with potential turnaround appeal in cyclical markets.
If you prioritize capital efficiency and proven value creation, QUALCOMM outshines as the compelling choice due to its superior ROIC and market positioning. However, if you seek relative stability and a lower-risk profile in semiconductor exposure, STMicroelectronics offers better safety despite current profitability challenges. Both require careful risk assessment given their distinct growth and financial profiles.
Disclaimer: Investment carries a risk of loss of initial capital. The past performance is not a reliable indicator of future results. Be sure to understand risks before making an investment decision.
Go Further
I encourage you to read the complete analyses of QUALCOMM Incorporated and STMicroelectronics N.V. to enhance your investment decisions: