Home > Comparison > Technology > QCOM vs SWKS
The strategic rivalry between QUALCOMM Incorporated and Skyworks Solutions, Inc. shapes the semiconductor sector’s innovation frontier. QUALCOMM operates as a capital-intensive leader in wireless technology licensing and chip development. In contrast, Skyworks focuses on high-margin, diversified semiconductor components for multiple end markets. This analysis pits sector dominance against niche specialization to identify which trajectory offers a superior risk-adjusted return for a diversified portfolio in today’s evolving technology landscape.
Table of contents
Companies Overview
QUALCOMM and Skyworks Solutions stand as pivotal players in the semiconductor industry shaping wireless technology’s future.
QUALCOMM: Wireless Technology Pioneer
QUALCOMM dominates as a wireless technology innovator. Its core revenue stems from licensing patents critical to 3G, 4G, and 5G standards and selling integrated circuits for wireless products. In 2026, it concentrates on expanding investments in 5G, AI, automotive, and IoT sectors through its Strategic Initiatives segment, reinforcing its technological leadership.
Skyworks Solutions: Semiconductor Component Specialist
Skyworks Solutions excels as a supplier of proprietary semiconductor components. It generates revenue by designing and marketing amplifiers, filters, and front-end modules for broad applications including smartphones, automotive, and industrial markets. Its 2026 strategy emphasizes broadening its product portfolio and geographic reach across the Americas, Asia-Pacific, and Europe to capture diverse end-market demands.
Strategic Collision: Similarities & Divergences
Both companies operate within semiconductors but embrace different philosophies. QUALCOMM leverages a patent-based licensing model and broad tech investments, while Skyworks focuses on manufacturing specialized components for multiple industries. They compete principally in wireless communications hardware. QUALCOMM’s diversified innovation contrasts with Skyworks’ targeted component expertise, defining distinct investment profiles grounded in scale and technological breadth.
Income Statement Comparison
This table dissects the core profitability and scalability of both corporate engines to reveal who dominates the bottom line:

| Metric | QUALCOMM Incorporated (QCOM) | Skyworks Solutions, Inc. (SWKS) |
|---|---|---|
| Revenue | 44.3B | 4.09B |
| Cost of Revenue | 19.7B | 2.40B |
| Operating Expenses | 12.2B | 1.18B |
| Gross Profit | 24.5B | 1.68B |
| EBITDA | 14.9B | 1.02B |
| EBIT | 13.3B | 554M |
| Interest Expense | 664M | 27M |
| Net Income | 5.54B | 477M |
| EPS | 5.06 | 3.09 |
| Fiscal Year | 2025 | 2025 |
Income Statement Analysis: The Bottom-Line Duel
This income statement comparison reveals the true efficiency and profitability dynamics powering each company’s financial engine.
QUALCOMM Incorporated Analysis
QUALCOMM’s revenue climbed steadily from $33.6B in 2021 to $44.3B in 2025, showing solid top-line momentum. Its gross margin remains strong at 55.4%, reflecting efficient cost control. Despite a net income decline to $5.54B in 2025, the firm maintains robust operating margins near 30%, signaling operational strength amid margin compression.
Skyworks Solutions, Inc. Analysis
Skyworks posted a declining revenue trend, falling from $5.11B in 2021 to $4.09B in 2025, indicating weakening sales momentum. Its gross margin at 41.2% is healthy but notably lower than QUALCOMM’s. Net income dropped sharply to $477M in 2025, with EBIT margin shrinking to 13.6%, highlighting pressure on profitability and operational efficiency.
Margin Power vs. Revenue Scale
QUALCOMM outperforms Skyworks with superior revenue growth and higher gross and EBIT margins. QUALCOMM’s scale and margin resilience offer a clearer fundamental advantage. Skyworks’ shrinking top line and profitability reveal structural challenges. For investors prioritizing margin strength and growth potential, QUALCOMM’s profile appears more compelling.
Financial Ratios Comparison
These vital ratios act as a diagnostic tool to expose the underlying fiscal health, valuation premiums, and capital efficiency of the companies compared below:
| Ratios | QUALCOMM Incorporated (QCOM) | Skyworks Solutions, Inc. (SWKS) |
|---|---|---|
| ROE | 26.13% | 8.29% |
| ROIC | 13.19% | 6.35% |
| P/E | 32.70 | 24.95 |
| P/B | 8.54 | 2.07 |
| Current Ratio | 2.82 | 2.33 |
| Quick Ratio | 2.10 | 1.76 |
| D/E (Debt-to-Equity) | 0.70 | 0.21 |
| Debt-to-Assets | 29.54% | 15.20% |
| Interest Coverage | 18.61 | 18.45 |
| Asset Turnover | 0.88 | 0.52 |
| Fixed Asset Turnover | 9.44 | 2.95 |
| Payout Ratio | 68.67% | 90.67% |
| Dividend Yield | 2.10% | 3.63% |
| Fiscal Year | 2025 | 2025 |
Efficiency & Valuation Duel: The Vital Signs
Ratios act as a company’s DNA, revealing hidden risks and operational excellence that drive long-term shareholder value.
QUALCOMM Incorporated
QUALCOMM delivers strong profitability with a ROE of 26.13% and a net margin of 12.51%. Its valuation appears stretched, trading at a P/E of 32.7 and P/B of 8.54. The company sustains shareholder returns through a 2.1% dividend yield, signaling confidence while also investing heavily in R&D for future growth.
Skyworks Solutions, Inc.
Skyworks posts a modest ROE of 8.29% and net margin of 11.67%, reflecting moderate profitability. Its valuation is more reasonable with a P/E of 24.95 and P/B of 2.07. Skyworks returns value via a higher 3.63% dividend yield, balancing income with reinvestment in operations and innovation.
Premium Valuation vs. Operational Safety
QUALCOMM shows superior profitability but trades at a premium, raising valuation risk. Skyworks offers a more conservative valuation with solid dividend income but weaker returns. Investors seeking growth may favor QUALCOMM’s aggressive edge, while those prioritizing income and valuation stability might lean toward Skyworks.
Which one offers the Superior Shareholder Reward?
I observe QUALCOMM (QCOM) pays a consistent dividend yield near 2.1% with a moderate payout ratio around 69%. Its free cash flow comfortably covers dividends, supporting sustainability. Skyworks (SWKS) offers a higher dividend yield near 3.6% but with a payout ratio exceeding 90%, signaling riskier sustainability. Both firms engage in buybacks; QCOM’s buyback intensity complements dividends, enhancing total return. SWKS’s aggressive payout threatens long-term flexibility despite attractive yield. Given QCOM’s balanced distribution and stronger cash flow coverage, I conclude QUALCOMM offers a more attractive and sustainable shareholder reward in 2026.
Comparative Score Analysis: The Strategic Profile
The radar chart reveals the fundamental DNA and trade-offs of QUALCOMM Incorporated and Skyworks Solutions, Inc., highlighting their core financial strengths and vulnerabilities:
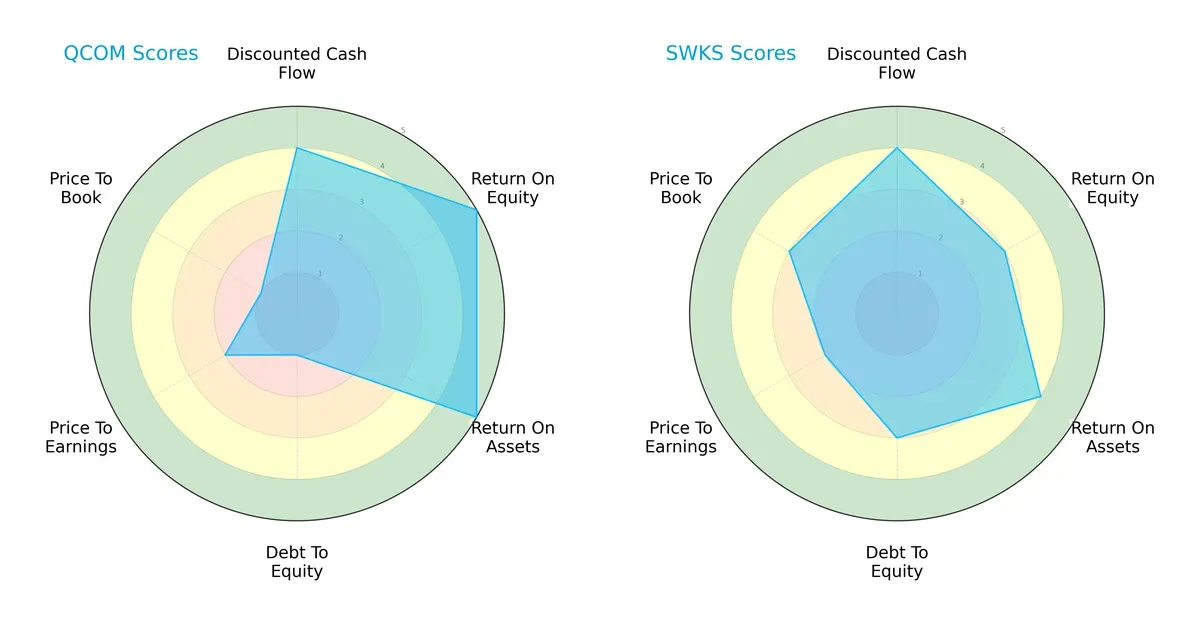
QUALCOMM exhibits superior profitability with higher ROE (5) and ROA (5) scores, indicating efficient capital and asset utilization. However, its debt-to-equity score is very unfavorable (1), signaling elevated financial risk. Skyworks offers a more balanced profile, maintaining moderate profitability (ROE 3, ROA 4) and a healthier debt position (score 3). Both share favorable DCF scores (4), but Skyworks’ valuation metrics (P/B 3) suggest a more reasonable market price compared to QUALCOMM’s weaker valuation scores (P/B 1). Overall, Skyworks relies on financial stability, while QUALCOMM leans on operational efficiency but takes on more leverage risk.
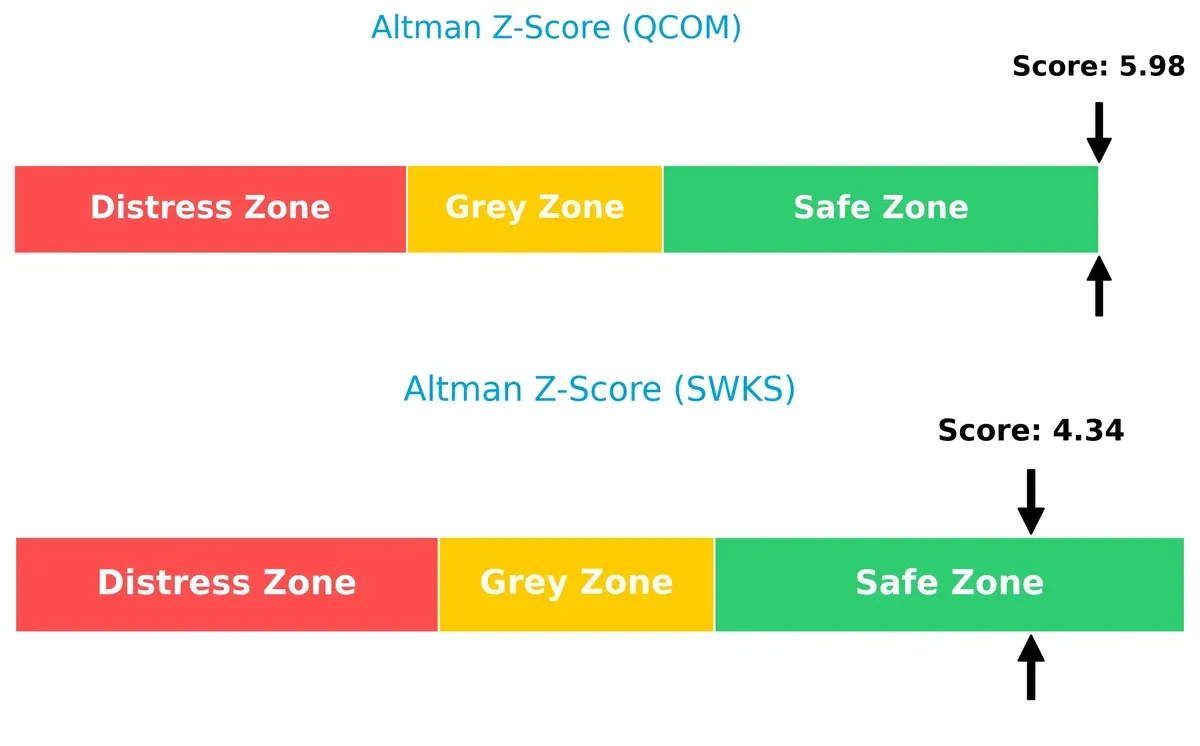
Bankruptcy Risk: Solvency Showdown
QUALCOMM’s Altman Z-Score of 5.98 versus Skyworks’ 4.34 places both firms firmly in the safe zone, but QUALCOMM shows a stronger buffer against bankruptcy risks in this cycle:
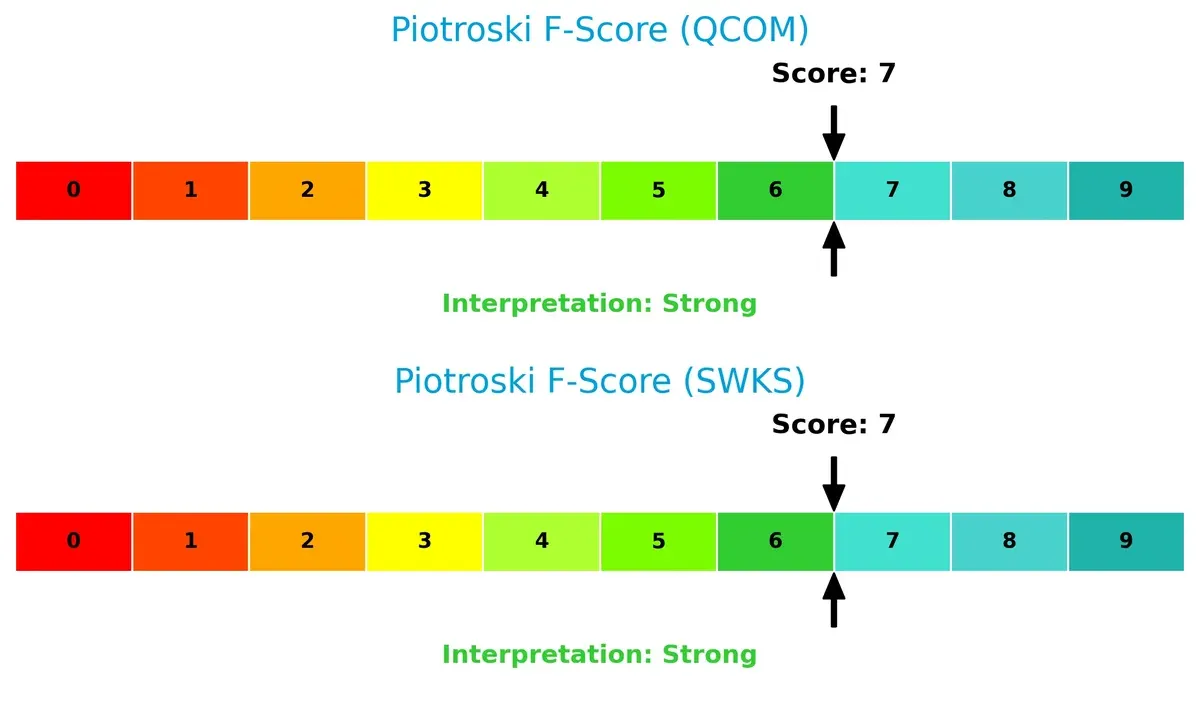
Financial Health: Quality of Operations
Both QUALCOMM and Skyworks score a robust 7 on the Piotroski F-Score, reflecting strong financial health and operational quality without immediate red flags:
How are the two companies positioned?
This section dissects the operational DNA of QUALCOMM and Skyworks by comparing their revenue distribution and internal dynamics. The goal is to confront their economic moats and identify the more resilient, sustainable competitive advantage in today’s market.
Revenue Segmentation: The Strategic Mix
The following visual comparison dissects how both QUALCOMM Incorporated and Skyworks Solutions, Inc. diversify their income streams and where their primary sector bets lie:
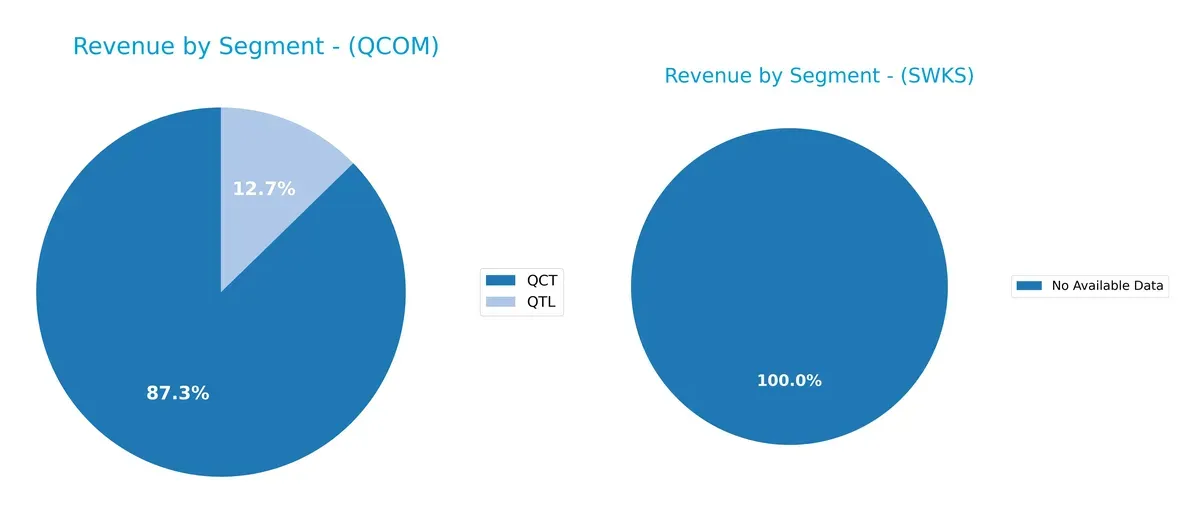
QUALCOMM’s revenue anchors heavily in the QCT segment at $38.4B, with QTL contributing $5.6B in 2025. Skyworks Solutions lacks available data to assess its segmentation. QUALCOMM’s concentration in chip technology and licensing highlights strong ecosystem lock-in but exposes it to concentration risk. This dominance underscores infrastructure leverage but limits diversification benefits compared to peers with broader mixes.
Strengths and Weaknesses Comparison
This table compares the strengths and weaknesses of QUALCOMM and Skyworks Solutions based on diversification, profitability, financials, innovation, global presence, and market share:
QUALCOMM Strengths
- Strong profitability with 12.5% net margin and 26.1% ROE
- Robust liquidity with current ratio 2.82
- High dividend yield at 2.1%
- Significant revenue from diverse global markets including China and Vietnam
- Strong fixed asset turnover at 9.44 indicating efficient asset use
Skyworks Strengths
- Solid net margin at 11.7%
- Favorable debt-to-equity and interest coverage ratios
- Higher dividend yield at 3.63%
- Diversified geographic sales with US dominance
- Lower price-to-book ratio indicating potential valuation appeal
QUALCOMM Weaknesses
- Unfavorable valuation multiples with PE 32.7 and PB 8.54
- Neutral debt leverage at 0.7 DE ratio
- Concentrated revenue exposure to China
- Moderate asset turnover at 0.88 limits efficiency
Skyworks Weaknesses
- Low ROE at 8.3% signals weak profitability on equity
- Neutral ROIC at 6.35% barely above WACC
- Higher neutral asset turnover at 0.52 and fixed asset turnover at 2.95
- Smaller global footprint with US-centric revenue
QUALCOMM excels in profitability and global diversification but faces valuation and regional concentration risks. Skyworks shows financial prudence and dividend strength but struggles with return on equity and more limited global reach. These factors shape each company’s strategic positioning amid competitive industry dynamics.
The Moat Duel: Analyzing Competitive Defensibility
A structural moat is the only shield protecting long-term profits from relentless competitive erosion. Here is the battle between two semiconductor players:
QUALCOMM Incorporated: Intellectual Property & Licensing Moat
QUALCOMM dominates through a robust patent portfolio and licensing agreements, generating a high ROIC above WACC. Despite declining ROIC trends, new 5G and IoT initiatives in 2026 could reinforce its moat.
Skyworks Solutions, Inc.: Product Differentiation & Niche Market Moat
Skyworks leans on specialized analog semiconductors and customer relationships, yet its ROIC lags below WACC. With shrinking margins and revenue, expanding into new markets in 2026 remains a critical challenge.
Patent Licensing vs. Niche Specialization: The Moat Verdict
QUALCOMM’s intellectual property moat is wider and more durable, delivering sustained value creation despite recent profitability dips. Skyworks’ narrower moat struggles to defend market share amid declining returns and intensifying competition.
Which stock offers better returns?
The past 12 months reveal sharp declines in both stocks, with Qualcomm showing steadier losses while Skyworks endures a more severe drop and heightened volatility.
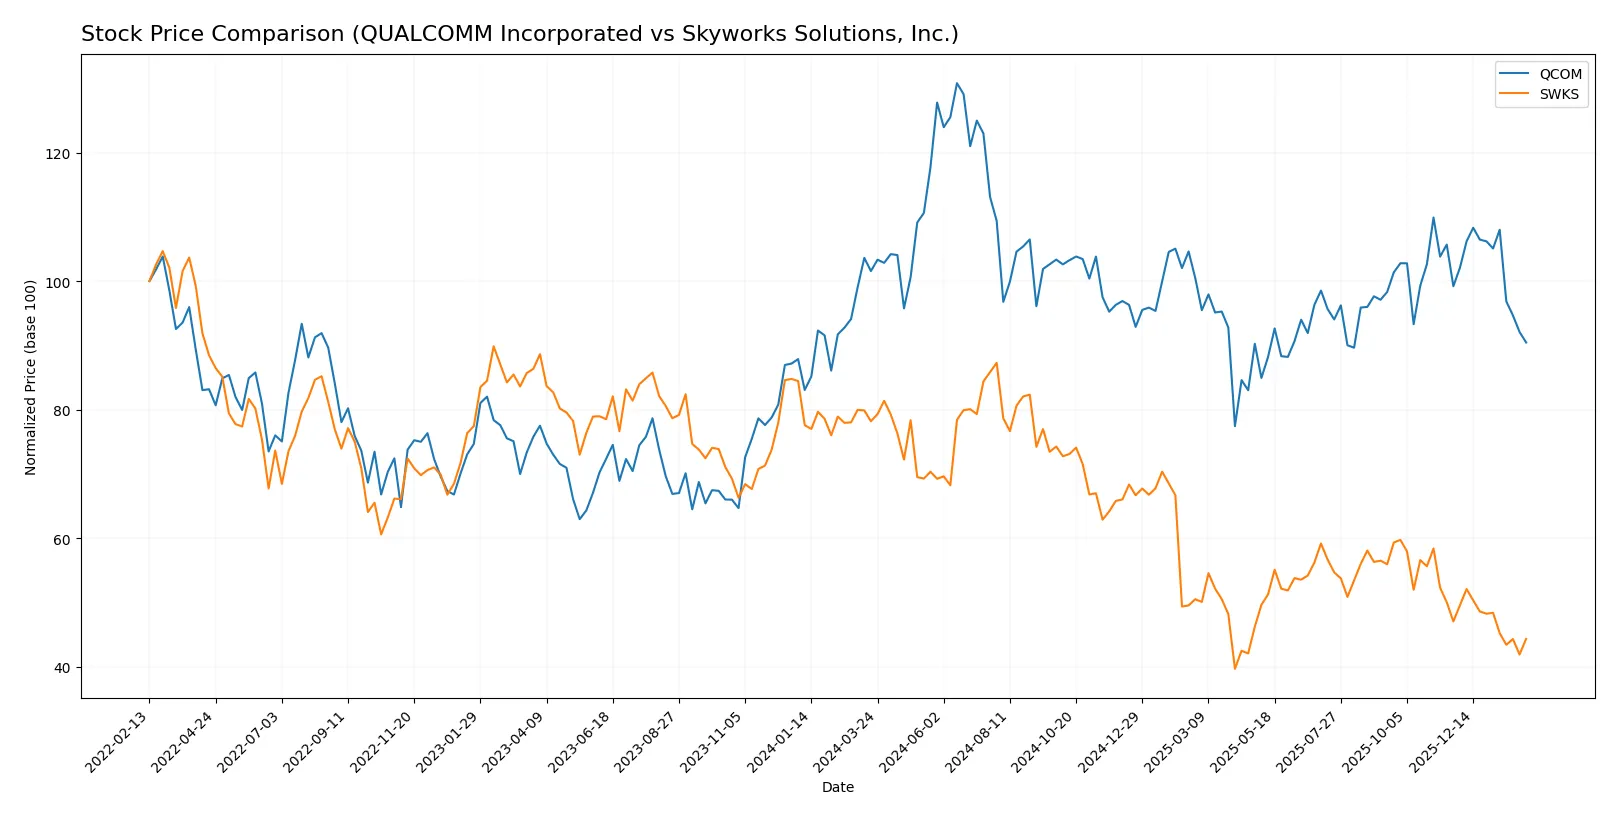
Trend Comparison
QUALCOMM Incorporated’s stock price fell 10.95% over the past year, marking a bearish trend with decelerating losses and a wide price range between 215.33 and 127.46. Recent months show continued decline but at a slower pace.
Skyworks Solutions, Inc. dropped sharply by 43.31% in the same period, confirming a bearish trend with deceleration. The stock’s volatility remains high, with prices swinging between 116.18 and 52.78, and recent losses persisting.
Comparing trends, QUALCOMM outperformed Skyworks, delivering the smaller decline and a less volatile downward trajectory over the past year.
Target Prices
Analysts present a mixed but generally positive outlook for QUALCOMM Incorporated and Skyworks Solutions, Inc.
| Company | Target Low | Target High | Consensus |
|---|---|---|---|
| QUALCOMM Incorporated | 160 | 210 | 181.43 |
| Skyworks Solutions, Inc. | 58 | 140 | 77.36 |
QUALCOMM’s target consensus at 181.43 indicates upside from its current price of 148.89, reflecting confidence in its semiconductor leadership. Skyworks shows a wider range, with consensus modestly above its current 59, suggesting cautious optimism.

Don’t Let Luck Decide Your Entry Point
Optimize your entry points with our advanced ProRealTime indicators. You’ll get efficient buy signals with precise price targets for maximum performance. Start outperforming now!
How do institutions grade them?
The following tables summarize the latest grades assigned by major financial institutions for each company:
QUALCOMM Incorporated Grades
This table shows recent grade updates from several notable grading companies for QUALCOMM Incorporated.
| Grading Company | Action | New Grade | Date |
|---|---|---|---|
| Cantor Fitzgerald | Maintain | Neutral | 2026-02-02 |
| UBS | Maintain | Neutral | 2026-01-26 |
| Mizuho | Maintain | Neutral | 2026-01-26 |
| Mizuho | Downgrade | Neutral | 2026-01-09 |
| UBS | Maintain | Neutral | 2025-11-06 |
| Piper Sandler | Maintain | Overweight | 2025-11-06 |
| Wells Fargo | Maintain | Underweight | 2025-11-06 |
| Mizuho | Maintain | Outperform | 2025-11-06 |
| Rosenblatt | Maintain | Buy | 2025-11-06 |
| B of A Securities | Maintain | Buy | 2025-11-06 |
Skyworks Solutions, Inc. Grades
Below are the most recent grades from reputable financial institutions for Skyworks Solutions, Inc.
| Grading Company | Action | New Grade | Date |
|---|---|---|---|
| Keybanc | Maintain | Overweight | 2026-02-04 |
| JP Morgan | Maintain | Neutral | 2026-02-04 |
| Benchmark | Maintain | Hold | 2026-02-04 |
| Stifel | Maintain | Hold | 2026-02-04 |
| Citigroup | Maintain | Neutral | 2026-02-04 |
| Morgan Stanley | Maintain | Equal Weight | 2026-02-02 |
| B. Riley Securities | Maintain | Neutral | 2026-01-26 |
| Mizuho | Maintain | Neutral | 2026-01-26 |
| Susquehanna | Maintain | Neutral | 2026-01-22 |
| UBS | Maintain | Neutral | 2026-01-20 |
Which company has the best grades?
QUALCOMM shows a wider range of grades including several Buy and Outperform ratings, suggesting stronger institutional conviction. Skyworks’ grades cluster around Neutral and Hold, indicating more caution. This divergence could influence investor sentiment regarding growth prospects and risk.
Risks specific to each company
The following categories identify critical pressure points and systemic threats facing QUALCOMM Incorporated and Skyworks Solutions, Inc. in the 2026 market environment:
1. Market & Competition
QUALCOMM Incorporated
- Dominates 5G chipset licensing but faces patent challenges and fierce competition from MediaTek and Apple.
Skyworks Solutions, Inc.
- Competes in a highly fragmented market with diversified product lines but limited scale compared to QUALCOMM.
2. Capital Structure & Debt
QUALCOMM Incorporated
- Moderate debt-to-equity ratio (0.7) with strong interest coverage; balance sheet is stable but leverage is notable.
Skyworks Solutions, Inc.
- Conservative leverage (debt-to-equity 0.21) enhances financial flexibility and reduces risk in downturns.
3. Stock Volatility
QUALCOMM Incorporated
- Beta of 1.238 suggests moderate sensitivity to market swings; trading range relatively wide (120.8-205.95).
Skyworks Solutions, Inc.
- Slightly higher beta (1.317) implies higher volatility risk, with a broad trading range (47.93-90.9).
4. Regulatory & Legal
QUALCOMM Incorporated
- Subject to ongoing antitrust scrutiny and patent litigation, creating regulatory uncertainty.
Skyworks Solutions, Inc.
- Faces fewer regulatory challenges but must comply with export controls and IP protections globally.
5. Supply Chain & Operations
QUALCOMM Incorporated
- Complex global supply chain with risk exposure to semiconductor shortages and geopolitical tensions.
Skyworks Solutions, Inc.
- Smaller scale supply chain but still vulnerable to component scarcity and production disruptions.
6. ESG & Climate Transition
QUALCOMM Incorporated
- Invests in sustainable technologies and climate initiatives but must navigate increasing ESG compliance costs.
Skyworks Solutions, Inc.
- Progressive on ESG but less resource-intensive operations may reduce transition risks.
7. Geopolitical Exposure
QUALCOMM Incorporated
- High exposure to US-China tensions due to licensing and manufacturing footprint.
Skyworks Solutions, Inc.
- Also exposed to geopolitical risks but with less direct licensing dependency in China.
Which company shows a better risk-adjusted profile?
QUALCOMM’s biggest risk is regulatory and legal pressures from antitrust investigations and patent disputes. Skyworks faces elevated stock volatility and competitive pressures but maintains a more conservative capital structure. I view QUALCOMM as having a stronger financial foundation but higher systemic risk, while Skyworks offers a steadier risk profile with less leverage. Recent data shows QUALCOMM’s solid liquidity and profitability contrast with its regulatory vulnerability. Overall, Skyworks edges out slightly for risk-adjusted stability despite smaller scale.
Final Verdict: Which stock to choose?
QUALCOMM’s superpower lies in its strong economic moat, driven by high returns on invested capital well above its cost of capital. Its robust cash generation and operational efficiency stand out. The point of vigilance is its declining profitability trend, which could signal future margin pressure. It suits portfolios seeking aggressive growth with a focus on technological leadership.
Skyworks’ strategic moat centers on its niche in analog semiconductors and recurring revenue stability. It offers better financial safety, marked by lower leverage and consistent free cash flow yield. However, its value creation is currently negative, reflecting challenges in profitability. It fits well with investors seeking GARP profiles balancing growth potential with moderate risk.
If you prioritize sustained value creation and operational scale, QUALCOMM outshines due to its superior capital efficiency and market presence. However, if you seek more stability and less capital risk, Skyworks offers better downside protection despite weaker growth metrics. Both represent distinct analytical scenarios for different investor risk appetites and growth preferences.
Disclaimer: Investment carries a risk of loss of initial capital. The past performance is not a reliable indicator of future results. Be sure to understand risks before making an investment decision.
Go Further
I encourage you to read the complete analyses of QUALCOMM Incorporated and Skyworks Solutions, Inc. to enhance your investment decisions: