In the fast-evolving semiconductor industry, QUALCOMM Incorporated and Silicon Laboratories Inc. stand out as key innovators shaping wireless and mixed-signal technologies. QUALCOMM leads with foundational wireless communication patents and broad 5G solutions, while Silicon Labs focuses on analog-intensive mixed-signal products for IoT applications. This comparison explores their market positions and innovation strategies to help you decide which company offers the most compelling investment opportunity today.
Table of contents
Companies Overview
I will begin the comparison between QUALCOMM Incorporated and Silicon Laboratories Inc. by providing an overview of these two companies and their main differences.
QUALCOMM Incorporated Overview
QUALCOMM Incorporated focuses on developing and commercializing foundational wireless technologies globally. It operates through three segments: Qualcomm CDMA Technologies (QCT), Qualcomm Technology Licensing (QTL), and Qualcomm Strategic Initiatives (QSI). The company supplies integrated circuits and software for wireless communications, licenses intellectual property for wireless standards, and invests in emerging technologies such as 5G and AI. Headquartered in San Diego, CA, QUALCOMM employs around 49K people.
Silicon Laboratories Inc. Overview
Silicon Laboratories Inc. is a fabless semiconductor company that provides analog-intensive mixed-signal solutions, including wireless microcontrollers and sensor products. Its offerings target IoT applications like smart home, industrial automation, and medical instrumentation. Founded in 1996 and based in Austin, TX, Silicon Labs sells through direct and indirect channels and employs approximately 1.9K people.
Key similarities and differences
Both companies operate in the semiconductor industry and focus on wireless and IoT technologies. QUALCOMM has a broader business model including technology licensing and strategic investments, while Silicon Labs concentrates on analog and mixed-signal semiconductor products for IoT applications. QUALCOMM is much larger by market cap and workforce, reflecting its extensive product and service diversification compared to Silicon Labs’ more specialized approach.
Income Statement Comparison
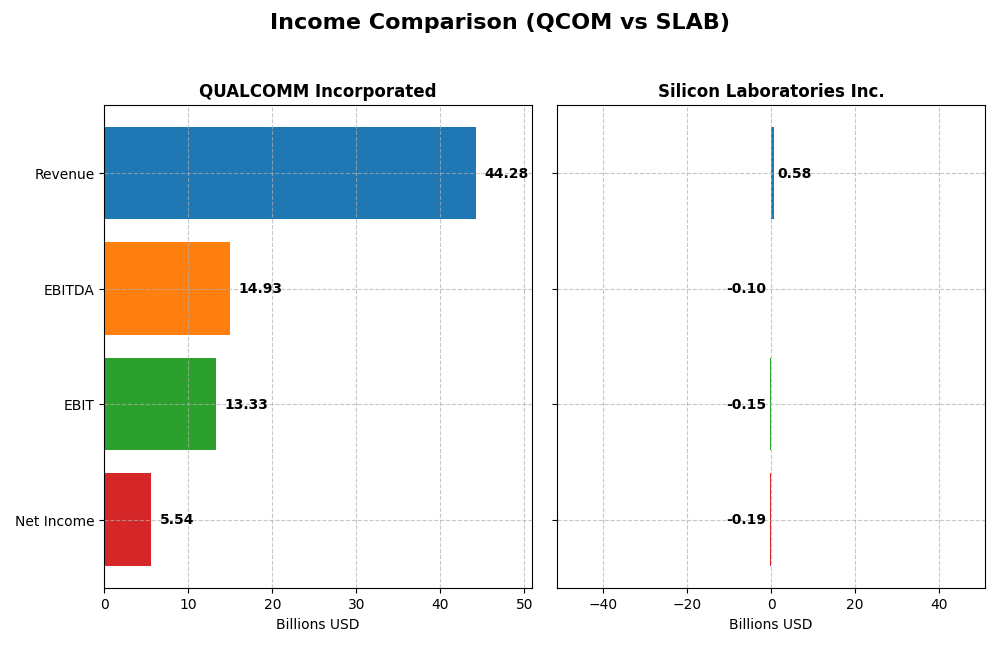
The table below presents a side-by-side comparison of key income statement metrics for QUALCOMM Incorporated and Silicon Laboratories Inc. for their most recent fiscal years.
| Metric | QUALCOMM Incorporated | Silicon Laboratories Inc. |
|---|---|---|
| Market Cap | 175.3B | 5.0B |
| Revenue | 44.3B | 584M |
| EBITDA | 14.9B | -105M |
| EBIT | 13.3B | -154M |
| Net Income | 5.54B | -191M |
| EPS | 5.06 | -5.93 |
| Fiscal Year | 2025 | 2024 |
Income Statement Interpretations
QUALCOMM Incorporated
QUALCOMM’s revenue grew steadily from $33.6B in 2021 to $44.3B in 2025, a 31.93% increase over five years. Net income showed volatility, peaking at $12.9B in 2022 before declining to $5.5B in 2025. Gross and EBIT margins remained favorable, around 55% and 30% respectively, but net margin contracted notably in 2025. The latest year saw strong revenue and EBIT growth but a sharp net income decline.
Silicon Laboratories Inc.
Silicon Labs experienced revenue fluctuations, rising from $511M in 2020 to a peak of $1.02B in 2022, then dropping to $584M in 2024. Net income shifted from positive $21M in 2020 to losses of $191M in 2024. Gross margins were stable near 53%, but EBIT and net margins were unfavorable, with significant negative swings. The most recent year showed a steep revenue decline and deepened net loss, reflecting operational challenges.
Which one has the stronger fundamentals?
QUALCOMM demonstrates stronger fundamentals with consistent revenue growth, robust gross and EBIT margins, and a favorable overall income statement evaluation despite net income volatility. Silicon Labs faces significant profitability challenges, marked by negative EBIT and net margins and worsening net losses. Thus, QUALCOMM’s income statement metrics reflect a more stable and favorable financial position over the observed period.
Financial Ratios Comparison
The table below presents a comparison of key financial ratios for QUALCOMM Incorporated (QCOM) and Silicon Laboratories Inc. (SLAB) based on their most recent fiscal year data.
| Ratios | QUALCOMM Incorporated (2025) | Silicon Laboratories Inc. (2024) |
|---|---|---|
| ROE | 26.13% | -17.69% |
| ROIC | 13.19% | -14.71% |
| P/E | 32.70 | -21.53 |
| P/B | 8.54 | 3.81 |
| Current Ratio | 2.82 | 6.15 |
| Quick Ratio | 2.10 | 5.07 |
| D/E | 0.70 | 0.01 |
| Debt-to-Assets | 29.54% | 1.27% |
| Interest Coverage | 18.61 | -126.33 |
| Asset Turnover | 0.88 | 0.48 |
| Fixed Asset Turnover | 9.44 | 4.42 |
| Payout Ratio | 68.67% | 0% |
| Dividend Yield | 2.10% | 0% |
Interpretation of the Ratios
QUALCOMM Incorporated
QUALCOMM shows strong financial ratios overall with favorable net margin (12.51%), ROE (26.13%), and ROIC (13.19%), highlighting efficient profitability and capital use. Liquidity is robust, supported by a current ratio of 2.82. However, valuation ratios like P/E (32.7) and P/B (8.54) are unfavorable, possibly reflecting high market expectations. The company pays a dividend with a 2.1% yield, indicating steady shareholder returns, supported by good coverage and balanced payout risks.
Silicon Laboratories Inc.
Silicon Laboratories presents several unfavorable metrics, including negative net margin (-32.69%), ROE (-17.69%), and ROIC (-14.71%), suggesting operational and profitability challenges. While the quick ratio (5.07) and low debt levels are favorable, other liquidity and interest coverage ratios are weak. The company does not pay dividends, likely due to ongoing losses and reinvestment in R&D, reflecting a focus on growth over immediate shareholder returns.
Which one has the best ratios?
QUALCOMM demonstrates a more favorable financial profile, with stronger profitability, liquidity, and capital efficiency ratios despite some valuation concerns. Silicon Laboratories faces significant challenges with negative profitability and coverage ratios, contributing to an overall unfavorable evaluation. Based on these metrics, QUALCOMM exhibits better financial health and stability.
Strategic Positioning
This section compares the strategic positioning of QUALCOMM and Silicon Laboratories, focusing on Market position, Key segments, and Exposure to technological disruption:
QUALCOMM
- Leading global semiconductor firm with strong market cap and competitive presence in wireless tech.
- Diversified segments: QCT (integrated circuits), QTL (technology licensing), and QSI (investments).
- Operates in foundational wireless tech, investing in 5G, AI, automotive, IoT, and cloud industries.
Silicon Laboratories
- Smaller market cap, operating in niche analog-intensive mixed-signal semiconductor markets globally.
- Focused on IoT-related products: wireless microcontrollers and sensors for industrial and commercial uses.
- Primarily exposed to IoT applications like smart home, industrial automation, and medical instrumentation.
QUALCOMM vs Silicon Laboratories Positioning
QUALCOMM shows a diversified approach with multiple business segments and technology investments, providing scale and breadth. Silicon Laboratories concentrates on analog mixed-signal and IoT niches, offering focused specialization but less market breadth.
Which has the best competitive advantage?
QUALCOMM demonstrates a slightly favorable moat with value creation despite declining profitability, while Silicon Laboratories faces a very unfavorable moat with value destruction and steep profitability decline. This indicates QUALCOMM holds a stronger competitive advantage.
Stock Comparison
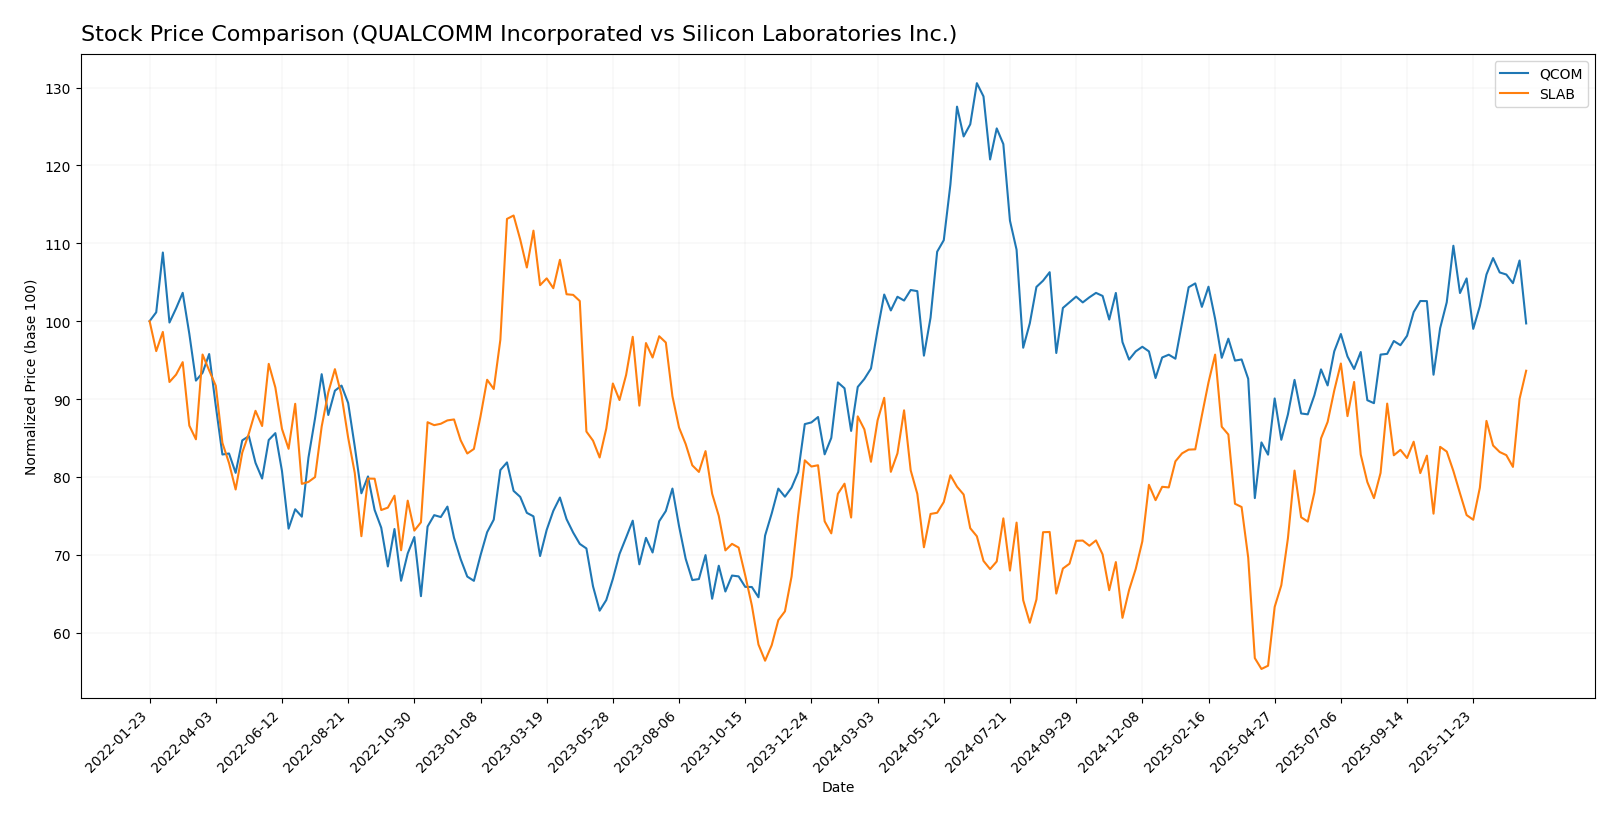
The stock prices of QUALCOMM Incorporated and Silicon Laboratories Inc. have exhibited notable bullish trends over the past 12 months, with distinct price dynamics and volume behaviors influencing their market performance.
Trend Analysis
QUALCOMM Incorporated’s stock showed a 6.16% increase over the past 12 months, indicating a bullish trend with acceleration. The price fluctuated between 127.46 and 215.33, with a recent downward trend of -9.09% from November 2025 to January 2026.
Silicon Laboratories Inc. experienced a stronger bullish trend with a 14.27% rise over the past year and acceleration. Its stock ranged from 89.82 to 155.33, and recently gained 15.94% with an increasing slope in the same period.
Comparing both, Silicon Laboratories delivered the highest market performance with a 14.27% increase versus QUALCOMM’s 6.16%, reflecting stronger momentum and recent price acceleration.
Target Prices
The current analyst consensus provides a clear target range for these semiconductor companies, reflecting moderate growth expectations.
| Company | Target High | Target Low | Consensus |
|---|---|---|---|
| QUALCOMM Incorporated | 210 | 165 | 185.71 |
| Silicon Laboratories Inc. | 165 | 130 | 151.67 |
Analysts expect QUALCOMM’s stock to appreciate moderately above its current price of $163.72, while Silicon Laboratories’ consensus target closely matches its current price of $151.79, indicating a balanced outlook.
Analyst Opinions Comparison
This section compares analysts’ ratings and grades for QUALCOMM Incorporated and Silicon Laboratories Inc.:
Rating Comparison
QUALCOMM Incorporated Rating
- Rating: B+ with a very favorable status indicating strong overall financial health.
- Discounted Cash Flow Score: 4, suggesting favorable valuation based on future cash flows.
- ROE Score: 5, very favorable, showing excellent profit generation from equity.
- ROA Score: 5, very favorable, indicating highly effective asset utilization.
- Debt To Equity Score: 1, very unfavorable, highlighting high financial risk due to debt.
- Overall Score: 3, moderate overall performance rating.
Silicon Laboratories Inc. Rating
- Rating: C- marked as very favorable, though with lower scores overall.
- Discounted Cash Flow Score: 2, indicating a moderate valuation outlook.
- ROE Score: 1, very unfavorable, reflecting weak profit generation efficiency.
- ROA Score: 1, very unfavorable, showing poor asset efficiency.
- Debt To Equity Score: 1, very unfavorable, similarly indicating high financial risk.
- Overall Score: 1, very unfavorable overall performance rating.
Which one is the best rated?
Based strictly on provided data, QUALCOMM holds a stronger rating with a B+ and higher scores in discounted cash flow, ROE, and ROA. Silicon Laboratories shows weaker financial metrics and a lower overall score, indicating a less favorable rating.
Scores Comparison
The comparison of the Altman Z-Score and Piotroski Score for both companies is as follows:
QCOM Scores
- Altman Z-Score: 6.37, indicating a safe zone with low bankruptcy risk.
- Piotroski Score: 7, classified as strong financial health.
SLAB Scores
- Altman Z-Score: 18.02, indicating a safe zone with very low bankruptcy risk.
- Piotroski Score: 4, classified as average financial health.
Which company has the best scores?
SLAB has a significantly higher Altman Z-Score, suggesting stronger bankruptcy safety. QCOM has a higher Piotroski Score, indicating stronger overall financial health. Each company leads in different score categories.
Grades Comparison
Here is a comparison of the latest reliable grades for QUALCOMM Incorporated and Silicon Laboratories Inc.:
QUALCOMM Incorporated Grades
The following table summarizes recent grades assigned by reputable financial institutions to QUALCOMM Incorporated:
| Grading Company | Action | New Grade | Date |
|---|---|---|---|
| Mizuho | Downgrade | Neutral | 2026-01-09 |
| Rosenblatt | Maintain | Buy | 2025-11-06 |
| B of A Securities | Maintain | Buy | 2025-11-06 |
| Mizuho | Maintain | Outperform | 2025-11-06 |
| Wells Fargo | Maintain | Underweight | 2025-11-06 |
| Piper Sandler | Maintain | Overweight | 2025-11-06 |
| UBS | Maintain | Neutral | 2025-11-06 |
| JP Morgan | Maintain | Overweight | 2025-11-04 |
| Citigroup | Maintain | Neutral | 2025-10-28 |
| Rosenblatt | Maintain | Buy | 2025-10-28 |
QUALCOMM’s grades mostly range from Neutral to Buy and Outperform, with a recent downgrade to Neutral by Mizuho, reflecting some mixed but generally positive sentiment.
Silicon Laboratories Inc. Grades
The following table shows recent grades from recognized grading companies for Silicon Laboratories Inc.:
| Grading Company | Action | New Grade | Date |
|---|---|---|---|
| Morgan Stanley | Maintain | Equal Weight | 2025-08-06 |
| Susquehanna | Maintain | Neutral | 2025-08-06 |
| Barclays | Maintain | Equal Weight | 2025-08-05 |
| Susquehanna | Maintain | Neutral | 2025-07-22 |
| Stifel | Maintain | Buy | 2025-07-18 |
| Keybanc | Maintain | Overweight | 2025-07-08 |
| Benchmark | Maintain | Buy | 2025-05-27 |
| Benchmark | Maintain | Buy | 2025-05-14 |
| Susquehanna | Maintain | Neutral | 2025-05-14 |
| Needham | Maintain | Buy | 2025-05-14 |
Silicon Laboratories exhibits a mixture of Buy, Overweight, Neutral, and Equal Weight ratings, indicating a cautious but generally supportive outlook.
Which company has the best grades?
QUALCOMM holds a stronger consensus with a majority of Buy and Outperform ratings, despite a recent downgrade, while Silicon Laboratories shows more Neutral and Equal Weight ratings with fewer Buy calls. This difference suggests QUALCOMM may be perceived as having better growth or value potential, which could influence investor preference toward more optimistic expectations.
Strengths and Weaknesses
Below is a comparison of key strengths and weaknesses for QUALCOMM Incorporated (QCOM) and Silicon Laboratories Inc. (SLAB) based on the most recent financial and operational data.
| Criterion | QUALCOMM Incorporated (QCOM) | Silicon Laboratories Inc. (SLAB) |
|---|---|---|
| Diversification | Strong with multiple segments: QCT $38.4B, QTL $5.6B in 2025 | More concentrated, mainly Industrial & Commercial $339M in 2024 |
| Profitability | Favorable margins: net margin 12.5%, ROIC 13.2%, ROE 26.1% | Unfavorable: net margin -32.7%, ROIC -14.7%, ROE -17.7% |
| Innovation | High innovation with sustained R&D in semiconductor tech | Innovation challenged, reflected in value destruction and declining ROIC |
| Global presence | Significant global footprint with large market share in chipsets | More niche and smaller scale global reach |
| Market Share | Large market share in mobile and wireless tech | Smaller market share in industrial and IoT segments |
Key takeaways: QUALCOMM is a diversified, profitable leader with a strong global presence, though its profitability has slightly declined. Silicon Laboratories faces significant challenges, showing value destruction and weaker financial health, making it a riskier investment at present.
Risk Analysis
Below is a comparative table outlining key risk factors for QUALCOMM Incorporated (QCOM) and Silicon Laboratories Inc. (SLAB) as of the most recent fiscal years.
| Metric | QUALCOMM Incorporated (QCOM) | Silicon Laboratories Inc. (SLAB) |
|---|---|---|
| Market Risk | Beta 1.21, moderate exposure to semiconductor cyclicality | Beta 1.55, higher volatility reflecting smaller market cap and niche focus |
| Debt level | Debt/Equity 0.7 (neutral), Debt/Assets 29.5% (favorable) | Debt/Equity 0.01 (favorable), Debt/Assets 1.3% (favorable) |
| Regulatory Risk | Moderate, given global wireless licensing and IP exposure | Moderate, due to international sales and technology standards |
| Operational Risk | Low, diversified segments and strong operational metrics | Moderate, impacted by recent negative profitability and asset turnover |
| Environmental Risk | Moderate, semiconductor industry environmental practices under scrutiny | Moderate, IoT and electronics demand compliance with environmental regulations |
| Geopolitical Risk | High, exposure to US-China tensions affecting supply chain and licensing | High, significant international sales and supply chain dependencies |
Synthesis: QUALCOMM shows stronger financial health with favorable debt levels and operational efficiency but faces notable geopolitical and regulatory risks linked to global wireless technology markets. Silicon Laboratories has a safer debt profile but suffers from negative profitability and operational inefficiencies, increasing its operational and market risks. Geopolitical tensions remain a key concern for both companies.
Which Stock to Choose?
QUALCOMM Incorporated (QCOM) shows a generally favorable income evolution with 13.66% revenue growth in 2025 and strong profitability metrics, including a 26.13% ROE and 12.51% net margin. Its debt levels are moderate, with a net debt to EBITDA of 0.62, supported by a solid current ratio of 2.82 and a very favorable overall rating of B+.
Silicon Laboratories Inc. (SLAB) has experienced unfavorable income trends, including a -25.29% revenue decline in 2024 and negative profitability with a -32.69% net margin and -17.69% ROE. Despite very low debt (net debt to EBITDA at 0.01) and a strong current ratio of 6.15, its overall financial ratios and rating of C- signal challenges in value creation and operational efficiency.
Investors focused on stability and strong value creation may find QCOM’s favorable rating, consistent profitability, and positive income trend more aligned with their profile. Conversely, those with a higher risk tolerance and interest in turnaround or growth potential might consider SLAB’s recent price acceleration despite its unfavorable financial metrics and income statement performance.
Disclaimer: Investment carries a risk of loss of initial capital. The past performance is not a reliable indicator of future results. Be sure to understand risks before making an investment decision.
Go Further
I encourage you to read the complete analyses of QUALCOMM Incorporated and Silicon Laboratories Inc. to enhance your investment decisions: