QUALCOMM Incorporated and Qnity Electronics, Inc. both operate in the dynamic semiconductor industry, a cornerstone of modern technology innovation. QUALCOMM is a seasoned leader with a broad portfolio spanning wireless communications and advanced chip technologies, while Qnity Electronics, a newer market entrant, specializes in electronic solutions for semiconductor manufacturing. This article will analyze these companies to reveal which offers the most compelling opportunity for investors seeking growth and stability.

Table of contents
Companies Overview
I will begin the comparison between QUALCOMM and Qnity Electronics by providing an overview of these two companies and their main differences.
QUALCOMM Overview
QUALCOMM Incorporated is a leading technology company specializing in the development and commercialization of foundational wireless industry technologies. Operating through segments such as Qualcomm CDMA Technologies and Qualcomm Technology Licensing, it provides integrated circuits, software, and intellectual property licenses primarily for 3G/4G/5G wireless communications. Headquartered in San Diego, CA, QUALCOMM is a major player in semiconductors with a market cap of $175B.
Qnity Electronics Overview
Qnity Electronics, Inc. focuses on electronic solutions and advanced materials for semiconductor chip manufacturing. Formerly Novus SpinCo 1, the company rebranded in April 2025 and is based in Wilmington, DE. With a market cap of approximately $19.9B, it operates within the semiconductor industry, providing specialized materials rather than broad wireless technology solutions like QUALCOMM.
Key similarities and differences
Both QUALCOMM and Qnity Electronics operate in the semiconductor industry and serve the technology sector in the US. QUALCOMM’s business model centers on wireless technology development, licensing, and strategic investments, while Qnity Electronics concentrates on electronic materials for chip manufacturing. QUALCOMM’s market cap and employee base are significantly larger, reflecting its broader market reach and diversified operations compared to Qnity’s more specialized focus.
Income Statement Comparison
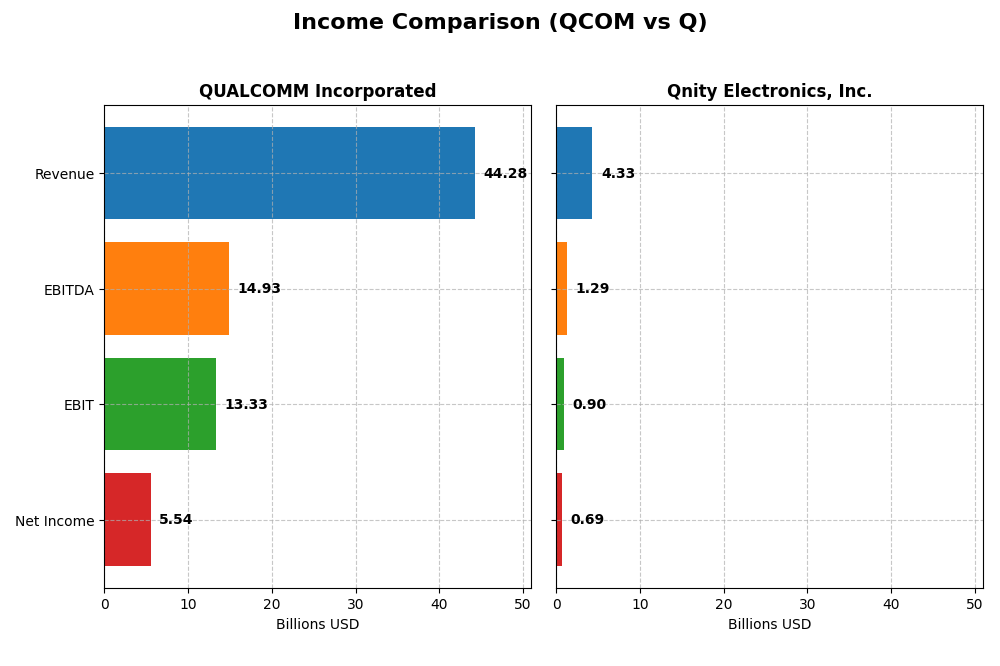
The following table presents a side-by-side comparison of key income statement figures for QUALCOMM Incorporated and Qnity Electronics, Inc. based on their most recent fiscal year data.
| Metric | QUALCOMM Incorporated | Qnity Electronics, Inc. |
|---|---|---|
| Market Cap | 175.4B | 19.9B |
| Revenue | 44.3B | 4.3B |
| EBITDA | 14.9B | 1.3B |
| EBIT | 13.3B | 898M |
| Net Income | 5.5B | 693M |
| EPS | 5.06 | 3.31 |
| Fiscal Year | 2025 | 2024 |
Income Statement Interpretations
QUALCOMM Incorporated
QUALCOMM’s revenue increased from $33.6B in 2021 to $44.3B in 2025, reflecting a 31.9% growth over five years. However, net income declined by 38.7% over the same period, falling to $5.5B in 2025. Gross and EBIT margins remained favorable at 55.4% and 30.1%, respectively. The latest year saw revenue growth of 13.7%, but net margin and EPS dropped sharply, signaling margin pressure.
Qnity Electronics, Inc.
Qnity Electronics’ revenue dropped by 8.8% from $4.8B in 2022 to $4.3B in 2024, with net income also declining by 10.5% to $693M. Despite this, gross margin stayed favorable at 46.1%, and EBIT margin improved to 20.7%. The latest fiscal year showed moderate revenue growth of 7.4% and strong net margin and EPS growth above 27%, indicating recent operational improvements.
Which one has the stronger fundamentals?
QUALCOMM exhibits higher absolute revenue and margins, with favorable gross and EBIT margins and strong revenue growth. However, its net income and margin trends are declining, raising concerns about profitability. Qnity Electronics shows lower scale but recent profitability and margin improvements, supported by solid net margin and EPS growth. Both have favorable income statement evaluations, with QUALCOMM slightly stronger in scale and margin stability.
Financial Ratios Comparison
The table below presents the most recent key financial ratios for QUALCOMM Incorporated and Qnity Electronics, Inc., enabling a straightforward comparison of their financial health and performance.
| Ratios | QUALCOMM Incorporated (QCOM) | Qnity Electronics, Inc. (Q) |
|---|---|---|
| ROE | 26.13% | 6.51% |
| ROIC | 13.19% | 5.92% |
| P/E | 32.70 | 28.80 |
| P/B | 8.54 | 1.88 |
| Current Ratio | 2.82 | 1.77 |
| Quick Ratio | 2.10 | 1.06 |
| D/E | 0.70 | 0.02 |
| Debt-to-Assets | 29.54% | 1.56% |
| Interest Coverage | 18.61 | 3.03 |
| Asset Turnover | 0.88 | 0.35 |
| Fixed Asset Turnover | 9.44 | 2.59 |
| Payout ratio | 68.67% | 0% |
| Dividend yield | 2.10% | 0% |
Interpretation of the Ratios
QUALCOMM Incorporated
QUALCOMM shows strong profitability with favorable net margin (12.51%) and return on equity (26.13%), supported by a solid return on invested capital (13.19%). Liquidity ratios are robust, with a current ratio of 2.82 and quick ratio of 2.1, indicating good short-term financial health. Dividend yield at 2.1% is favorable, with payouts likely sustainable given coverage by free cash flow, but valuation multiples like PE (32.7) and PB (8.54) are less attractive.
Qnity Electronics, Inc.
Qnity Electronics displays mixed results with a favorable net margin (15.99%) but low return on equity (6.51%) and moderate return on invested capital (5.92%). Liquidity is acceptable, with a current ratio of 1.77 and quick ratio of 1.06. The company does not pay dividends, possibly due to its recent IPO and focus on reinvestment, as indicated by low asset turnover (0.35) and a cautious debt profile. Valuation metrics such as PE (28.8) and dividend yield (0%) suggest limited income returns.
Which one has the best ratios?
QUALCOMM’s ratios are globally more favorable, with a higher proportion of strong profitability, liquidity, and solvency indicators, despite some valuation concerns. Qnity Electronics, while showing decent profitability and liquidity, suffers from weaker returns and lack of dividend distribution, reflecting a more cautious investment profile. Overall, QUALCOMM’s financial ratios present a more robust picture for ratio-based evaluation.
Strategic Positioning
This section compares the strategic positioning of QUALCOMM and Qnity Electronics, including market position, key segments, and exposure to technological disruption:
QUALCOMM Incorporated
- Market leader with $175B market cap, facing competitive pressure in semiconductors.
- Diverse segments: QCT ($38.4B), QTL ($5.6B), strategic investments in AI, 5G, automotive.
- Invests heavily in foundational wireless tech (3G/4G/5G), AI, and IoT; innovation-driven.
Qnity Electronics, Inc.
- Smaller $19.8B market cap, newer market entrant in semiconductors.
- Focused on semiconductor chip manufacturing materials and electronic solutions.
- Positioned in advanced electronic materials; no explicit data on disruption exposure.
QUALCOMM vs Qnity Electronics Positioning
QUALCOMM follows a diversified approach across multiple technology segments with significant licensing and R&D initiatives, while Qnity Electronics concentrates on semiconductor materials. QUALCOMM’s broad footprint offers scale, but Qnity’s focus may limit diversification benefits.
Which has the best competitive advantage?
QUALCOMM shows a slightly favorable MOAT with value creation despite declining profitability, whereas Qnity Electronics has a neutral MOAT, shedding value with stable profitability, indicating QUALCOMM currently holds a stronger competitive advantage.
Stock Comparison
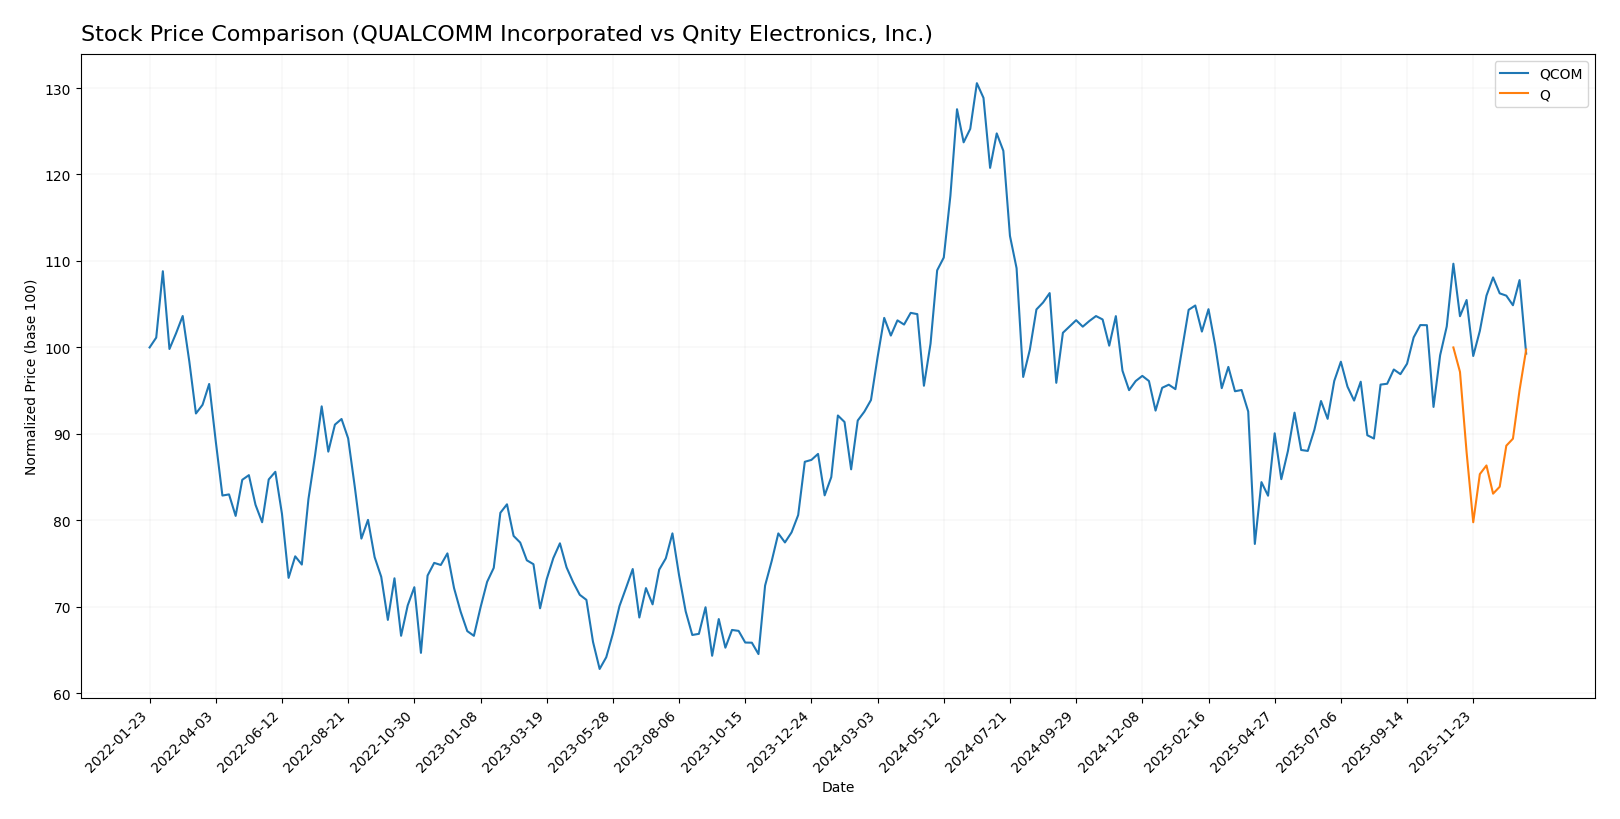
The stock prices of QUALCOMM Incorporated and Qnity Electronics, Inc. have shown contrasting dynamics over the past 12 months, with notable movements in trend direction and trading volumes shaping investor sentiment.
Trend Analysis
QUALCOMM Incorporated’s stock exhibited a bullish trend over the past year with a 5.71% price increase, showing acceleration and reaching a high of 215.33 and a low of 127.46. Recent months saw a reversal with a 9.47% decline, indicating short-term deceleration.
Qnity Electronics, Inc. displayed a neutral to slightly bearish trend with a -0.24% price change over the year, stable acceleration, and a trading range between 75.8 and 95. The recent period maintained this slight downturn without significant volatility shifts.
Comparing both, QUALCOMM’s stock delivered the highest market performance over the last 12 months, outperforming Qnity Electronics in price appreciation despite recent short-term weakness.
Target Prices
The current analyst consensus indicates moderate upside potential for both QUALCOMM Incorporated and Qnity Electronics, Inc. based on their target price ranges.
| Company | Target High | Target Low | Consensus |
|---|---|---|---|
| QUALCOMM Incorporated | 210 | 165 | 185.71 |
| Qnity Electronics, Inc. | 117 | 92 | 105.89 |
QUALCOMM’s consensus target price of 185.71 suggests a potential gain from its current price of approximately 163.79 USD. Qnity Electronics shows a consensus target near 105.89, which is above its current price of 94.77 USD, indicating analyst optimism for growth.
Analyst Opinions Comparison
This section compares analysts’ ratings and grades for QUALCOMM Incorporated and Qnity Electronics, Inc.:
Rating Comparison
QUALCOMM Incorporated Rating
- Rating: B+, considered very favorable by analysts.
- Discounted Cash Flow Score: 4, indicating favorable DCF.
- ROE Score: 5, very favorable efficiency in equity use.
- ROA Score: 5, very favorable asset utilization.
- Debt To Equity Score: 1, very unfavorable due to high debt risk.
- Overall Score: 3, reflecting a moderate overall standing.
Qnity Electronics, Inc. Rating
- Rating: B+, also regarded as very favorable.
- Discounted Cash Flow Score: 4, showing favorable DCF.
- ROE Score: 3, moderate efficiency in generating equity returns.
- ROA Score: 4, favorable asset utilization.
- Debt To Equity Score: 3, moderate financial risk.
- Overall Score: 3, indicating a moderate overall standing.
Which one is the best rated?
Both companies share the same overall rating of B+ and an overall score of 3. QUALCOMM scores higher on ROE and ROA but has a very unfavorable debt-to-equity score, whereas Qnity presents a more balanced debt position but moderate profitability metrics.
Scores Comparison
Here is a comparison of the financial scores for QUALCOMM and Qnity Electronics:
QUALCOMM Scores
- Altman Z-Score: 6.37, indicating a safe zone with low bankruptcy risk.
- Piotroski Score: 7, categorized as strong financial health.
Qnity Electronics Scores
- No data available for Altman Z-Score.
- No data available for Piotroski Score.
Which company has the best scores?
Based on the available data, QUALCOMM shows strong financial health with a safe Altman Z-Score and a strong Piotroski Score, while no scores are available for Qnity Electronics.
Grades Comparison
Here is a detailed comparison of the latest grades from recognized grading companies for both QUALCOMM Incorporated and Qnity Electronics, Inc.:
QUALCOMM Incorporated Grades
The following table summarizes recent grades assigned by reputable firms for QUALCOMM Incorporated:
| Grading Company | Action | New Grade | Date |
|---|---|---|---|
| Mizuho | Downgrade | Neutral | 2026-01-09 |
| Rosenblatt | Maintain | Buy | 2025-11-06 |
| B of A Securities | Maintain | Buy | 2025-11-06 |
| Mizuho | Maintain | Outperform | 2025-11-06 |
| Wells Fargo | Maintain | Underweight | 2025-11-06 |
| Piper Sandler | Maintain | Overweight | 2025-11-06 |
| UBS | Maintain | Neutral | 2025-11-06 |
| JP Morgan | Maintain | Overweight | 2025-11-04 |
| Citigroup | Maintain | Neutral | 2025-10-28 |
| Rosenblatt | Maintain | Buy | 2025-10-28 |
The overall trend for QUALCOMM shows a mix of “Buy,” “Neutral,” and “Outperform” ratings, with a recent downgrade to “Neutral” by Mizuho, indicating a cautious but generally positive outlook.
Qnity Electronics, Inc. Grades
Below is the summary of recent grades for Qnity Electronics, Inc. from recognized grading firms:
| Grading Company | Action | New Grade | Date |
|---|---|---|---|
| RBC Capital | Maintain | Outperform | 2025-11-25 |
| Mizuho | Maintain | Outperform | 2025-11-20 |
Qnity Electronics, Inc. has consistently received “Outperform” ratings from its recent graders, reflecting a strong and positive consensus.
Which company has the best grades?
Qnity Electronics, Inc. holds a stronger consensus with consistent “Outperform” grades compared to QUALCOMM’s more varied ratings including “Buy,” “Neutral,” and a recent downgrade. Investors may interpret Qnity’s grades as signaling higher expected performance, whereas QUALCOMM’s mixed grades suggest moderate risk and reward balance.
Strengths and Weaknesses
Below is a comparison of key strengths and weaknesses for QUALCOMM Incorporated (QCOM) and Qnity Electronics, Inc. (Q) based on the most recent financial and operational data.
| Criterion | QUALCOMM Incorporated (QCOM) | Qnity Electronics, Inc. (Q) |
|---|---|---|
| Diversification | Strong: Diverse segments including QCT ($38.4B) and QTL ($5.6B) in 2025 | Limited revenue diversification; no detailed segment data available |
| Profitability | Favorable: Net margin 12.5%, ROE 26.1%, ROIC 13.2% (2025) | Moderate: Net margin 16.0%, but low ROE 6.5%, ROIC 5.9% (2024) |
| Innovation | High: Consistent value creation with ROIC > WACC, though declining trend | Neutral: Stable ROIC but no competitive advantage evident yet |
| Global presence | Extensive: Large global market share and recognized brand | Smaller footprint; limited data on global scale |
| Market Share | Strong: Significant share in semiconductor and licensing markets | Relatively small and niche player with limited market presence |
Key takeaways: QUALCOMM demonstrates robust profitability, strong diversification, and a clear competitive moat despite a recent decline in profitability. Qnity Electronics has stable profitability but lacks a proven competitive advantage and shows limited diversification, suggesting higher investment risk.
Risk Analysis
Below is a risk comparison table for QUALCOMM Incorporated (QCOM) and Qnity Electronics, Inc. (Q) based on the latest available data for 2025 and 2024 respectively:
| Metric | QUALCOMM Incorporated (QCOM) | Qnity Electronics, Inc. (Q) |
|---|---|---|
| Market Risk | Beta 1.21, moderate volatility | Beta 0, low volatility but less tested publicly |
| Debt level | Debt/Equity 0.7 (neutral), Debt-to-assets 29.54% (favorable) | Debt/Equity 0.02 (favorable), Debt-to-assets 1.56% (favorable) |
| Regulatory Risk | High, due to global licensing & patents exposure | Moderate, focused on electronic materials and manufacturing |
| Operational Risk | Moderate, complex global supply chain | Moderate, newer company with less operational history |
| Environmental Risk | Moderate, semiconductor manufacturing impacts | Moderate, advanced materials production impact |
| Geopolitical Risk | Elevated, global wireless industry exposure | Moderate, US based with limited international footprint |
Synthesis: Market and regulatory risks are most impactful for QUALCOMM due to its global licensing business and semiconductor industry cyclicality. Qnity Electronics faces lower debt and market volatility but operational risks persist due to its recent IPO and less established track record. Both companies require monitoring of geopolitical tensions affecting the tech supply chain.
Which Stock to Choose?
QUALCOMM Incorporated (QCOM) shows favorable income evolution with strong revenue and gross profit growth, alongside solid profitability and a favorable global income statement opinion. Its financial ratios are mostly favorable, reflecting good liquidity and value creation despite some unfavorable valuation metrics. The company carries moderate debt and holds a very favorable rating.
Qnity Electronics, Inc. (Q) demonstrates favorable income statement metrics with steady EBIT and net margin growth, though overall revenue and net income have declined over the longer period. Its financial ratios present a mixed picture with some favorable liquidity and low debt, but weaker profitability and valuation metrics. The rating is also very favorable but with more moderate score components.
Investors prioritizing consistent value creation and stronger profitability might view QUALCOMM’s profile as slightly more favorable, while those who seek a company with low debt and improving margins might find Qnity’s stable profitability and conservative financial structure appealing. The choice could depend on whether an investor prefers established profitability and scale or a potentially less leveraged business with moderate growth.
Disclaimer: Investment carries a risk of loss of initial capital. The past performance is not a reliable indicator of future results. Be sure to understand risks before making an investment decision.
Go Further
I encourage you to read the complete analyses of QUALCOMM Incorporated and Qnity Electronics, Inc. to enhance your investment decisions: